XAU/USD | Gold at a Turning Point – Breakout or Breakdown Ahead?By analyzing the gold chart on the 4-hour timeframe, we can see that after our last analysis, gold continued its correction and dropped to $3358. It’s currently trading around $3367, and for the bullish scenario to remain valid, we need to see price hold above $3358 and soon close above $3370. If this happens, another bullish move could follow.
Otherwise, if gold breaks and stabilizes below $3358, this scenario will be invalidated, and the alternative outlook suggests further downside toward $3349 and $3339. This analysis will be updated — and don’t forget to show your support, friends!
Please support me with your likes and comments to motivate me to share more analysis with you and share your opinion about the possible trend of this chart with me !
Best Regards , Arman Shaban
Trump

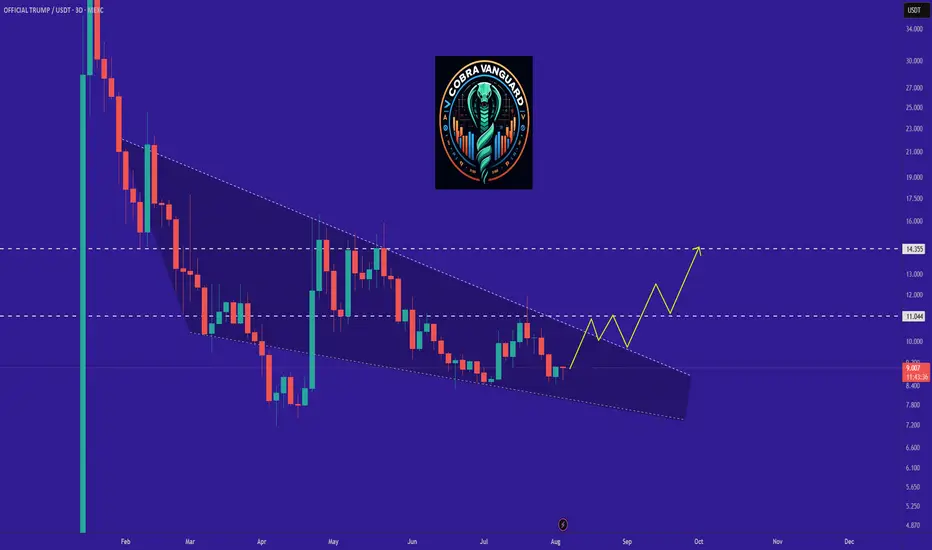
TRUMP is bullish now and many Traders don't see it !!So if you pay attention to the TRUMP chart you can see that the price has formed a Ascending wedge which means it is expected to price move as equal as the measured price movement.( AB=CD )
NOTE: wait for break of the WEDGE .
Best regards CobraVanguard.💚
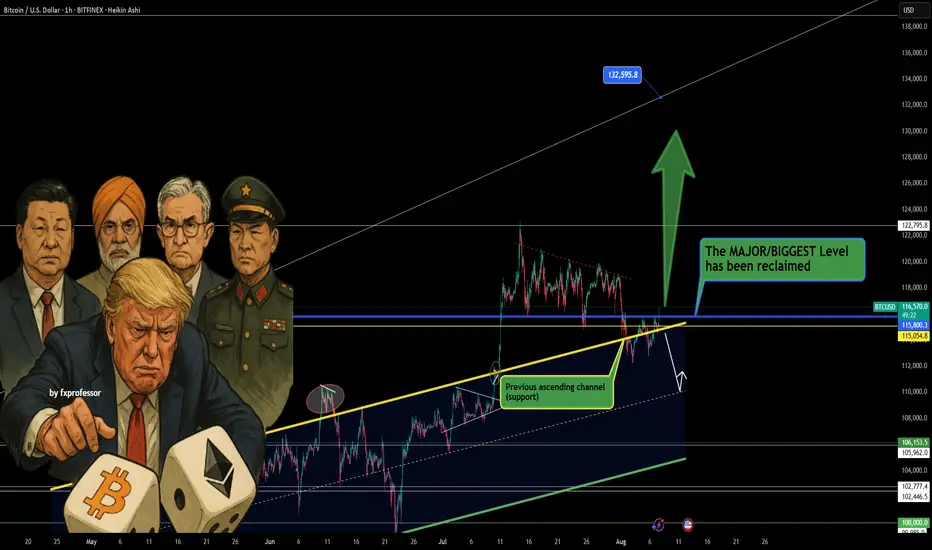
Trump Boosts 401K Crypto Talk, But BTC Levels Lead the Way UP📢💥 Trump Boosts 401K Crypto Talk, But BTC Levels Lead the Way UP 🧠📊
News just dropped that President Trump may sign an executive order allowing crypto into 401(k) retirement plans. 🇺🇸📜 While that’s a massive headline, let’s stay grounded—we play the levels, not the politics. 🧘♂️📉📈
⚠️ A quick disclaimer: It’s Trump, so… let’s see if the ink even hits the paper. But price is king, and the chart already gave us the real signal.
🔄 Bitcoin just reclaimed the single most important level: $115,800. This isn’t just a number—it was the previous ascending channel’s support, and it’s now acting as strong support again. This changes the game.
🟢 As I’ve mentioned in previous ideas, I remain hedged:
✔️ Long BTC
❌ Short S&P 500
That ratio is working out well, as shared earlier today in the post:
“Bitcoin vs S&P 500 – Ratio Signals Strength” — it’s clear which asset the market favors. BTC is holding structure. SPX? Not so much. 📉🔍
🎯 Next upside target: $122,795
🚀 Bigger extension level: $132,595
🛑 Breakdown invalidation: Loss of $115,800 would weaken the case.
News or not, structure always wins. Stay sharp, stay level-headed. The market rewards those who listen to the chart, not the noise. 📡🧠
One Love,
The FX PROFESSOR 💙
Disclosure: I am happy to be part of the Trade Nation's Influencer program and receive a monthly fee for using their TradingView charts in my analysis. Awesome broker, where the trader really comes first! 🌟🤝📈
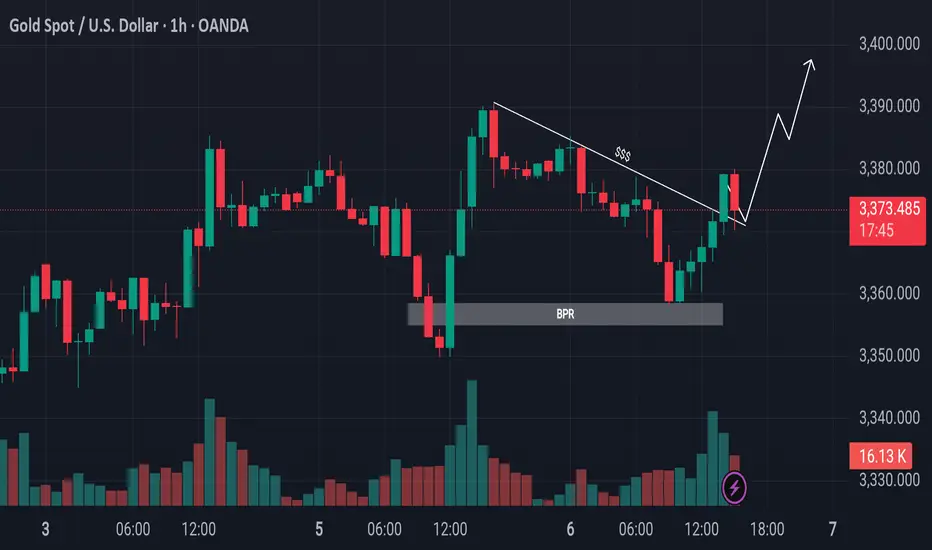
Gold Retraces to OTE and Breaks ResistanceEyes on Swing Highs!Gold Market Update
The gold market declined from its previous bullish leg and retraced below the 50% level, reaching into the Optimal Trade Entry (OTE) zone. It also tapped into a Bullish Price Rejection (BPR) area. Following that, price broke above the trendline resistance. Currently, it is advisable to wait for a potential retest of the breakout level. If confirmed, the market could continue its upward movement toward the previous swing highs.
Do Your Own Research (DYOR)
GOLD BUY INTACTFinal bullrun towards 34xx plus is remaining to complete ite wave before goes sideways to decide either going down or ATH

$INTC - Best in the sector against Trump tariffsIntel is a semiconductor technology giant, renowned for its x86 processors that dominate the CPU segment, top revenue in Q2 2025 came from PC chips (Client Computing Group, ~$7.9B) and server/AI chips (Data Center & AI, ~$3.9B) . Other revenue includes foundry services ($4.4B) and legacy businesses ($1.1B).
But, for the last 4 years the company has experienced one disaster after another:
- Loss of Market Share & Intensified Competition vs AMDs Ryzen and NVIDIA AI GPUs has been major drivers for last 4 years of decline.
- Gross margin dropped to around 38–39% in 2024—a steep fall from pre‑pandemic levels above 60%, while NVIDIA maintained margins above 75%.
- Intel perpetually lagged in transitioning to advanced nodes (7 nm, 5 nm), resulting in costly delays and reduced competitiveness .
- Credit rating downgrade: In August 2025, Fitch downgraded Intel’s credit rating from BBB+ to BBB (negative outlook) due to weak demand and deteriorating profitability . S&P had already downgraded Intel to BB+, and Moody's also cut its rating in 2024 .
Recent events and price action show its time for a buy at these prices.
- Spin-off of Network & Edge (NEX) group: Intel announced the spin-off of its Network and Edge Group (NEX) into an independent entity focused on critical communications and networks, seeking external investors while retaining a major stake .
- Workforce reduction and factory cancellations: Intel confirmed layoffs of ~24,000 employees (~15% of workforce) and cancellation of chip plant projects in Germany and Poland . New CEO Lip-Bu Tan plans to cut the headcount to ~75,000 by year-end 2025 .
- Executive departures and internal reorganization: Three corporate VPs (Kaizad Mistry, Ryan Russell, Gary Patton) announced retirement from manufacturing operations amid deep restructuring . Intel also cut its manufacturing capacity planning and engineering teams as part of an efficiency-driven reorganization .
- Recent key products/services: Intel launched new Xeon 6 CPUs for AI workloads (e.g. Xeon 6776P) and is preparing Panther Lake CPUs (PCs) for 2025 . It also began 18A node production in Arizona and sold part of its Mobileye stake (~$922M) to boost liquidity .
Price/sales: Intel (0.80), AMD (10.3), NVIDIA (29.6), QCOM (3.68)
Wrap-Up
Intel's last four years have been marked by a series of structural, competitive, and strategic challenges—ranging from manufacturing delays to margin erosion and intense pressure from rivals like AMD and NVIDIA. Yet, the tide may be turning. With decisive actions like major cost-cutting initiatives, new AI-focused products, and progress in advanced node production, Intel is signaling a strategic pivot. Trading at a deep discount relative to peers based on the price-to-sales ratio, the stock reflects much of the past negativity. For investors seeking a long-term turnaround play in the semiconductor sector, now could be the moment to re-evaluate Intel’s potential.
Let’s see if this chip giant can turn the corner. Cheers!
Pablin

CVX: Chevron stock slidingPresident Trump policies to support oil companies aiming to increase oil supply in the market and hence to reduce oil prices not to increase it, which mean lower margins for oil companies.
Disclaimer: This content is NOT a financial advise, it is for educational purpose only.

Bitcoin - Will Bitcoin reach its previous ATH?!Bitcoin is below the EMA50 and EMA200 on the four-hour timeframe and is in its short-term descending channel. In case of an upward correction, Bitcoin can be sold from the specified supply zone, which is also at the intersection of the ceiling of the descending channel.
It should be noted that there is a possibility of heavy fluctuations and shadows due to the movement of whales in the market and compliance with capital management in the cryptocurrency market will be more important. If the downward trend continues, we can buy in the demand range.
In recent days, Bitcoin has stabilized below the $120,000 mark, a development that reflects increasing structural maturity in the market and strong institutional capital inflows. Unlike in previous cycles, where price rallies were largely driven by retail hype, the current liquidity flows are channeled through regulated and professional instruments like ETFs. During the month of July alone, Bitcoin ETFs attracted over $6 billion in inflows, marking the third-highest monthly inflow in their history. Leading this trend were BlackRock’s IBIT and Fidelity’s FBTC, which together recorded more than $1.2 billion in net inflows within a single week. This signals a shift in trust from traditional investors toward crypto markets—within transparent, traceable, and regulated frameworks.
On-chain metrics further validate this shift. The MVRV ratio, which compares market value to realized value, is currently fluctuating between 2.2 and 2.34. These levels do not indicate profit-taking extremes nor fear of major corrections, but instead point to a healthy and rationally profitable market. Meanwhile, the supply of Bitcoin held in non-exchange wallets is rising, while exchange-held balances have dropped to their lowest levels in a decade, now accounting for just 1.25% of total supply. This trend implies reduced short-term selling pressure, as coins transition from liquid to long-term holdings.
Trader behavior is also evolving. Unlike previous bull runs, profit-taking remains controlled. The SOPR index, which measures realized profit relative to purchase price, has not yet reached saturation levels. This suggests that current holders are not satisfied with existing gains and are anticipating higher price levels. Furthermore, metrics like daily active addresses remain stable, indicating a lack of speculative retail influx. The network’s current dynamics resemble those of mature traditional markets, where investment decisions are guided by analysis, discipline, and long-term perspective.
Analysts at major financial institutions believe that if this trend continues, Bitcoin could reach targets of $180,000 to $200,000 by year-end. A more conservative scenario places the $95,000 to $100,000 range as a strong support zone—especially if political, regulatory, or macroeconomic pressures intensify. Overall, the convergence of institutional capital, rational trader behavior, stable on-chain conditions, and regulatory clarity has transformed Bitcoin into a more structured and dependable asset than ever before.
Ultimately, Bitcoin is no longer just a speculative tool. It has secured its role as a legitimate asset within the portfolios of global financial institutions. Even if the pace of capital inflow is slower than in previous cycles, the underlying structure is more robust and sustainable—offering a clearer path toward broader global adoption and higher valuation.
Nonetheless, recent data from CryptoQuant suggests that long-term Bitcoin holders (LTHs) have begun net selling near the $120,000 resistance zone—a psychologically significant level in Bitcoin’s price history. Analysts interpret this as a potential sign that veteran investors—those who entered during earlier market cycles—are now realizing profits as prices reach historic highs. If short-term holders follow suit, this shift could amplify selling pressure and trigger heightened price volatility.

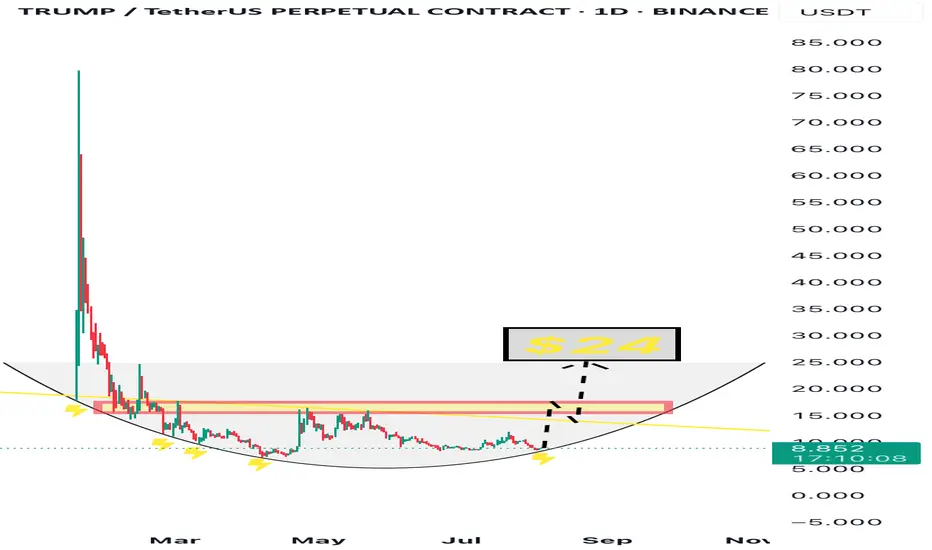
$TRUMP - Rounding Bottom + Strong Narrative We’re currently witnessing a classic rounding bottom formation on the $TRUMP chart.
The price has touched the base 4 separate times, each followed by a bounce — clearly indicating strong support and accumulation.
Now, once again, $TRUMP is testing this base, and structurally the chart suggests a potential breakout toward $24, the top of the cup.
But it’s not just a technical story — the fundamentals are stronger than ever:
• 🎲 A Trump-themed Monopoly game has been officially confirmed by Bill Zanker and the project’s team
• 💸 Justin Sun has publicly announced he will purchase $100 million worth of $TRUMP tokens
• 🛡 Eric Trump revealed that $TRUMP will be added to WLFI’s strategic reserves
This is no longer just speculation — it’s momentum backed by real players.
All eyes on the $24 breakout.
EURUSD: tariffs impact?The previous week was a very intensive one when it comes to US macro data. Certainly, the most important weekly event was the FOMC meeting, where the Fed left interest rates unchanged at current levels. As per information by Fed Chair Powell, the economy is in a solid condition. Growth is at a moderate pace, with some decrease due to decrease in consumer spending. Although inflation remains relatively near to the targeted level of 2%, still, there are some indications of its modest pick-up, as a reflection of implemented tariffs. The Fed will continue further to balance interest rates based on “the incoming data, the evolving outlook and the balance of risks”. The full effects of implemented tariffs is to be seen in the future period, but there are Fed expectations that these effects might be a one-time effect on inflation. Fed Chair Powell did not provide a clear answer regarding the potential cut of interest rates in September.
On the other hand, the bulk of important macro data was released during the previous week, providing some insight to investors that the economy is starting to see the effects of tariffs, but also increasing their expectations that the rate cut might occur in September. The week started with JOLTs Job Openings data for June, which reached 7.437M and were lower from expected 7,55M. The GDP Growth Rate estimate for Q2 is 3% for the quarter, which was better from forecasted 2,4%. The PCE Price Index in June reached 0,3% for the month and 2,6% for the year. At the same time, the core PCE was also standing at 0,3% in June. Personal Income increased by 0,3% in June, while Personal Spending also reached 0,3% in the same period. Huge weekly surprises were the Non-farm payrolls which were increased by 73K in July, well below market estimate of 110K. The unemployment rate modestly increased to the level of 4,2% in July from 4,1% posted previously. Friday brought the University of Michigan Consumer Sentiment final for July at the level of 61,7 which was fully in line with market expectations. The five years inflation expectations were further decreased to the level of 3,4% from previous 4%.
Data posted for the Euro Zone include the GDP Growth rate estimate for Q2 of 0,1% for the quarter and 1,4% on a yearly basis. Both figures were higher from estimated 0% q/q and 1,2% y/y. The GDP Growth Rate in Germany in Q2 was standing in the negative territory of -0,1% for the quarter and +0,4% on a yearly basis. The inflation rate in Germany preliminary for July was standing at 0,3% for the month and 2% y/y. The inflation rate flash in July in the Euro Zone was 2%, just a bit higher from market estimate of 1,9%. The core inflation reached 2,3%.
The week full of important macro data guaranteed higher volatility in the value of the U.S. Dollar. During the first half of the week, markets favored the USD, which reached the highest value against the euro at 1,14. However, Friday trading session and the release of surprisingly weak NFP data, brought the value of currency pair back toward the 1,1586 level. The RSI modestly touched the level of 31 and swiftly turned back toward the 48. Clear oversold market side has not been reached on this occasion. The MA 50 slowed down its divergence from MA200, but with a still large distance between the two lines, the cross is not in the store for some time.
Markets will use the week ahead to digest all the data posted during the previous week. For the US there are no currently important data scheduled for a release, in which sense, market moves could be much calmer. During the previous week, the support line at 1,14 has been tested, however, the 1,16 resistance is pending clear testing. In this sense, it is possible that the market will start the week ahead with a move toward the 1,16 level, heading toward 1,650 eventually 1,1680. At this moment on charts there is a lower probability for 1,17 levels. A move toward the down side is also probable, where 1,15 is currently marked on charts.
Important news to watch during the week ahead are:
EUR: Retail Sales in June in the Euro Zone, Balance of Trade in June in Germany, Industrial Production in June in Germany,
USD: ISM Services PMI in July.

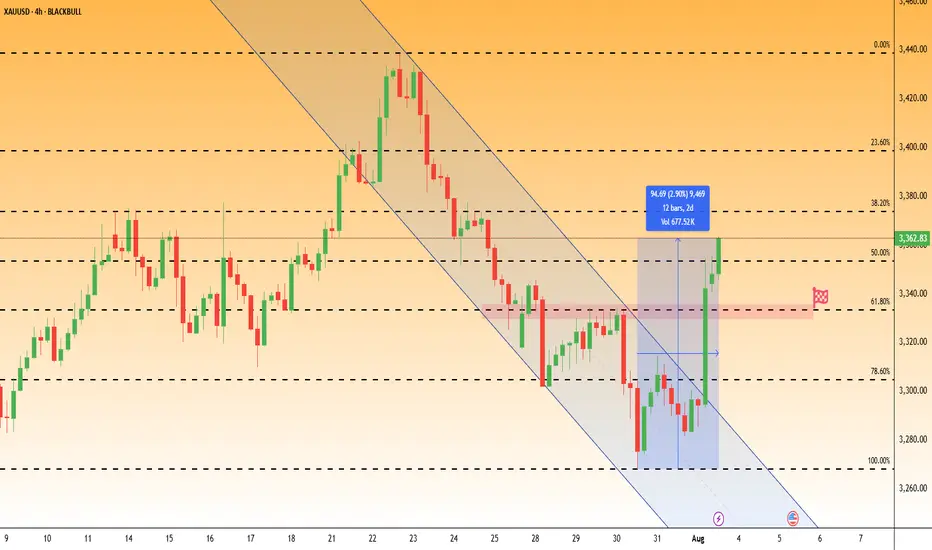
What to trade if you can't trust jobs data? U.S. President Donald Trump has dismissed the head of the Bureau of Labor Statistics (BLS), reportedly in response to jobs figures he disagreed with.
This raises concerns about the integrity of government-reported economic data, especially ahead of the next key Non-Farm Payrolls (NFP) release on September 5.
This upcoming report also includes the BLS’s annual revision, adjusting past job growth figures from April 2024 through March 2025. Goldman Sachs “estimate a downward revision on the order of 550,000 to 950,000 jobs—or a reduction of 45,000 to 80,000 jobs per month over the April 2024 to March 2025 period.”
Given macro uncertainty and signs of distrust in U.S. economic data, the bid for gold may persist.
Gold has rebounded sharply in recent sessions, breaking a short-term downtrend and climbing back above the 3,360 level. Price has now retraced more than 50.0% of the July 24–31 selloff. The pair may be Short-term bullish, if price holds above 3,310.
TRUMP/USDT - SHORT/LONGImplementation will take about a month and a half.
(This is not an investment recommendation).

The Great Trap: How Billionaires Are Winning, and You're Not!The Great Crypto Trap: How Billionaires Are Winning—And You're Not
The ETFs, Saylor, and all of Trump's billionaire friends are getting richer—thanks to crypto.
Meanwhile, most retail traders are just trying to stay above water. Leverage trades are wiped out, charts feel rigged, and the market makes you feel like you're swimming against a riptide.
Why?
Because these rich guys have a plan: manipulate you and take your money. That’s how they stay rich.
Understanding their strategy is the first step to stop being their exit liquidity.
🧠 The New Battlefield
Crypto is no longer a playground for cypherpunks and tech rebels. It’s fully institutional now. We're not just trading against whales—we're fighting the same entities that own the media, control Wall Street, and write the rules.
So forget the old ways of thinking. The tables have turned.
🗓 The Sunday Rekt Routine
To maximize destruction, they need to avoid friendly fire. So they pump on the weekend when retail is free and optimistic, then dump on Monday to close the CME gap—like clockwork.
The playbook:
Weekend: Pump. Trap your long.
Monday: Dump. “Fill the gap.” Liquidate everyone.
Response:
Don’t fall for weekend FOMO. Exit Sunday afternoon. Wait until Tuesday to re-enter, once Monday’s high and low are set. Trade smart, not emotional.
📈 Top-of-the-Market FOMO
You’ve seen it before. Just before the crash, the media frenzy begins. Influencers say “Don’t miss this pump!” or “99% will miss the next big move!” The ETF gods hint at new inflows. It's a setup.
They're not hyping it for your benefit—they're offloading their bags in your face.
Just look at the charts:
BlackRock bought billions to drive BTC to 121K.
Then, in 72 hours, they dumped billions.
Saylor? Silent. No new buys. That’s not coincidence—it’s coordination.
Response:
Check the MACD, RSI, and Stochastic RSI on daily or weekly timeframes. If they're maxed out and the influencers are screaming green—it’s probably too late.
When they stop buying, the dump is already planned.
🧰 How to Outsmart Them
Watch the MACD for crossovers and divergence.
Monitor RSI zones—don’t long into extreme overbought conditions.
Use Stoch RSI to anticipate momentum shifts.
Rule: When everything is overheated, and FOMO is peaking—step back. Let them dump into each other. You’ll get your entry later, cleaner and cheaper.
⚔️ This Is War
Make no mistake: this is a war for your money.
They want yours. You want theirs.
Only the smart survive.
To be continued.
DYOR.

Direct Buy In Gold : Coming Currently gold is trading under falling wedge pattern which will explode soon once volume will come . Buying here is good idea imao

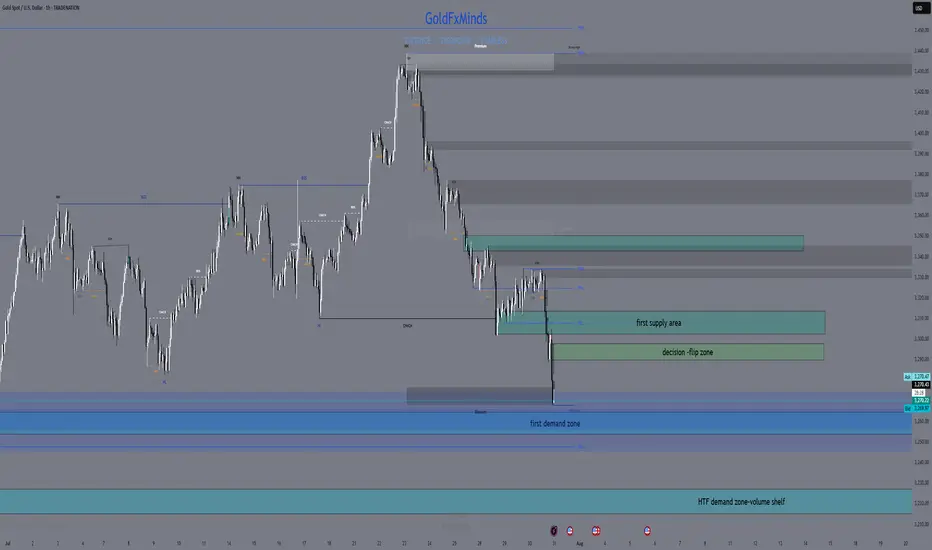
XAUUSD Market Update – July 30 Late NY Recap🔸Macro Context
Markets are still digesting Powell’s ongoing speech with no clear pivot signals. While FOMC tone remained cautious, no dovish surprise emerged. Trump’s upcoming comments keep geopolitical risks elevated. USD remains firm. Gold is reacting within key HTF demand as intraday volatility cools off.
🔸Bias Overview
Weekly Bias:
• Bearish rejection from the major supply wick 3439–3350
• Structure still below 3345, maintaining downside pressure
• Weekly RSI cooling off — no bullish divergence yet
Daily Bias:
• Lower high locked below 3345
• Price reentered the imbalance toward 3272
• Clean structure remains bearish unless we reclaim 3302
H4 Bias:
• Lower high formed at 3314
• Current price testing HTF Extreme Demand Base (3289–3272)
• Still bearish unless we see a confirmed M15 or H1 BOS from demand
🔸Key Structural Zones
🔺Above Price (3272):
• 3289–3294
Decision Block – M30 OB + FVG. First sign of momentum shift if reclaimed.
• 3302–3314
Supply Reversal – H1 OB + previous BOS zone. EMA alignment adds pressure.
• 3345–3350
Major Rejection Zone – H4 origin of last leg down. Strong resistance area.
🔻Below Price (3272):
• 3254–3264
Imbalance + OB – H4 FVG + clean demand zone. Buy setup only on deep flush + reversal PA.
• 3227–3214
HTF Demand Base – Daily OB + historical volume shelf. Final structural floor before deeper downside opens.
🔸Battle Plan
▶ Scenario 1 – Bearish Breakout
If 3272 fails with momentum and no reversal signs, expect continuation into 3254–3264.
No long trades unless BOS confirms.
▶ Scenario 2 – Reactive Long from Demand
If price gives a strong reaction from 3272 with BOS on M15 or H1 and clears 3294, then a recovery into 3302 is possible. Only valid with confirmed PA + EMA shift.
▶ Scenario 3 – Choppy Rejection from 3294
If price tests 3294 but fails, watch for rejections back toward 3272. Scalpers can fade reactions if no bullish structure forms.
🔸Final Thoughts
Price is once again testing our Extreme Demand Base from July 28 (3289–3272). The zone remains valid — but execution depends entirely on confirmation. Bears still in control unless we reclaim 3302 cleanly.
No need to rush. Best RR setups are found at clean structural edges.
Patience = profits.
—💬 Drop your thoughts in the comments.
❤️ Like if you appreciate the precision.
🔔 Follow GoldFxMinds for more sniper-level updates.
With you all the way,
— GoldFxMinds
📊 Analysis based on Trade Nation TradingView charts.
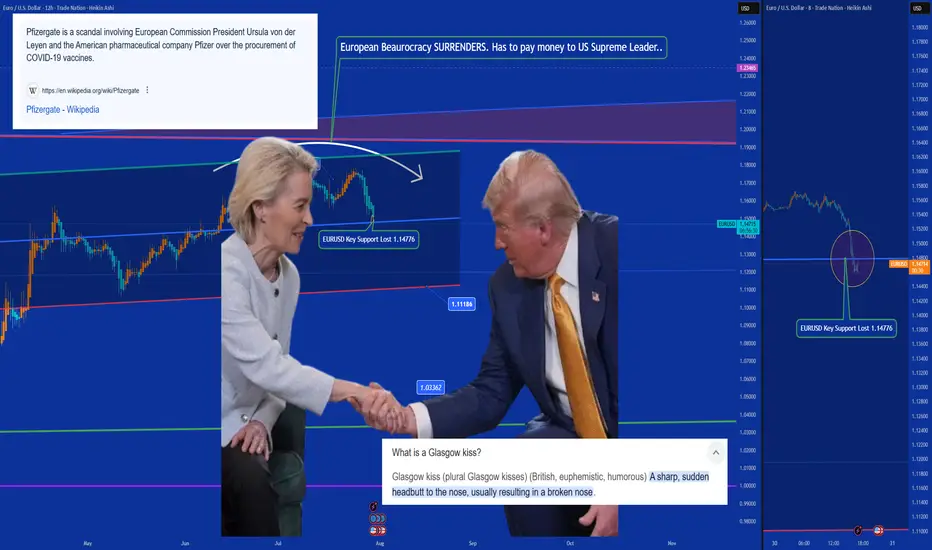
Ursulization = Bureaucracy > Democracy (a.k.a. The Glasgow Kiss)🤝💥 Ursulization – Bureaucracy Replaces Democracy (a.k.a. The Glasgow Kiss) 🇺🇸🇪🇺
📍Background:
The media spun it as a "15% tariff agreement"…
But in reality, this wasn’t diplomacy — it was a disguised capitulation.
And the stage? None other than Scotland, ancestral ground of Donald J. Trump.
So when Ursula von der Leyen came seeking a gentle diplomatic handshake…
What she received instead was the infamous Glasgow Kiss — sudden, sharp, and unmissable.
💥 What’s a Glasgow Kiss?
A British slang term for a violent headbutt to the face —
No grace. No warning. Just raw force.
💬 The Real Story:
Ursula von der Leyen — unelected, unaccountable —
signed off on $1.4 trillion in U.S.-bound capital flows:
💸 $750B to buy American energy
🛠 $600B in U.S. infrastructure, defense & industry
All to sidestep 50% tariffs the Trump team had ready to roll.
But here's the kicker:
She wasn’t acting on behalf of European citizens.
She was speaking for the bureaucracy, not the people.
🔥 Welcome to Ursulization:
Where democracy is sidelined by unelected power.
Where negotiations happen in silence.
Where scandals like PfizerGate get buried while the euro breaks down.
📉 EUR/USD just lost key support at 1.14776 —
The chart shows t he cost of surrender.
💉 PfizerGate Reminder:
Ursula already faced heat for secretive vaccine contracts with Pfizer.
Now, she’s handing over Europe’s industrial backbone —
To Trump. In Scotland. With no public mandate.
📌 Conclusion:
Trump didn’t compromise — he collided.
Europe didn’t resist — it surrendered.
This wasn’t diplomacy.
It was a Glasgow Kiss — a collision between legitimacy and bureaucratic power.
👑 One elected by the people (Trump). One not elected at all (Woke agenda style Ursula).
💰 One walks away with trillions (Trump). The other, with silence (Ursula 'Von der Pfizinen never electenen'').
One Love,
The FXPROFESSOR 💙
ps. Till we can bring Democracy and Europe back.
Disclosure: I am happy to be part of the Trade Nation's Influencer program and receive a monthly fee for using their TradingView charts in my analysis. Awesome broker, where the trader really comes first! 🌟🤝📈


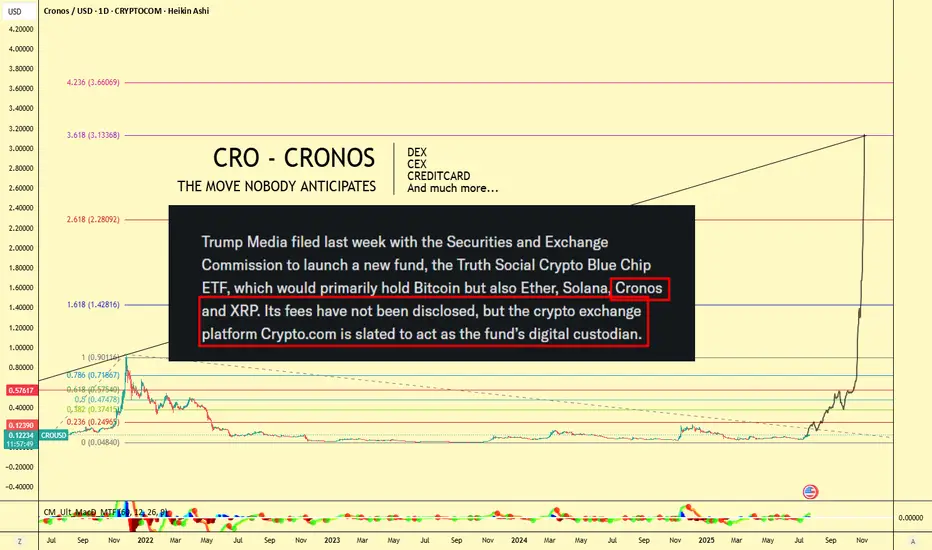
CRO (Crypto.com) $3 Target! Don't Miss This Move🪙 Ticker: OKX:CROUSDT
🕰 Chart: 1D (Heikin Ashi)
🔧 Tools Used: Fibonacci Extension, Fundamental News (ETF Filing)
🔍 Chart Analysis: Fibonacci Extension Targeting $3+
The Fibonacci Extension tool has been applied to the major CRO impulse wave from its peak near $0.90 (late 2021) to the 2022–2023 bottom at $0.0484, confirming a multi-year retracement and consolidation period.
Let’s break down the major Fib levels:
Extension Level Price Target
0.236 $0.2495
0.382 $0.3741
0.618 $0.5745
1.0 $0.9011
1.618 $1.4281
2.618 $2.2809
3.618 $3.1336
📌 Current Price: ~$0.12
🔥 Upside Potential to $3.13+ — a 25x move from current levels if full extension plays out!
📣 Fundamental Catalyst: CRO in Trump Media ETF
According to the chart note (sourced from SEC-related headlines):
"Trump Media filed with the SEC to launch a new ETF, the Truth Social Crypto Blue Chip ETF, which would primarily hold Bitcoin, but also Ether, Solana, Cronos (CRO), and XRP."
Even more important:
"Crypto.com is slated to act as the fund’s digital custodian."
This is massive fundamental validation for CRO — not just as a token, but as an ecosystem and financial infrastructure provider.
🌐 Why Crypto.com Matters: Utility, Ecosystem, Adoption
Crypto.com isn't just an exchange — it's a comprehensive Web3 ecosystem, which includes:
🔁 CEX (Centralized Exchange):
Buy, sell, stake, and trade hundreds of cryptocurrencies with high liquidity and low fees.
🔄 DEX (Decentralized Exchange):
Cronos Chain supports decentralized trading and DeFi apps — with low gas fees and EVM compatibility.
💳 Visa Credit Card Integration:
Crypto.com offers one of the most popular crypto Visa debit cards — earn cashback in CRO and enjoy perks like Spotify/Netflix rebates.
📱 Mobile Super App:
Buy/sell/stake/farm on-the-go with a seamless user interface.
📈 Earn & Lending Services:
Stake CRO or other assets for up to double-digit yields.
🤝 Strategic Partnerships
Crypto.com has been aggressively investing in brand and adoption:
🏟 Official partner of UFC, FIFA World Cup, and Formula 1
🏀 NBA’s Los Angeles Lakers Arena naming rights (Crypto.com Arena)
💼 Member of Singapore's regulated exchanges
🔐 ISO/IEC 27701:2019, PCI:DSS 3.2.1, and SOC 2 compliance — one of the most secure platforms in the industry
🧠 Conclusion: The Perfect Blend of TA + FA
With CRO being included in a potential U.S.-regulated ETF, the Crypto.com ecosystem booming, and technical patterns pointing to a Fib-based target above $3, CRO might be the sleeper play of the next bull run.
"The move nobody anticipates" might just be the most explosive one.
🎯 Short-Term Targets:
$0.25
$0.37
$0.57
🎯 Mid-Term Bull Targets:
$0.90 (prior ATH)
$1.42
$2.28
🎯 Full Cycle Extension:
$3.13
📢 Let me know in the comments:
Are you holding GETTEX:CRO ? What do you think about its inclusion in the ETF?
#CRO #CryptoCom #ETF #TrumpMedia #Altcoins #Bullrun #CryptoTrading #DeFi #FibTargets #CronosChain
DXY - ABC Move still in playDXY has been moving not so much on technical factors lately but more so with what Mr. Trump says, we still could see a move lower with an ABC pattern.
Good Luck

Bitcoin - Will Bitcoin continue its upward trend?!Bitcoin is above the EMA50 and EMA200 on the four-hour timeframe and is in its medium-term ascending channel. Bitcoin’s current upward momentum has the potential to reach its previous ATH. If it corrects, you can look for Bitcoin buying opportunities from the identified support area, which is also at the intersection of the bottom of the ascending channel.
If this support is lost, the decline will continue to around $113,000, where you can again buy Bitcoin with a better risk-reward ratio.
It should be noted that there is a possibility of heavy fluctuations and shadows due to the movement of whales in the market, and capital management will be more important in the cryptocurrency market. If the downward trend continues, we can buy within the demand range.
Last week, a group of U.S. senators released an initial draft of a new legislative proposal aimed at creating a clearer regulatory framework for the digital asset industry in the United States. The proposal builds on the recently passed CLARITY Act in the House of Representatives and focuses on strengthening market structure, enhancing consumer protection, and expanding regulatory oversight.
According to the senators, the bill addresses key areas such as banking, disclosure requirements, securities classification, and measures to combat illicit financial activity.Senator Lummis, in highlighting the proposal, stressed the urgent need for legal clarity to support the growth of this emerging industry within the U.S. The legislation aims to facilitate the integration of digital assets into banking services and would allow financial holding companies to provide services based on such assets.
The draft also includes measures aimed at preventing illegal financial activities, such as improving regulatory standards and boosting inter-agency cooperation to identify and block misuse of digital assets.
In addition, the senators have issued a “Request for Information” (RFI) to support the legislative process and have invited the public to share their opinions on more than 35 related topics, encouraging broader engagement in shaping the bill.
Meanwhile, in Asia, Japan-based firm Metaplanet announced that it has added 780 BTC worth $93 million to its digital holdings. This acquisition brings the company’s total Bitcoin reserves to 17,132 BTC, valued at roughly $2 billion. Metaplanet is fast becoming one of the largest institutional Bitcoin treasuries in the region—potentially serving as a model for other firms across Asia.
At the same time, publicly traded U.S. companies have significantly ramped up their Bitcoin holdings. By the end of Q2 2025, these companies had accumulated nearly 900,000 BTC, marking a 35% increase over the previous quarter. This surge, driven primarily by firms such as MicroStrategy, has sent demand for Bitcoin soaring.
Some analysts believe that the $1.5 trillion in free cash flow held by companies within the S&P 500 index could spark a new wave of institutional Bitcoin buying.
Looking ahead, the upcoming week is packed with critical U.S. economic data. Alongside the Non-Farm Payroll (NFP) employment report and inflation metrics via the Personal Consumption Expenditures (PCE) index, the initial estimate for Gross Domestic Product (GDP) and various other indicators will be released—potentially offering a clearer picture of where the U.S. economy is heading.
The Federal Reserve remains primarily focused on inflation and labor market dynamics. June CPI data indicated signs of inflationary pressure caused by tariffs. If Thursday’s PCE report—particularly its core reading—confirms a similar trend, the Fed may decide against a rate cut in September. As a result, financial markets have priced in only about a 65% chance of a rate cut at that meeting.

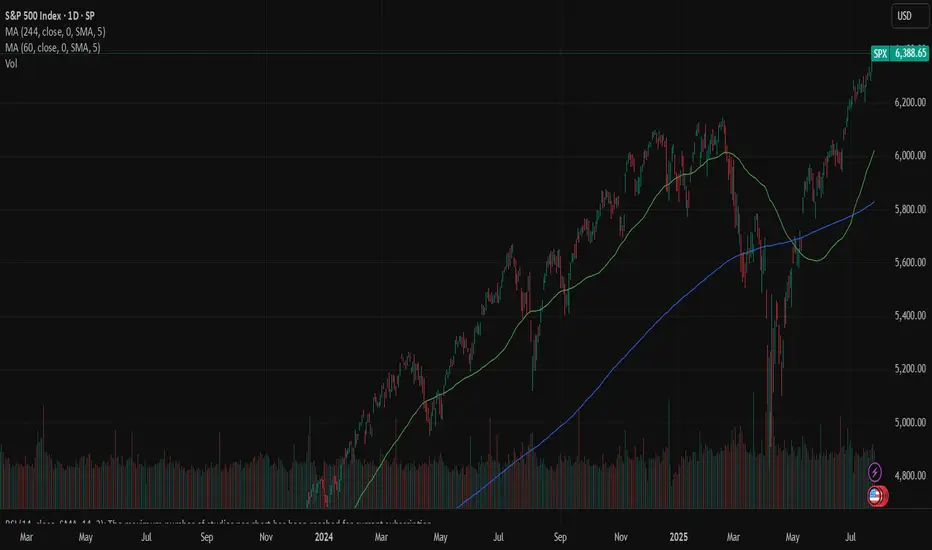
SPX: Tariffs deal (un)certainty Investors' optimism continued to hold at the U.S. equity markets another week in a row. The S&P 500 posted another weekly winning streak, supported by solid earnings of companies included in the index. The index also reached another all time highest level, with Friday's level of 6.388, gaining around 1,5% for the week.
Tech companies were once again main contributors to the surge of the index. Alphabet posted better than expected quarterly results, supporting the surge in share price of 4%. Tesla shares gained 3,5% for the week. The company reported strong vehicle delivery numbers and progress in AI-driven autonomous driving technology. Analysts are noting that 82% of all companies included in the S&P 500 index, that have already reported quarterly results, have beaten the market expectations.
Alongside strong earnings reports, recent advancements in U.S. trade negotiations have contributed to market gains. Earlier this week, President Donald Trump announced a significant trade agreement with Japan, which includes a 15% reciprocal tariff arrangement—an important step toward redefining trade terms between the two nations. Additionally, the U.S. and Indonesia have reportedly reached a framework agreement for a trade deal, reflecting a broader U.S. effort to strengthen and stabilize trade partnerships in Asia. On Friday, President Trump expressed confidence that more trade agreements will be finalized ahead of the August 1 deadline for new tariffs. One of these possible deals involves the European Union. Investors have welcomed these developments, as they help reduce tariff-related uncertainties and ease concerns about escalating trade disputes that could disrupt global supply chains and impact corporate earnings.
The week ahead brings a bunch of important macro data for the U.S. as well as the FOMC meeting, where Fed members will discuss a potential change in interest rates. Markets are currently not expecting that the Fed will make a move at this meeting. Certainly, with JOLTs, NFP, PCE data in combination with the FOMC meeting, the week ahead might bring back some higher volatility in the US equity markets, in case of any unexpected news.