Gold at a Decision Point-Just as Tariff Headlines Return(July 9)📌
4H Technical Outlook by MJTrading
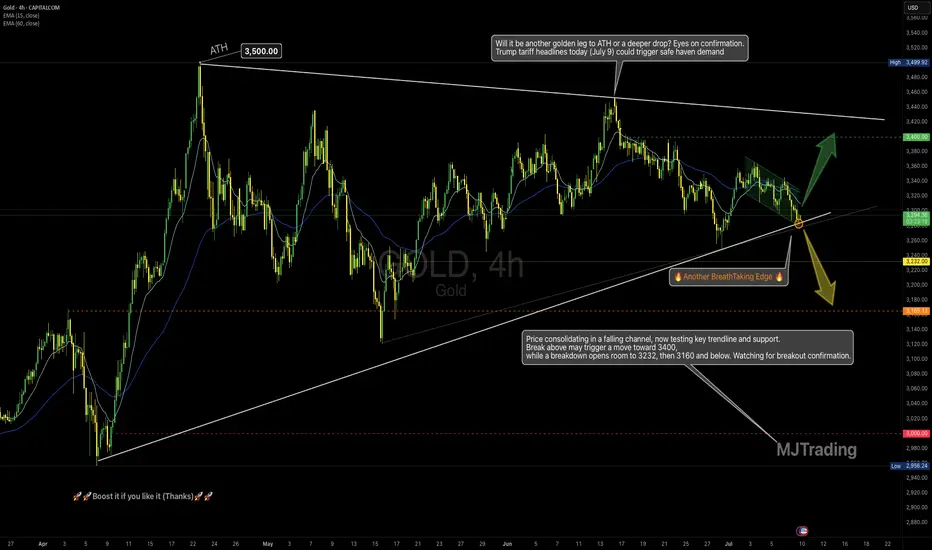
Price is compressing inside a falling channel, nested within a large symmetrical triangle, and now sits right at a high-stakes confluence zone — a perfect intersection of dynamic EMAs, rising trendline support, and local structure.
This could be a pivot point for the next major leg.
🧭 Key Scenarios:
🟢 Bullish Breakout Potential:
If price breaks above the falling channel and holds above $3,310–$3,320:
🎯 Target: $3,400, and eventually upper triangle resistance near $3,480–$3,500
✅ Watch for impulsive breakout + retest confirmation
🟡 Bearish Breakdown Risk:
If the rising trendline gives way and price closes below $3,275 (High Risk) and $3,245(Low Risk):
🎯 Targets: First $3,232, then key level $3,166
⚠️ Further weakness may expose $3,000 psychological support
🔍 Why It Matters:
• Symmetry + compression = potential volatility expansion
• Trump tariff headlines today (July 9) could trigger safe haven demand
• Strong historical respect of these trendlines
• EMAs aligning around decision zone
“Another BreathTaking Edge” — because this is one of those moments where market structure whispers louder than words.
🗣 Boost if you find value, and follow MJTrading for more clean setups.🚀🚀
#XAUUSD #Gold #TradingView #TechnicalAnalysis #ChartPatterns #PriceAction #BreakoutTrade #Forex #MJTrading
Zoom in to get closer to battlefield:
Zoom out to see where we are:
Trump
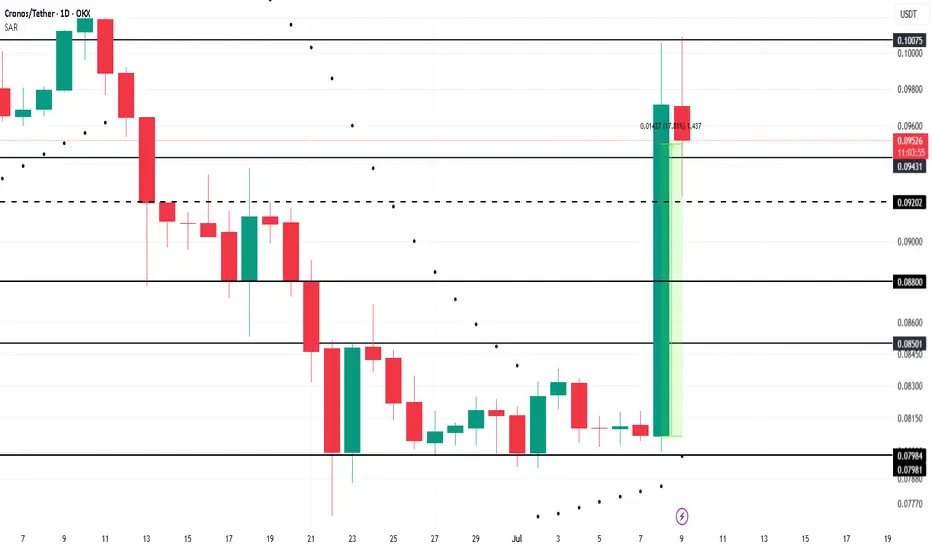
Cronos Rallies 18% After Truth Social Files for Blue-Chip ETFOKX:CROUSDT is a leading candidate for a Binance listing this month, following the proposed Crypto Blue-Chip ETF filed by Truth Social with the SEC. The fund includes 70% Bitcoin, 15% Ethereum, 8% Solana, 5% Cronos, and 2% XRP , positioning Cronos as a key asset in the fund.
Of the tokens in the proposed fund, only Cronos (CRO) is not currently listed on Binance. If the SEC approves the Crypto Blue-Chip ETF, Binance could fast-track the listing of Cronos . This move would likely draw more liquidity and investor interest toward CRO, fueling its price growth.
OKX:CROUSDT price surged by 17.8% over the last 24 hours, signaling strong momentum. If the ETF listing is approved and Binance acts swiftly, CRO could break through key resistance levels, potentially surpassing $0.1007. This upward movement would benefit investors, continuing the positive trend for the altcoin.
Orangeman vs The Federal Reverse: Season 1 (2018–2020)It all started in 2018... 🎬
🧱📈💼 March 21, 2018: Jerome Powell steps in as the new Fed Chair. Almost immediately, the Fed hikes rates from 1.50% to 1.75%, citing a strong U.S. economy.
💬📊🇺🇸 June 13, 2018: Another hike to 2.00%. Powell says the U.S. economy is “in great shape.” But markets? Not so thrilled.
🗣️📉🇺🇸 July 19, 2018: Enter The Orangeman—President Trump publicly attacks the Fed's policy, breaking tradition. He’s “not thrilled” with the hikes.
📉🏦 September 26, 2018: Yet another hike to 2.25%. The Fed stays firm. Trump? Getting louder.
❗😠💬 "I'm not happy with the Fed." – Trump
⚠️📉📉 December 19, 2018: Fourth hike of the year to 2.50%. Markets tank. Rumors swirl: Trump wants Powell gone.
🔥💣👔 Behind the scenes: Trump reportedly explores ways to dismiss Powell. The pressure is on.
📛🇺🇸📉 June 10, 2019: The battle heats up. Trump calls the hikes a “big mistake” and demands rate cuts.
✂️📉📉 July 31, 2019: Powell blinks. The Fed cuts rates by 0.25%—first cut since 2008. Trump tweets:
👎🐦💸 “Powell let us down.”
⬇️📉🔁 September 18, 2019: Second cut.
⚖️🔁🧩 October 30, 2019: Third consecutive cut. The Fed pivots completely. The Orangeman’s influence is undeniable.
🦠🧪📉 March 2020: COVID strikes. The Fed responds with emergency rate cuts.
🌀🧻💸 March 15 & 23, 2020: Rates slashed to near zero. QE infinity unleashed. Powell goes full printer mode. Bitcoin begins to stir...
Season 1 closes with markets melting down, a pandemic, and the Fed surrendering to zero rates.
But The Orangeman isn’t done...
And The Federal Reverse still lurks in the shadows.
Next up: tariffs, China, currency wars, and another campaign trail. 🐉💵⚔️
Season 2 is coming.
Stay tuned...
One tweets.
The other tightens.
Who controls our future?
One Love,
The FXPROFESSOR 💙

Gold Weekly Recap – Week 27 (30 Jun – 04 Jul)🟡 XAUUSD | MJTrading
Overview
Gold (XAUUSD) staged a significant recovery this week after retesting a critical support zone. Price action reflected strong buying interest at lower levels, followed by consolidation near mid-range resistance.
🔹 Key Levels:
Strong Support Zone: 3,246 – 3,250
Weekly Low: 3,246.35 (30 June)
Weekly High: 3,365.77 (3 July)
Closing Price: ~3,343
🔹 Price Action Summary:
✅ Early Week Retest & Reversal
After the prior week’s decline, gold opened the week near the major support area around 3,246. This zone acted as a strong demand pocket, triggering a swift rejection and initiating a bullish reversal.
✅ Sustained Rally to Resistance
Price climbed steadily, riding the 15-period EMA to reach the weekly high of 3,365.77 on 3 July. This move represented a nearly 4% recovery off the lows, fueled by renewed safe-haven flows and short covering.
✅ Midweek Consolidation
Following the rally, gold entered a sideways consolidation phase between 3,340 and 3,365. EMA flattening reflected a pause in momentum as traders assessed the next directional catalyst.
✅ Late-Week Pullback
Toward the end of the week, price tested the 3,310–3,320 area before modestly bouncing into the Friday close. Overall, the market maintained a cautiously bullish tone while holding above the prior support.
🔹 Technical Perspective:
🔸 Bias: Cautiously Bullish
Price defended the strong support and printed a higher low structure.
Sustained closes above 3,300 maintain the bullish outlook.
🔸 Near-Term Resistance:
3,365–3,390 remains the immediate supply zone to monitor for breakout attempts.
🔸 Key Support:
The 3,246–3,250 area continues to be the primary downside line in the sand.
🔹 Special Note – 4th July US Bank Holiday
Trading volumes were notably lighter on Thursday, 4th July, due to the US Independence Day holiday. This contributed to reduced liquidity and muted volatility, with many traders and institutions off desks. The thinner market conditions likely influenced the late-week pullback and consolidation, as participation was limited heading into the weekend.
🔹 Sentiment & Outlook
The decisive rebound from support suggests that buyers are defending value zones aggressively. However, failure to close the week above 3,365 leaves gold vulnerable to another retest of mid-range levels if fresh catalysts don’t emerge.
Traders should watch for:
A clean breakout above 3,365 to confirm continuation higher.
Any sustained weakness below 3,300 as a signal of fading bullish momentum.
🧭 Next Week’s Focus:
Monitoring whether the consolidation evolves into accumulation or distribution.
Watching for a breakout or deeper pullback
Reactions to upcoming economic data
EMA alignment: If the 15 EMA continues to track above the 60 EMA, it supports a bullish bias.
Chart Notes:
The main chart highlights this week’s action, while the inset provides a fortnight overview of the broader decline and recovery for context.
Thank you for your time and your support...
🚀🚀Boost it if you like it (Thanks)🚀🚀
#Gold #XAUUSD #GoldTrading #Forex #Commodities #TechnicalAnalysis #PriceAction #TradingRecap #MJTrading #GoldForecast #MarketReview #WeeklyRecap #TradingView

TSLA bearish: Musk vs Trump! Subsidy Spotlight & Sentiment RisksIf you haven`t bought TSLA before the recent breakout:
Now you need to know that Tesla (TSLA) is sitting around $315, but the vibe is getting shakier. Elon Musk’s feud with Donald Trump — complete with jokes about “putting the DOGE on him” if deported — might feel like another meme moment, but it spotlights Tesla’s huge dependency on federal and state support.
Estimates show Tesla could face up to $48 billion in lost government contracts and incentives over the next decade if the political tide turns. With Trump’s base calling out “green subsidies” as wasteful, Tesla’s funding pipeline could get squeezed — just as competition ramps up and margins get tighter.
Key Bearish Points
1) Political Risk Is Real
Musk’s public fight with Trump is a double-edged sword: he risks losing goodwill on both sides of the aisle. If the next administration decides to gut EV credits, Tesla could take a huge hit — far more than its rivals who rely less on U.S. incentives.
2) Subsidy Dependence
Tesla’s success is partly built on a foundation of tax credits, carbon credits, and favorable policies. $48B in potential lost value is nothing to shrug off — especially when competitors like BYD are gaining ground.
3) Bearish Technical Setup
TSLA’s chart is rolling over inside a bearish channel. It recently failed to hold the $330 level and now sits around $315. A clean breakdown below $300 could open the door to your target zone at $262 — a major support area from earlier this year.
Catalysts:
Any new comments from Trump’s camp about EV subsidies
Weak delivery/margin numbers from Tesla
Broader tech/equity pullback
Musk’s crypto distractions no longer propping up sentiment
Disclosure: I am part of Trade Nation's Influencer program and receive a monthly fee for using their TradingView charts in my analysis.

$TSLA Time to Fade or..?NASDAQ:TSLA (like NASDAQ:GOOG ) is standing out to me as bullish, yet, corrective Elliot Waves a higher degree series of ABCs appear to be underway.
A final wave C appears to be underway which would take price too all time highs in an expanded flat correction pattern. My count could be wrong and the interference could be from the increase it sentiment volatility connected to the US headlines lately and Trump posting on socials. Things may get back to normal after the summer and a clearer pattern may emerge.
Price is struggling to get past the weekly pivot point bullishly or the weekly 200EMS bearishly and is trapped within that range.
For now long term target is the R2 daily pivot at $693 as the higher probability is continued upside
Safe trading

Gold Market Update: Stuck in summer time range / SeasonalityGold is stuck so far last 4-6 weeks in tight range trading conditions
due to summer time seasonality also strong gains previously
expecting range locked conditions in July as well here's an
overview of 5 years and 10 years of seasonality data by month
until at least August expecting dead market conditions it's best
to focus on trading the range or trading with automated algo instead.
Here are the two tables showing month-over-month percent changes in gold prices (London PM fix USD/oz) for June, July, and August:
| Year | June Close | July Close | August Close | June % | July % | August % |
| ---- | ---------: | ---------: | -----------: | -----: | ------: | -------: |
| 2023 | 1,942.90 | 1,951.02 | 1,918.70 | –0.04% | +0.42% | –1.68% |
| 2022 | 1,836.57 | 1,732.74 | 1,764.56 | –5.65% | +1.80% | +1.80% |
| 2021 | 1,834.57 | 1,807.84 | 1,785.28 | –1.47% | –1.48% | –1.22% |
| 2020 | 1,761.04\* | 1,771.65\* | 1,968.16\* | +8.66% | +11.19% | +10.99% |
| 2019 | 1,342.66\* | 1,413.39\* | 1,523.00\* | +5.29% | +7.95% | +7.74% |
| 2018 | 1,270.00\* | 1,230.00\* | 1,194.00\* | –1.09% | –3.15% | –3.02% |
| 2017 | 1,257.00\* | 1,243.00\* | 1,280.00\* | +0.72% | –1.10% | +2.93% |
| 2016 | 1,255.00\* | 1,364.00\* | 1,322.00\* | +3.24% | +8.67% | –3.11% |
| 2015 | 1,180.00\* | 1,172.00\* | 1,116.00\* | –2.06% | –0.68% | –4.69% |
| 2014 | 1,320.00\* | 1,311.00\* | 1,312.00\* | –0.65% | –0.68% | +0.08% |
🔍 Summary Highlights
June has been weak more often than not—negative in 6 of the past 10 years.
July shows modest gains overall—positive in 7 of the last 10.
August is the strongest summer month—positive 6 times out of the past 10, with several double-digit y/y gains (like +10.99% in 2020).

Nightly $SPY / $SPX Scenarios for July 2, 2025🔮 Nightly AMEX:SPY / SP:SPX Scenarios for July 2, 2025 🔮
🌍 Market-Moving News 🌍
🏭 U.S. Manufacturing Remains Under Pressure
The ISM Manufacturing PMI for June rose slightly to 49.0 from 48.5 in May—still in contraction territory. Tariff-induced uncertainty and rising input costs continue to weigh on factory activity, with new orders still weak and employment contracting
📈 Global Factory Rebound Led by India & Europe
While U.S. factories struggle, India hit a 14-month high in its manufacturing PMI at 58.4, and euro‑zone factory orders stabilized at 49.5—the first sign of recovery in over three years. Asia-Europe divergence may shift global capital flows .
🏦 Powell Says Tariffs Are Delaying Rate Cuts
Fed Chair Powell warned at the ECB forum in Sintra that elevated inflation—driven in part by Trump-era tariffs—has postponed the timeline for U.S. rate cuts. The Fed’s dot-plot now indicates only two cuts for 2025, with markets adjusting accordingly
💵 Dollar Nears 3½-Year Lows
The U.S. dollar weakened further, trading near a three-and-a-half-year low amid soft PMI data, a dovish Fed tilt, and renewed optimism over U.S.–Canada trade talks
📊 Key Data Releases & Events 📊
📅 Wednesday, July 2:
(No major scheduled U.S. economic data)
Market focus shifts to upcoming Nonfarm Payrolls on July 3, Powell's remarks, and trade-talk headlines.
⚠️ Disclaimer:
This information is for educational and informational purposes only and should not be construed as financial advice. Always consult a licensed financial advisor before making investment decisions.
📌 #trading #stockmarket #economy #manufacturing #Fed #inflation #charting #technicalanalysis

Gold Bounces from Demand Zone – Next Targets in Sight!By analyzing the gold chart on the 4-hour timeframe, we can see that today, price once again dipped into our key demand zone (Bullish Rejection Block) between $3245 and $3262, where it faced strong buying pressure and rallied up to $3296.
Currently, gold is trading around $3281, and as long as price holds above $3273, we expect further upside. The next potential targets are $3294, $3300, and $3309.
🎥 If you enjoyed this video analysis and found it helpful, please show your support with a LIKE and COMMENT below!
These video-style breakdowns take time and effort, and I’ll only continue them with your support 🙌
Your engagement is my biggest motivation to keep going 💛
Thanks for being part of the journey!

Bitcoin - Will Bitcoin Hit a New ATH?!Bitcoin is trading above the 50- and 200-EMAs on the four-hour time frame and is within its short-term descending channel. Bitcoin can be bought from the demand zone indicated. A break of the channel ceiling would pave the way for Bitcoin to rise to a new ATH.
It should be noted that there is a possibility of heavy fluctuations and shadows due to the movement of whales in the market and compliance with capital management in the cryptocurrency market will be more important. If the downward trend continues, we can buy within the demand range.
In recent days, Bitcoin has been trading in a range of around $107,000, and the market is going through a consolidation phase with complex but deeply fundamental characteristics. What matters at this point is not just the current price, but the precise mix of capital flows, the behavior of major players, on-chain data, and macroeconomic ratios that shape Bitcoin’s short- and medium-term trajectory. Overall, although Bitcoin’s rapid growth after the halving has stopped, internal market signals point to a continuation of the upward trajectory in a more stable framework.
The first important component is the significant influx of institutional capital into the market via ETFs. In the past week, according to CoinShares, more than $1.24 billion in new capital entered crypto products, with Bitcoin accounting for more than $1.1 billion. This marks the 10th consecutive week of capital inflows into the market, bringing the total inflows for 2025 to over $15 billion. Prominent ETFs such as BlackRock’s IBIT and Fidelity’s FBTC are attracting hundreds of Bitcoins per day, indicating steady institutional demand that has weathered the momentary volatility and is more focused on long-term asset building.
Alongside this capital inflow, the Onchain data also paints a mixed but highly interpretable picture. While the average active address rate has declined slightly and the MVRV (market value to realized value) has fallen from 2.29 to 2.20, these changes are more indicative of profit-taking by investors than selling pressure! In fact, rather than fear of a correction or crash, the market is witnessing a “gentle shift of ownership” between short-term and long-term holders. UTXO data also shows a roughly 5% increase in Bitcoin held for over 8 years, a strong sign of long-term accumulation and a decrease in the willingness to sell at current prices!
This can be seen as a period of supply and demand equilibrium; a period in which large investors have entered, but on the other hand, some older players are taking reasonable profits. This has led to a kind of price consolidation, which in June showed itself with only 2% growth—the weakest monthly growth since July last year. However, CoinDesk and Glassnode analysts rightly emphasize that this consolidation is not a sign of market weakness, but rather evidence of the maturity of Bitcoin’s price behavior. The price is reacting to data rather than becoming emotional.
From a macroeconomic perspective, Bitcoin remains highly sensitive to the Federal Reserve’s monetary policy, the value of the dollar, and interest rates. While the market is still waiting for interest rate cuts in the second half of the year, Bitcoin will remain in a quasi-expectant state until then, reacting to macro data, short-term and reactive. However, given that most ETFs follow long-term accumulation models, any stabilization in interest rates or easing geopolitical pressures could trigger a new wave of upside. Common analyst scenarios predict a range of $120,000-$130,000 for Bitcoin by the end of the summer if current conditions are maintained and capital inflows continue. In summary, Bitcoin is now at a stage where the dynamic combination of institutional accumulation, supply and demand balance, and on-chain data has transformed it from a purely risky asset into a strategic investment vehicle. The market has moved beyond the emotional phase and entered a phase of stability and maturity. This is a promising sign for long-term investors, provided that risk management is maintained and sensitivity to macro events is maintained. Bitcoin is preparing for the next stage of its rally—but unlike in the past, this time it is standing on the shoulders of fundamentals that are much stronger than at any time in the asset’s history.
ETFs with the most volume traded on Friday
Total: $501M
BlackRock: $153M
Fidelity: $165M
Grayscale: $0M

USDCAD LONG DAILY FORECAST Q3 D30 W27 Y25USDCAD LONG DAILY FORECAST Q3 D30 W27 Y25
Professional Risk Managers👋
Welcome back to another FRGNT chart update📈
Diving into some Forex setups using predominantly higher time frame order blocks alongside confirmation breaks of structure.
Let’s see what price action is telling us today! 👀
💡Here are some trade confluences📝
✅Daily Order block identified
✅4H Order Block identified
✅1H Order Block identified
🔑 Remember, to participate in trading comes always with a degree of risk, therefore as professional risk managers it remains vital that we stick to our risk management plan as well as our trading strategies.
📈The rest, we leave to the balance of probabilities.
💡Fail to plan. Plan to fail.
🏆It has always been that simple.
❤️Good luck with your trading journey, I shall see you at the very top.
🎯Trade consistent, FRGNT X

TLSA Catalyst Ranking and Market Update: June 2025Here's an updated/revised outlook for TSLA including all the primary
catalyst ranking and analyst ratings and overview of latest developments
🔋 1. EV Demand Growth
Strength: 9/10 → 9/10
Global electric vehicle adoption remains the dominant pillar. Tesla faces softer comp in Europe (–40.5% drop in May) wsj.com, but overall trend remains firmly upward. 🌍
🚗 2. Affordable Entry Level Model
Strength: 8.5/10 → 8.5/10
Tesla still on track to launch a < $25K EV in first half of 2025. Any delays or execution issues could pressure sentiment.
⚡ 3. Battery Cost & Margin Improvement
Strength: 8/10 → 8/10
Margins saw slight relief Q1, driven by cost cuts f, but macro headwinds persist.
🤖 4. Autonomy & Robotaxi Rollout
Strength: 7.5/10 → 8.5/10
Robotaxi debuted in Austin in June, sparking a ~10% one-day stock surge. Benchmark raised its target to $475/buy on the rollout—strong tailwind.
🚩 5. Competition
Strength: 7/10 → 6.5/10
Rivals like Xiaomi’s new YU7 are gaining ground. Tesla must maintain differentiation.
📉 6. Trade Policies & Tariffs
Strength: 6.5/10 → 6.5/10
Still relevant due to Tesla’s global footprint, though less front-page than before.
💰 7. Incentives & Subsidies
Strength: 6/10 → 6/10
U.S. IRA tax credit policies remain supportive; evolving eligibility remains a swing factor.
🛢️ 8. Commodity Costs
Strength: 5.5/10 → 5.5/10
Raw-material swings affect margins. Inventory hedges help but not wholly mitigate.
📈 9. Fed & Interest Rates
Strength: 5/10 → 5/10
A higher-rate environment still limits valuation multiples for growth-tier companies.
🎭 10. Musk Profile & Governance
Strength: 4/10 → 5/10
Analysts (e.g., Bradley Tusk) warn of being “massively overvalued” tied to Musk’s persona. Musk’s renewed focus on Tesla vs. other ventures (DOGE, SpaceX) will be watched.
________________________________________
🚀 Refreshed Catalyst Rankings
Rank Driver Score
1 EV demand growth 9
2 Affordable model 8.5
3 Battery costs/margins 8
4 Autonomy/robotaxi execution 8.5
5 Competition 6.5
6 Trade & tariffs 6.5
7 Regulatory incentives 6
8 Commodities 5.5
9 Fed Rates 5
10 Musk reputation/governance 5
________________________________________
📊 Latest Analyst Ratings & Targets
• Benchmark / Mickey Legg: Buy, target $475 (from $350) — cites robotaxi safety-first rollout, automation upside
• Wedbush / Dan Ives: Outperform, target $500 — labels TSLA as an “embodied AI compounder”
• Morgan Stanley / Adam Jonas: Buy, target $410 — bullish on AI/self driving positioning
• Cantor Fitzgerald / Andres Sheppard: Overweight, target $355 — optimism rooted in robotaxi and FSD rollout
• UBS / multiple: Sell, target $215–225 — skeptical on demand and valuations
Consensus snapshot (FactSet):
• Mean price target ≈ $311–$312
• Mean rating between Hold–Buy (~2.7/5)
________________________________________
🗞️ Recent Headlines
• “Tesla completes first fully autonomous Model Y delivery ahead of schedule”
• “Tesla robotaxis launch in Austin” boosting momentum
• “EU Tesla sales slump” May registrations down 40.5%
• “Tesla fires longtime insider as Europe slump deepens”
________________________________________
🔍 Summary Outlook
Tesla shares are navigating a volatile interplay of strong tech promise and unfolding execution risks:
• Overweight view (Legg, Ives): Robotaxi rollout and AI thrust fuel upside. Automation transition seen as transformative.
• Bullish base (Jonas, Sheppard): AI, FSD rollout, affordable model support core thesis.
• Skeptical view (UBS, Tusk): Slumping deliveries in Europe/China, heavy valuation, Musk's external focus seen as emotional dampener.
Upcoming triggers to watch:
1. Q2 delivery and production results (mid July).
2. Robotaxi rollout execution/regulatory clearance.
3. Margin trajectory as costs evolve.
4. FSD reliability and expansion in new markets.
________________________________________
✅ What This Means for You
• Bull case: Robotaxi + AI momentum may drive TSLA back toward targets in the $475–500 range.
• Bear case: Weak deliveries, macro and competition pressures could cap shares or trigger pullback toward prior support ($330–350).
• Neutral: Watch near-term delivery and autonomy news to shape next move.

OFFICIAL TRUMP 1,244% Target Revealed & Map UpdateI have several questions for you:
1) Did the market break your patience? Are you still holding?
2) How much are you going to take? Will you go for 278% or maybe 1,244%?
TRUMPUSDT has been really uneventful lately and this is good, it means that consolidation is still happening and consolidation is a form of exercise for a trading pair; TRUMPUSDT is building strength.
From a technical analysis perspective, the chart is great, still bullish continues bullish; looks good. Because the action continues to happen as a higher low compared to 7-April. 7-April is the market bottom, as long as this level is not challenged or broken we are now in the bullish zone.
The move that peaked in late April is the initial bullish breakout. The higher low 22-June marks the point where the retrace from the initial bullish breakout ends. 22-June can also signal the start of the next upthrust. From here on we will see growth.
Higher lows lead to higher highs. We have a very clear, strong and ecologically sustainable higher low. This means that a higher high comes next.
Here is the tricky, not so tricky part: TRUMPUSDT will grow to $50, $62, beyond $100 and so on, but, not all growth happens in a single wave. Just as TRUMPUSDT moved from $7 to $16 and then stopped, it can move from $9 to $34 and then make another stop, this one short. Then another rise toward $50 and so on. The market never moves straight down but neither straight up. And this gets us to my point. Will you sell when resistance is hit to later buy back lower, or, will you continue waiting until the market top, higher targets?
That's the question you need to answer to maximize profits when the action goes green. If you decide you want to sell the wave, then make sure to prepare to sell when the market is green. What happens is that if you don't sell when green but wanted to take some profits then you will do so when the market is red. In this case you will not be taking out the maximum possible...
Anyway, we have to leave something for another day. TRUMPUSDT will grow, for certain, but it takes time. Patience is key.
Thank you for reading.
Namaste.

Is it too late for a TACO trade on USD/CAD? USD/CAD jumped nearly 900 pips on Monday after President Donald Trump announced he is “terminating” trade negotiations with Canada. But the surge didn’t stick. Within hours, the pair gave up most of its gains, slipping back below the 1.3700 breakout level.
There’s been no reversal from Trump — not yet. But price action suggests the market might be front-running one. Traders have seen this before: the “TACO” setup — Trump Always Chickens Out.
In that context, traders may be cautious about chasing the spike without confirmation that the trade breakdown will be long-lasting. The USD/CAD trade now hinges on updates from Trump for more TACO setups.
If USD/CAD stays below 1.3700, the focus shifts back to 1.3628 and possibly lower. Below that, the long-term structure suggests a broader range between 1.3500 and 1.3770.

Has Bitcoin Topped? Trump’s SBR Impact | Deep Dive Analysis🚨 Has COINBASE:BTCUSD topped? Even with Trump's Bitcoin Strategic Reserve? 🚨
In this deep dive, we analyze COINBASE:BTCUSD major factors that could point to a major reversal or breakout and to uncover whether a market top is forming.
We’ll cover:
Powerful Indicators
Bitcoin / BTC Trends
Price Action
EMA / SMA Trends
Volume Delta
Trend reversal / breakout
Bullish / Bearish / Confirmation from Indicators
order flow analysis
Timeframes (1W, 1D, 1m, 6M etc.)
Bullish and Bearish Sentiment
Strength Candles
👉 Like, comment below, and follow for more pro-level crypto insights.
MartyBoots here , I have been trading for 17 years and sharing my thoughts on COINBASE:BTCUSD .
Whether you're a short-term trader or long-term investor, this post provides the technical insight and edge to help you make better informed decisions.
📉 Stay ahead of the market. Watch the full breakdown and view charts to decide for yourself: Has Bitcoin really topped?
Watch video for more details and below I will show some powerful charts with descriptions.
Warning in near term - LARGE ORDERS
Consolidation in price with large orders above
The Red lines = LARGE ORDERS
Large orders can act as an magnet to price
Large orders can also be support and resistance
Price Above the white 100 moving average
Price strong above it
Price weak below it
Strength Candles
Still Bullish
Multiple timeframes still green
Sentiment Tool Still Bullish
Still Bullish
Multiple timeframes and settings still green
3 Drive Structure
Equal Measured moves
Implies Top Is Not In
Target = $126k
Bullish Engulfing Candle
Implies higher prices to come
👉 Like, comment below, and follow for more pro-level crypto insights.
#Bitcoin #Trump #BTC #CryptoTrading #TechnicalAnalysis #CryptoMarket #BitcoinTop #TradingView #StrategicBitcoinReserve

US Dollar Index (DXY) – Testing Long-Term Channel SupportBy MJTrading:
Chart Overview:
The US Dollar Index has now approached a major technical confluence zone that could define the next directional move. Price is pressing into the Danger Zone near the lower boundary of a multi-year descending channel, with an Ultimate Oversell Target sitting just below.
🔹 Key Technical Highlights:
Long-Term Down Channel (Daily & Weekly):
The DXY has respected this structure for several years.
Price is currently challenging the lower boundary, a zone where reactions often occur.
Danger Zone (~95–96):
A historically reactive area.
Prior demand and channel floor converge here.
Ultimate Oversell Target (~89–90):
Marked as a deeper potential exhaustion area if the channel fails.
Moving Averages:
15 EMA ~97.8
60 EMA ~99.3
Price remains below both EMAs, confirming persistent bearish momentum.
🔹 Potential Scenarios:
Scenario A (Green Path):
A bounce off current support could trigger a relief rally back toward 98–100, targeting the mid-channel and EMAs.
Scenario B (Red Path):
A breakdown below ~95 could accelerate selling pressure, aiming for the Ultimate Oversell Target (~89).
🔹 How I See It:
This is a high-risk inflection zone. Any bullish setups here remain counter-trend and require confirmation via strong reversal signals. Conversely, a decisive breakdown could have significant implications for USD pairs and commodities.
💡 Notes:
This chart includes the weekly inset view for broader context.
Keep risk management tight in this volatile area.
🔹 Reminder:
This idea is for educational purposes only—not financial advice.
💬 How are you positioning around the USD? Share your thoughts and charts below!
#Hashtags:
#MJTrading #DXY #USDollarIndex #Dollar #Forex #TechnicalAnalysis #TradingView #ChartAnalysis #PriceAction #FX #USD #Majors #DollarWeakness #DollarStrength #SupportAndResistance #TrendAnalysis #MarketOutlook

Cautious — this Chart is Slippery!Hello TradingView Family / Fellow Traders. This is Richard, also known as theSignalyst.
🛢️After surging by over 35% in the past two weeks, USOIL took a hit following Trump's announcement of a ceasefire between Iran and Israel.
However, from a technical perspective, USOIL is approaching a strong daily support zone marked in red.
As long as this support holds, the bulls remain in control.
📊The next bullish impulse will be confirmed upon a break above the last minor high marked in blue.
In such a scenario, a move toward the supply zone (also marked in red) would be expected.
📚 Always follow your trading plan regarding entry, risk management, and trade management.
Good luck!
All Strategies Are Good; If Managed Properly!
~Rich

GOLD H4 Accumulation Fractal Target is 4 000 USD 🏆 Gold Market Mid-Term Update
📉 Gold Pullback: XAU/USD drifted below $3,350, falling to around $3,325–$3,330 amid easing Middle East tensions and a firmer U.S. dollar.
🤝 Ceasefire Effect: De-escalation in Israel-Iran hostilities reduced safe-haven demand, capping gold’s upside.
💵 Fed & USD Dynamics: Fed Chair Powell reaffirmed that policymakers aren’t in a rush to cut rates. A softer dollar provided some support, but intraday USD strength weighed on gold.
📊 Technical Watch: Gold remains in a bearish short-term structure below the 200-period SMA. Resistance lies near $3,368–$3,370; support cluster begins around $3,300, with potential slide to $3,245–$3,200 if broken.
🔮 Forecast Updates:
• Citi Research flagged that gold may have peaked and could undergo further softening in Q3-2025.
• WSJ notes gold posting weekly gains, with futures steadying at $3,339/oz.
• Another WSJ report suggests potential for new highs later this year—forecasting an average of $3,210/oz in 2025, a 35% increase.
⚠️ Market Split: Opinions are fragmented—Wall Street sees mixed short-term direction, while Main Street maintains a bullish stance ahead of key U.S. data (GDP, PCE, jobless claims).
🏠 Central Bank Demand: Sustained demand from central banks reinforces gold’s structural support.
🔮 Live Price Snapshot: Futures are up ~0.2%, trading at $3,339.20/oz today.
📊 Technical Outlook Update
🏆 Bull Market Overview
▪️ A pullback is currently unfolding
▪️ Heavy resistance seen at $3,500
▪️ Possible re-accumulation underway
▪️ Scenario mirrors summer 2024
▪️ Accumulation before breakout
▪️ Downside protected around $3,150
▪️ Short-term range trading in progress
▪️ Bulls maintain strategic upper hand
⭐️ Recommended Strategy
▪️ Buy dips within the range
▪️ Look for entries near $3,150 S/R zone
▪️ Long-term bullish target of $4K remains intact

USDCHF LONG FORECAST Q2 W26 D26 Y25USDCHF LONG FORECAST Q2 W26 D26 Y25
Professional Risk Managers👋
HTF BOS REQUIRED
Welcome back to another FRGNT chart update📈
Diving into some Forex setups using predominantly higher time frame order blocks alongside confirmation breaks of structure.
Let’s see what price action is telling us today!
💡Here are some trade confluences📝
✅Daily order block
✅Weekly order block
✅Intraday breaks of structure Required
✅4H Order block
🔑 Remember, to participate in trading comes always with a degree of risk, therefore as professional risk managers it remains vital that we stick to our risk management plan as well as our trading strategies.
📈The rest, we leave to the balance of probabilities.
💡Fail to plan. Plan to fail.
🏆It has always been that simple.
❤️Good luck with your trading journey, I shall see you at the very top.
🎯Trade consistent, FRGNT X

Gold Holding Strong – Eyes on $3400 and Beyond! (READ)By analyzing the gold chart on the 4-hour timeframe, we can see that after our last analysis, the price corrected down to $3341, then rallied back up to $3399. Currently, gold is trading around $3373, and if it manages to hold above $3355, we can expect further upside movement.
Potential bullish targets are $3400, $3417, $3450, and $3468.

Nasdaq Surges on Ceasefire Hopes – New All-Time Highs Ahead?By analyzing the #Nasdaq chart on the weekly timeframe, we can see that the index experienced a strong rally following the ceasefire announcement between Iran and Israel, climbing as high as 22,200 so far. If the ceasefire holds and tensions continue to ease, we could see a new all-time high for the Nasdaq.
Potential bullish targets for this move are 22,400, 23,200, and 24,000.
Please support me with your likes and comments to motivate me to share more analysis with you and share your opinion about the possible trend of this chart with me !
Best Regards , Arman Shaban

SPX short analysisLike I wrote in my EUR/USD analysis you never know what could happened.
USA bombed Iran!
This could have huge impact on the US market next week.
My guess is temporarily short... At least to close this gap in spot price of SPX.
Since we're still in bearish market, until we see new highs, and this could be catalyst for another sell off. So the jump could be even bigger and we could see new ATH this year.
For now, I'm seeking a position to short tomorrow after market is open.
This is my entry mark.
There will be higher volatility. However, I expect US market to open in the red, close the gap and to sell off again.
We shall see!
Trade safe this one :)

S&P 500 (SPX) 1M next week?The S&P 500 is pulling back from a key resistance after completing a bearish AB=CD pattern on the monthly chart. Price action suggests a potential correction toward the 4662–4700 zone, aligning with the 0.618 Fibonacci retracement level, which may serve as a key area for bullish reaccumulation. Momentum indicators show bearish divergence, hinting at a cooling rally.
Fundamentally, the index remains supported by strong earnings in tech and AI sectors, but risks persist from elevated interest rates, sticky inflation, and potential Fed policy shifts. A pullback into the 4662–4700 zone may offer a medium-term setup for continuation toward 5198 and potentially 5338. A breakdown below 4662 would invalidate the bullish structure and shift focus to lower Fibonacci levels.
