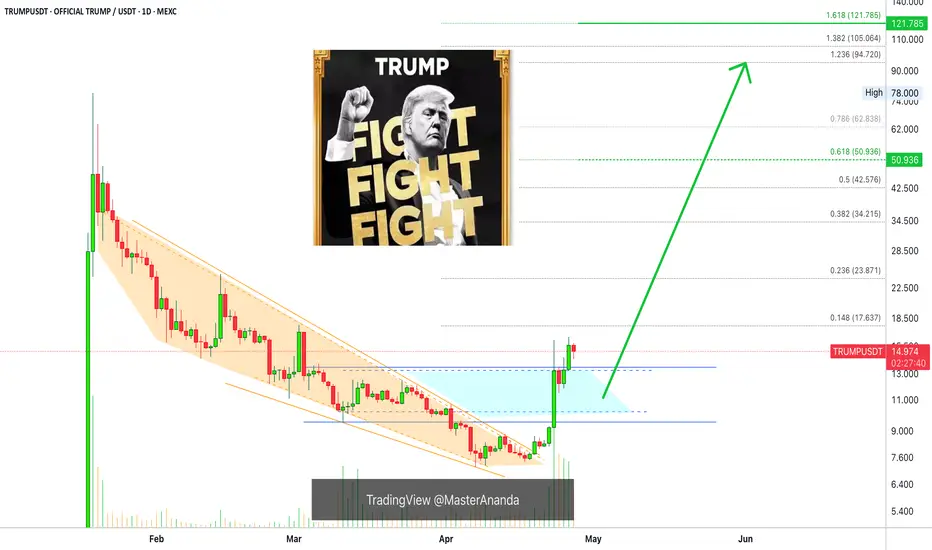
elliott wave $TRUMPelliott wave impulse patterns 12345
From the fluid structure that will continue
You can point out where it is against the rules impulse patterns.
I expect the price is now in wave 2 and will enter 3 4 5 until the end of the cycle with the price above the start of wave b which is over 48$ +.
Trump

TRUMP: Advanced Trading Strategy For 6,666% Instant ProfitsThe higher low is in and support is being confirmed now as I write this; patience is key.
It is a waiting game. This whole trading experience, venture or adventure... It is all a waiting game.
The better you get at waiting the best you can do.
You see, when the market is bland, boring and sideways this can last for a long while. When the market starts crashing or rising everything can happen within a day.
In order to catch the rise, we have to be in and ready to wait.
In order to avoid the crash, we have to set our sell orders on target before the rise takes place. Something like buying in, setting the orders high up (never stop-loss) and then waiting for the market to take care of the rest.
I know it can be boring sometimes and at other times doubt can even creep up. This is not bad nor is there anything wrong with you if this happens, this is normal but you shouldn't worry if you are ready to hold.
The market can go up slowly for 3 months and you wouldn't mind the fact that it is growing if the price moves from $10 to $13 in three months. Then on the fourth month, there is an advance from $13 to $50 and wow!
But if the market drops slowly from $10 to $7 within 3 months we start to become anxious and scared, why? Then, on the fourth month there is an advance from $7 to $50 and wow!
You see? It is all psychological you know. When the market was rising slowly, there was no difference, no secured profits and yet you didn't mind having to wait. But when the market moves lower, you might want to secure a losing trade.
Both the up and the down produce $$$ changes on paper only, nothing changes when it comes to the amount of coins you bought and hold.
If the coins are going to be worth more down the road, six months from now, say, 500% more; this should be an easy hold.
Ignore the short-term, ignore the noise hold strong.
You can do it and you are doing it, for doing this you will be paid and when you get paid you will be happy with the results.
I should give you my strategy once more: Buy and hold.
Thanks a lot for your continued support.
Bitcoin and the Altcoins market is set to grow really, really strong in the coming months.
Just be prepared to wait, it will be worth every day, every minute every second once you get your reward.
Actually, I like to wait. I can study and exercise—prepare—while the market goes through its consolidation phase. I can plan.
Once the new high—All-Time High—is in and the bullish wave is over, I will be prepared to pocket huge profits because I planning and studying today.
Thank you for reading.
Namaste.

Australian dollar hits five-month high after Australian electionThe Australian dollar continues to impress and has posted strong gains on Monday. European session, AUD/USD is trading at 0.6491, up 0.72% on the day and its highest level since early December 2025.
Prime Minister Anthony Albanese cruised to a resounding victory in Saturday's national election. Albanese' centre-left Labor Party increased its majority and thumped the Liberal Party opposition. The coalition's defeat was marked by its leader, Peter Dutton losing his own seat.
The long shadow of US President Donald Trump was a factor in the election. Dutton adopted right-wing policies such as promising tougher immigration laws and establishing a platform to reduce the waste of public funds. The similarities between Dutton and Trump hurt the Liberal leader as many voters were upset with Trump's 10% tariffs on Australia.
At the start of the year, Albanese was trailing badly in the opinion polls. However, he struck a receptive chord among voters on domestic issues such as health care and housing, and benefited from the anti-Trump sentiment, which proved to be a winning recipe.
US nonfarm payrolls, a key gauge of the US labor market, dipped slightly to 177 thousand in April, down from a revised 185 thousand in March. This easily beat the market estimate of 130 thousand. The positive unemployment report points to a resilient labor market which remains strong despite the US economy declining in the first quarter.
The markets have responded by lowering the odds of a rate hike in June to 33%, down sharply from 60% a week ago, according to the CME's FedWatch. The Federal Reserve meets on Wednesday and is virtually certain to maintain the benchmark rate of 4.25%-4.5%.


What Happened To OFFICIAL TRUMP? No More Bullish Action? Read...Did you give up already?
If you did you are not playing the game right. Patience is key.
The initial bullish breakout is in so the next bullish wave is confirmed; but, the initial bullish breakout is corrected and ends in a higher low. This retrace can last a few days just as it can last a few weeks, it is random the market chooses how big is this wait.
If the whales learn that participants are anxious and desperate, the retrace and higher low will take longer so that people will fold and they can buy more at the lows.
If the bots track your trading and see that you are likely to fold if the next rise is delayed by 3-5 more days, then the bots will not start buying until people sell at low prices. The moment you sell the next rise starts to develop almost instantly. Patience is key is what I say.
How long it takes it doesn't matter that's not how it works. The way it works is that you buy with a long-term mindset, "I will wait for as long as it is necessary for my money to grow." Once in, you hold. That's it, nothing more can be done.
Prediction: Just watch! TRUMPUSDT will grow from a higher low. The last low was the bottom and the current retrace, literally five days, is nothing more than bullish consolidation. After some time, a small wait, we will have a higher high. That is how it works. The market never moves straight down but neither straight up. It fluctuates... Doing zig-zags... And that's what you see on the chart.
Be patient, Trump will grow.
Just set it and forget it, comeback when prices are up.
Namaste.

MARKETS NOT OVERSOLD CAUTION! UPDATE!This is a monthly chart and TV keeps forcing "Target reached" on my updates. As such i am reposting this chart I first issued back on April 1st, 2025, before our "LIBERATION DAY" FACEPALM!
We are still not oversold on a monthly chart!
WARNING!
Click Boost, follow, subscribe!

USOIL CAUTION! BREAK - TEST - GO!This is my new updated chart of Oil.
Trump's "Drill baby Drill" interfering with the free market is the absolute worst thing he could do. His ridiculous tariffs will put us in an economic depression!
Oil prices are driven by demand! As I have mentioned here on TV so many times before! Increasing supply while heading into a recession is the dumbest thing possible! You never want to consume your own oil when you can consume others first! Simultaneously, F your own nation's oil company's profit margins and gov tax revenue!
This is why we shouldn't put toddlers as POTUS!
Anyway!!! This is a break test go! setup!
If you haven't seen it before, here is an example I recently posted with AAPL.
Click Boost, follow, subscribe! Let's get to 5,000 followers so I can help them navigate these crazy markets too. ))

REJECTION OF $292Tesla's stock ( NASDAQ:TSLA ) has faced multiple rejections at key resistance levels. To establish a strong upward trend, it may require forming a triple bottom pattern. This would indicate a solid foundation for potential growth. It is anticipated that the stock will retest the $270 and $250 levels before making a decisive move.

Curve (CRV)Crv usdt Daily analysis
Time frame 4hours
Risk rewards ratio >2.5 👈👌
Target = 0.8$
Moving up and down in the uptrend tunnel

Tariffs, and Tumult: Wall Street Waits on Super WednesdayHello everyone, it’s April 30, 2025. The TVC:DJI just closed its sixth consecutive green session, with markets clinging to hope as rumors swirl of a first tariff deal—possibly with India—though nothing is confirmed. That tiny breadcrumb of optimism was enough to boost sentiment late in yesterday’s session, even if volatility is dipping below 25% and investor enthusiasm seems to be fading in lockstep.
U.S. macro data continues to paint a picture of “not great, but not terrible.” Consumer confidence and job openings (JOLTS) came in below expectations but not disastrously so, prompting markets to collectively shrug and declare everything “less worse than feared.” It’s a strategy now: ignore bad data as long as it isn’t apocalyptic.
As earnings roll in, companies are split between those who pretend the tariff storm is “manageable” (hello, NASDAQ:COKE ) and those flying blind through economic fog ( NYSE:UPS , Snap, and Super Micro—who might be losing a major client named Nvidia). The overall takeaway? Visibility is garbage, and most companies are bracing rather than building.
All eyes are now on today’s so-called Super Wednesday, packed with economic data (U.S. GDP, PCE, ADP jobs, Chicago PMI) and mega-earnings from NASDAQ:MSFT and NASDAQ:META . But as usual, expectations may outpace reality. Markets often dream of clarity and wake up to more noise.
Meanwhile, China flashed its first big red light: a manufacturing PMI of 49, signaling contraction—the lowest in two years. No shock, considering their ongoing trade war with the U.S., which seems to be giving the global economy the flu.
On the political front, Trump celebrated his 100 days in office with a campaign-style detour to Detroit, throwing shade at Fed Chair Jerome Powell while declaring the economy in perfect health (despite the worst market performance since Nixon’s early days). He promised tax cuts, again, while doubling down on trade threats. Powell, of course, is just trying to survive the week.
Oil briefly dipped under $60 as markets considered the broader implications of economic warfare, gold sits at $3,311, and Bitcoin hovers around $95,000—looking resilient despite the madness.
As for corporate earnings, Starbucks missed on sales due to weak U.S. demand, Pfizer beat on EPS but saw revenue fall, and Visa continues to rake in profits as Americans keep spending like inflation isn’t real. Novartis crushed it but got no love from the market because apparently, +22% net income just isn’t sexy enough.
In short: chaos remains king. Markets seem oddly calm on the surface, but under the hood, it’s still all about tariffs, Trump tweets, and the fantasy that maybe—just maybe—some clarity will come today. Don’t hold your breath.
Enjoy the ride, and see you tomorrow for more market mayhem.

Believe or Not- Blue SeasonBefore Donald Trump gets credit based on tariff's or anything like that I wanted to share the future of SPX 500 with everyone. It's definitely about to explode to a new all time high. Watch and learn. Market 101- Let's go USA!

April 29, 2025 - Waiting for the Crash or the Miracle?Hello everyone, it’s April 29, 2025. Yesterday’s market session was about as exciting as watching paint dry. After months of Trump-fueled chaos, investors seem almost relieved that… nothing happened. Indices barely moved: TVC:DJI up 0.28%, SP:SPX up a pathetic 0.06%, CME_MINI:NQ1! down 0.10%. In short: we’re falling from a 150-story building, and so far, so good — but we know the real pain comes when we hit the ground.
Markets are clinging to hopes that Trump’s trade war with China might get a Hollywood-style happy ending. He’s calmed down a bit. Stopped slamming Powell, flirted with diplomacy, and softened up on auto tariffs. But with an avalanche of critical economic data coming (Consumer Confidence, GDP, PCE, Jobs) and Magnificent Seven earnings, no one’s taking big bets right now. Everyone’s waiting to see if the economic parachute opens, or if we get pancaked on impact.
Meanwhile, US macro isn’t looking great. Confidence is sinking — 53% of Americans say their finances are worsening, a record since COVID. Consumer spending is stalling, companies like NASDAQ:AAL and NASDAQ:DPZ are canceling forecasts, and the real estate market is coughing. Even hardcore Trump supporters are starting to sweat. The US might still technically be growing, but psychologically, the recession has already started.
OANDA:XAUUSD is holding strong at $3,321, BLACKBULL:WTI is around $61.57, and BINANCE:BTCUSDT is cruising near $94,400. Futures this morning are flailing between -0.6% and +0.2%, dancing to the tune of whatever headline drops next.
On the political front, Trump pulled a classic backpedal on auto tariffs: no double penalties for carmakers, partial refunds on tariffs already paid, and promises of time for US production reshoring. Nice words but rebuilding car factories will take years.
As for NASDAQ:NVDA , it’s under pressure after China banned sales of its H20 chips. Huawei’s Ascend 910D chip is stepping in — good for China, but too slow and too pricey for the rest of the world. Nvidia stays king globally for now, but the tech war is heating up.
Today, eyes are on key numbers: US Consumer Confidence (expected 87.7) and JOLTS job openings (expected 7.49M). Also, a heavy lineup of earnings: NYSE:V , NASDAQ:SBUX , NASDAQ:COKE , NYSE:PFE , NYSE:SNAP , and more.
For now, we’re still in free fall, hoping there’s a giant crash pad waiting at the bottom. Hang tight — it’s going to be another wild one.

Breaking: $TRUMP Set to Go Parabolic Amidst Golden Cross PatternThe price of Trump coin is set to go parabolic with an anticipated 120% surge on the horizon amid forming a golden cross pattern- a pattern formed when the 50-day MA crosses above the 200-day MA resorted to a trend reversal.
Further solidifying the bullish thesis is the fact that $TRUMP coin has broken a bullish pennant earlier on surging 70% for the past 5 days. With the RSI at 46 and the anticipated Trump’s private dinner for TRUMP $TRUMP token holders, this Polit-Fi memecoin on Solana could be the catalyst for the next bull run.
While already down 9% for the past 24 hours, this is a market shake-off to, accumulate liquidity for the big pump up. However, should $TRUMP coin experience selling pressure, the possible retracement level will be the $11.55 support pivot.
OFFICIAL TRUMP Price Data
The OFFICIAL TRUMP price today is $13.69 USD with a 24-hour trading volume of $1,162,628,325 USD. OFFICIAL TRUMP is down 9.58% in the last 24 hours. The current CoinMarketCap ranking is #35, with a market cap of $2,738,579,157 USD. It has a circulating supply of 199,999,397 TRUMP coins and a max. supply of 999,999,993 TRUMP coins.

Is EURUSD getting ready for another 600 pips bull run?🏆 EURUSD Market Update
📊 Technical Outlook
🔸Short-term: mixed/range
🔸Mid-term: BULLS 2000
🔸Status: accumulation in range
🔸previously x2 waves +600 pips
🔸clearly strong uptrend in progress
🔸Price Target Bears: range
🔸Price Target BULLS: 2000
🔸strategy: accumulate in range
🔸TP1 +200 TP2 +400 pips
🔸SL 60 pips / below accum range
📈 EUR/USD Bullish Drivers
🏦 ECB staying cautious on rate cuts while Fed signals easing
📉 Weak U.S. job and manufacturing data pressuring the dollar
🌍 U.S. trade policy uncertainty pushing investors toward euro
📊 Technicals show strong support, RSI confirms bullish momentum
🔮 Outlook
⏳ Short-term: Targeting 1.1500 if U.S. data stays soft
📆 Medium-term: 1.20 possible on policy divergence and EU fiscal boost

SUI UPDATEHello friends✌
As you can see, after a price drop, buyers were able to break the downtrend and form an ascending channel, which, given the entry of buyers, we can buy in batches with capital and risk management to move towards the specified goals.
*Trade safely with us*

April 28, 2025 - Broken Supply Chains, and the DC CircusHello everyone, it’s April 28, 2025. The week ahead promises to be spectacular (or a complete disaster) depending on which way the wind blows out of Washington. So far, the futures are down about 0.6% this morning, as everyone’s trying to cut risk ahead of a week crammed with Big Tech earnings ( NASDAQ:AAPL , NASDAQ:MSFT , NASDAQ:AMZN , NASDAQ:META ), a mountain of macro data (PCE, GDP, ISM, jobs), and of course, the never-ending Trump tariff soap opera.
On the US politics front, Trump stayed uncharacteristically quiet over the weekend, no new bombshells. But whispers about “talks” with China surfaced, without any real confirmation. Meanwhile, several countries are supposedly rushing to negotiate tariff deals with the US. Expect headlines (and chaos) throughout the week.
Supply chains are starting to crack. Container traffic from China to the US has plunged 60%, and if deals aren’t made by mid-May, we could be staring down empty shelves and layoffs in transport and retail sectors. Think “Black Friday” without anything to buy.
Meanwhile, the drama at the Fed continues. Kevin Warsh, still salty about not replacing Powell, attacked the Fed’s “media circus” style, blaming it for post-Covid inflation. Warsh wants the Fed to go old-school: shut up, protect the dollar, and stop playing superhero. No forecasts, no endless press conferences. Just cigars and silence.
On the macro side, this week’s economic data could turn into a horror show: weak jobs numbers, soft GDP, slowing PCE, all raising the probability of recession. If that happens, expect markets to start begging the Fed to cut rates sooner rather than later.
Assets snapshot:
• BLACKBULL:WTI : $63.36
• OANDA:XAUUSD : $3,307
• INDEX:BTCUSD : $94,000
In short: expect maximum volatility, endless surprises from DC, and a market that could spin on a dime. Stay sharp, stay skeptical, and brace for anything.

XAUUSD - Gold trend reversed?!Gold is trading below the EMA200 and EMA50 on the hourly timeframe and is in the specified pattern. The continuation of gold's movement depends on the breakdown of one of the two established trend lines, and after a valid breakdown, we expect to reach the established targets.
In recent weeks, gold prices have experienced significant volatility. This precious metal, long regarded as a safe-haven asset during periods of economic uncertainty, faced a decline in Monday’s trading session. The primary reason behind this drop was signs of easing trade tensions between the United States and China, leading to decreased demand for safe assets. This decline occurred while investors awaited clarity regarding ongoing trade negotiations between the two countries.
Last week, media reports indicated that China exempted some American imports from 125% tariffs, signaling a reduction in bilateral tensions. In response, Donald Trump stated that trade talks were underway; however, this claim was rejected by China. Additionally, the U.S. Treasury Secretary announced that he was unaware of any active negotiations, further fueling market doubts.
According to a recent Federal Reserve survey, participants cited the outflow of foreign capital from U.S. assets and a decline in the dollar’s value as potential new economic shocks. Some respondents believed that increased tariffs might only cause limited market disruptions. The survey indicated that despite market turmoil in April, prices remained elevated relative to fundamental indicators.
Meanwhile, investors were closely awaiting key U.S. economic data set to be released over the coming week. While the previous week was relatively quiet in terms of economic indicators, market focus has shifted toward a series of critical U.S. employment reports. These include the Job Openings and Labor Turnover Survey (JOLTS) on Tuesday, the ADP private-sector employment report on Wednesday, and weekly jobless claims on Thursday—all paving the way for the most crucial event of the week: the April Non-Farm Payrolls (NFP) report, to be released Friday morning.
Beyond these reports, several major events are scheduled in the economic calendar: Canada’s federal election on Monday, the U.S. Consumer Confidence Index on Tuesday, preliminary first-quarter GDP data, pending home sales figures, and the Bank of Japan’s monetary policy decision on Wednesday, followed by the U.S. ISM Manufacturing PMI on Thursday—all of which could impact market sentiment.
On another front, the China Gold Association reported that gold consumption fell by 5.96% in the first quarter of 2025, reaching 290,492 tons. Although gold jewelry demand declined by 26.85%, investment-related gold demand surged by 29.81%, reflecting investors’ pursuit of safe assets amid economic and geopolitical uncertainty.
Domestic gold production in China increased by 1.49%, and assets held in gold ETFs rose sharply by 327.73%, indicating heightened financial caution among Chinese consumers in 2025.
A recent report from Goldman Sachs suggests that the downward trend of the U.S. dollar is far from over and that the currency remains significantly overvalued. Jan Hatzius, the bank’s chief economist, stated that despite the dollar’s recent 5% drop, it still stands roughly two standard deviations above its long-term real average since 1973. Historically, such levels have marked the beginning of multi-year correction cycles for the dollar.
Similar patterns occurred during the mid-1980s and early 2000s when the U.S. dollar experienced declines of around 25% to 30% following such valuations. Based on this, Goldman Sachs expects a similar scenario to unfold in the coming years.
One of the key structural factors fueling this anticipated correction is the portfolio composition of global investors. Specifically, non-U.S. investors hold about $22 trillion worth of assets in the United States, roughly one-third of their total portfolios.Half of these investments are unhedged against currency risk, which could lead to sharp fluctuations in the currency markets if investor sentiment shifts.
Goldman Sachs analysts believe that even a modest reallocation of global capital away from U.S. assets could significantly lower the dollar’s value. Therefore, they view the dollar’s gradual yet sustained decline not as a temporary fluctuation, but as a long-term structural trend.

From Financial Markets to Pope Francis' Funeral
From Easter to April 28, 2025, financial markets have been in a period of great turbulence, influenced by economic, geopolitical and social events. The Forex market, in particular, has reacted to central bank decisions, commodity fluctuations, global trade tensions and the major event of Pope Francis' funeral, which has seen the participation of world leaders and talks that could have a lasting impact on international relations. This article offers an in-depth analysis of the key events of these weeks.
1. Monetary Policies and Forex Markets The decisions of major central banks have dominated the movements of currency markets. The Federal Reserve, in an attempt to balance recession and inflation risks, has decided to keep interest rates unchanged. This approach has caused a temporary weakness in the US dollar, prompting many traders to move towards more stable currencies such as the euro and the pound.
In Europe, the European Central Bank took a more hawkish stance, hinting at a possible tightening of monetary policy to combat inflation. This move boosted the euro, which posted significant gains against major currencies.
The Bank of Japan, on the other hand, continued its ultra-accommodative policy, causing the yen to weaken further. Traders then showed a preference for the dollar and the euro over the Japanese currency.
2. Commodity Prices and Impact on Related Currencies The commodity market saw significant movements. Oil prices fell, influenced by a rise in inventories in the United States and weak global demand. This trend penalized currencies that are highly correlated to commodities, such as the Canadian dollar (CAD) and the Australian dollar (AUD).
On the other hand, gold continued to gradually increase, with investors choosing it as a safe haven in a context of economic and geopolitical uncertainty. Gold’s strength had an indirect impact on currencies tied to the precious metal.
3. Geopolitics and Conversations During Pope Francis’ Funeral The funeral of Pope Francis, held on April 26, 2025 in Rome, was a crucial moment for global diplomacy. The participation of world leaders allowed for significant discussions:
Meeting between Donald Trump and Volodymyr Zelensky: During the ceremony, a possible peaceful solution to the conflict in Ukraine was discussed. The opening to a ceasefire represents a real possibility for stability in the region.
Statement by Vladimir Putin: The Russian president expressed Russia’s willingness to negotiate without preconditions, a signal that could positively influence global tensions.
Focus on dialogue and peace: The funeral itself emphasized the importance of building bridges between nations, a central message of Pope Francis’ pontificate.
These talks, if followed up with concrete actions, could have long-term effects not only on geopolitical relations, but also on investor confidence and, consequently, on financial markets.
4. Economic Data and Influence on Forex Markets Economic data released during this period played a central role in the movements of the Forex market:
United States: The Consumer Price Index (CPI) showed a slowdown, suggesting that inflationary pressure could ease. This fueled speculation that the Federal Reserve could cut interest rates in the coming months.
Eurozone: Inflation exceeded expectations, strengthening the euro and increasing the likelihood that the ECB will adopt further monetary tightening measures.
Fluctuations in economic data caused greater volatility in the Forex market, offering opportunities and risks for traders.
5. Implications for the Future Looking ahead, investors should carefully monitor geopolitical developments stemming from Pope Francis’ funeral talks, central bank decisions, and key economic data. The combination of these factors could continue to generate volatility in currency markets, making FX a dynamic and complex space for the coming months.

OFFICIAL TRUMP Update —Your Guide Through Light & DarkIt gets better and better. Yesterday TRUMPUSDT produced the highest session close since 3-March. Think about it... The bottom is fully in and confirmed and now almost two months of bearish action have been completed obliterated. The action is happening now the same as if it were early February 2025.
Another interesting fact is that almost two months of bearish action has been deleted but the chart is only a little over 3 months old. The bears are no more we are in the bullish zone.
This is important and a strong confirmation.
TRUMPUSDT started trading when the market was bearish and moving within a strong corrective phase. The correction for the last major 2024 bullish wave.
Corrections are tough I agree and the market bleeds but they end and once they end the action turns the other way and that's what you are seeing today.
There is no doubt here, nothing to fear, the rise won't stop it is only getting started. Make no mistakes.
How far up TRUMPUSDT will grow is only speculation but you can expect a new All-Time High for sure. And that's easy for a Cryptocurrency project and one with so much buyers, holders, attention and market support.
This is a simple update mentioning the highest close in months, the bottom is in and bullish continuation confirmed. Keep holding and you win. Keep buying, double-win. Only sell when the market reaches new All-Time High and is full green.
Right now is the time to buy and hold, when prices are low. Only when prices are high we take the profits and move on.
Trading is meant to make money. To make money, you have to let go of your position once the market grows.
Prepare now. Plan ahead of time.
You will do great. You have my support.
Thanks a lot for your continued support.
I will be your guidance through the light and through the dark.
Namaste.
Solana | BULLISH ON SOL | SOL Dominates Blockchain RevenueEven with a dip in activity particularly around memecoins, Solana has managed to hold its ground impressively when it comes to generating revenue.
While you might think fewer transactions would automatically mean less money coming in, Solana's performance shows otherwise. This ability points to the solid value being created by the different applications and uses on the network right now.
A big reason for this financial resilience is the continued strength of dApps on Solana. These apps have been really effective at bringing in fees and adding value to the network. It seems that while the hype around certain speculative tokens has died down significantly, the core utility and economic activity within Solana's dApps are still going strong. This shift towards more fundamental uses for generating revenue is a really positive sign for how the network can keep growing in the long run.
Looking ahead the future for SOL is bright imo as more projects are linking Artificial Intelligence with Solana, taking advantage of its speed and low costs to build new things. Plus, the introduction of Solana ETFs in Canada is a big step.
Other Solana-based alts including Official Trump (TRUMP), Jupiter (JUP), Raydium (RAY), and Bonk (BONK), have followed SOL with good price increases.
It seems like the focus is shifting towards building more lasting and useful applications. With ongoing support for developers and increasing interest from the traditional financial world, Solana seems well-positioned to handle market ups and downs and keep finding new ways to create value in the future. I'll definitely be watching to accumulate for the long-term.
______________________________
BINANCE:SOLUSDT

WLD/USDTHello friends
Given the price growth we had, the price correction has now managed to make good bottoms, which indicates the strength of the trend, so we can enter the trade.
The purchase and target points have also been identified...
Follow capital management.
*Trade safely with us*

TRUMP COIN BUY...Hello friends
Given the price growth we had, the price correction has now managed to make good bottoms, which indicates the strength of the trend, so we can enter the trade.
The purchase and target points have also been identified...
Follow capital management.
*Trade safely with us*

RENDER/USDT:BUY Hello friends
Given the price growth we had, a range has now been created in the price correction, which indicates the strength of the trend, so we can enter the trade.
The purchase and target points have also been identified...
Follow capital management.
*Trade safely with us*
