MAGS SUPER STRUCTURE FORMING CAUTION!We have MEGA superstructures forming everywhere. H&S Eiffel Towers, etc.. None will be more devastating to 401ks and people's portfolios than the MAGS breaking down from this mammoth structure.
Last chance to GTFO forming.
CAUTION is in order!
Click Boost, Follow, Subscribe. Let's get to 5,000 followers ))
Trump

Important section: 12.560-18.301
Hello, traders.
If you "Follow", you can always get new information quickly.
Please click "Boost" as well.
Have a nice day today.
-------------------------------------
(TRUMPUSDT.P 1D chart)
The HA-Low indicator on the 1D chart is showing an upward trend after being created.
The HA-Low indicator is currently formed at 7.933.
-
The 12.560-18.301 section corresponds to the Close value of Heikin-Ashi on the 1M chart.
Accordingly, in order to continue the upward trend, it is expected that the price will have to rise above 12.560-18.301 to maintain the price.
-
If it falls below 11.796-12.560, it is likely to meet the HA-Low indicator on the 1D chart again, so a response strategy is needed.
-
If it rises above 18.301 and maintains the price, it is expected to determine the trend again by touching around 27.329.
-
Thank you for reading to the end.
I hope you have a successful trade.
--------------------------------------------------
- This is an explanation of the big picture.
I used TradingView's INDEX chart to check the entire range of BTC.
I rewrote it to update the previous chart while touching the Fibonacci ratio range of 1.902 (101875.70) ~ 2 (106275.10).
(Previous BTCUSD 12M chart)
Looking at the big picture, it seems to have been following a pattern since 2015.
In other words, it is a pattern that maintains a 3-year bull market and faces a 1-year bear market.
Accordingly, the bull market is expected to continue until 2025.
-
(Current BTCUSD 12M chart)
Based on the currently written Fibonacci ratio, it is displayed up to 3.618 (178910.15).
It is expected that it will not fall again below the Fibonacci ratio of 0.618 (44234.54).
(BTCUSDT 12M chart)
I think it is around 42283.58 when looking at the BTCUSDT chart.
-
I will explain it again with the BTCUSD chart.
The Fibonacci ratio ranges marked in the light green boxes, 1.902 (101875.70) ~ 2 (106275.10) and 3 (151166.97) ~ 3.14 (157451.83), are expected to be important support and resistance ranges.
In other words, it seems likely to act as a volume profile range.
Therefore, in order to break through this section upward, I think the point to watch is whether it can rise with support near the Fibonacci ratios of 1.618 (89126.41) and 2.618 (134018.28).
Therefore, the maximum rising section in 2025 is expected to be the 3 (151166.97) ~ 3.14 (157451.83) section.
To do that, we need to look at whether it can rise with support near 2.618 (134018.28).
If it falls after the bull market in 2025, we don't know how far it will fall, but considering the previous decline, we expect it to fall by about -60% to -70%.
So, if the decline starts near the Fibonacci ratio 3.14 (157451.83), it seems likely that it will fall to around Fibonacci 0.618 (44234.54).
I will explain more details when the downtrend starts.
------------------------------------------------------

Trump Short & Long-Term With Targets ($263, $192 & $121 —1,627%)This is the long-term chart for TRUMPUSDT (OFFICIAL TRUMP), all bullish signals are strong and 100% confirmed. Higher prices next with a high lever of certainty. An uptrend will develop now, higher highs and higher lows.
The weekly session is full green, current session.
The trading volume on this session is the highest ever. Check.
There is a falling wedge pattern fully broken.
The downtrend has been broken.
There is a rounded bottom pattern (stop-loss hunt event) that work as a reversal signal.
The action is happening back above support, recently a resistance zone. These are the blue lines on the chart.
All these are bullish signals.
Next comes the targets:
1) The first and easy target sits at $24.
2) This one is followed by $34 and $42.5.
3) The main target in the coming weeks is $51.
4) Mid-term, within 3 months, we have $63, $94 and $122.
5) The remaining set of targets will be hit long-term, 6 months or more. These are in the range of a strong new All-Time High, it can be seen on the chart.
Thank you for reading.
Boost for more frequent updates and comment.
Namaste.

WELCOME TO THE BEGINNING OF ALT COIN SEASON!Traders, Hodlr's and Soon to be Liquidity (late retail buyers),
This is likely the moment we have been waiting for. Last week in our weekly VIP market update we discussed just a few things that would really show us if we just saw the bottom of the alts and if it was now time to start seeing some new local HH's and then HL's showing us a shift in trend. I had posted a few trades pointing this out. We have now at this point accomplished what we were looking for to see if we would be starting Alt coins season.
We have been watching a few things. The first being Bitcoin Dominance or CRYPTOCAP:BTC.D as this is a great chart to watch and look for reversals prior to looking at the chart of the specific alt coin against BTC to see if it also is showing it could have a rally or a pullback based on your bias on this BTC.D chart. For instance if I were to want to see maybe when XRP would likely start breaking out say that this BTC.D chart is in fact correct and the triangle trend line will end up being the top for btc dominance at around 64.4% of the total market I would go to BITSTAMP:XRPBTC to give myself some insight on confluence of market movements.
Being that we are now here at the point that I believe we will start to see money flow into alts based on this chart and others such as CRYPTOCAP:TOTAL2 , CRYPTOCAP:TOTAL3 and CRYPTOCAP:TOTALDEFI and the specific BTC pairings that I am holding by looking up the ticker of my alt coin/BTC and studying that chart I will honestly say that I am in the 90%/10% bullish on alts to bearish.
I hope this information helped you in your journey to get more information and come up with your own analysis to base your investment decisions and you become prosperous for doing soo!
Stay Profitable Folks,
Savvy!

TRUMPUSDT LongTRUMP buy signal on M15 Timeframe. Triangle pattern was succesfully broken on bullish side. Now bullish target is 8.66 level, Risk reward 1/5. On higher TimeFrame bullish target is 9.4 level.

OFFICIAL TRUMP 100X Chart Setup Now PossibleLook at this, the bottom is in.
I draw a black line on the chart that matches the wick low from the 3-April candle. Today, the action is back above this low.
All the action below this line is the bottom pattern. It takes time for a bottom to form and this bottom is now confirmed. Once the bottom is in, nothing else can happen other that sustained long-term growth. If the action wasn't sustained long-term, then this wouldn't be the bottom, just another low in place.
This is it, feel free to go All-In with 100X...
I am just kidding of course, leveraged trading is for experts and experts will never gamble their money away.
We trade with 2-3X maximum when we are doing our daily work and we go to higher leverage when the market is trading at its lowest prices possible and this happens only once every 6-8 months.
So, no 100X.
On top of the bottom pattern there is also a falling wedge. The falling wedge has been broken and this means a broken downtrend. What happened with the token unlock?
People were saying that prices were to drop because there was going to be a token unlock, but the market cycle does not care about these things. When prices are low we buy and hold, we sell when prices are high and green.
The targets on the chart are just easy targets, it can go much higher... Much, much higher than what is shown on this chart.
As prices grow, I will publish updates. If you are interested, make sure to boost and follow to show your support.
More comments and boosts, more updates.
Just let me know and I'll get it done.
Namaste.

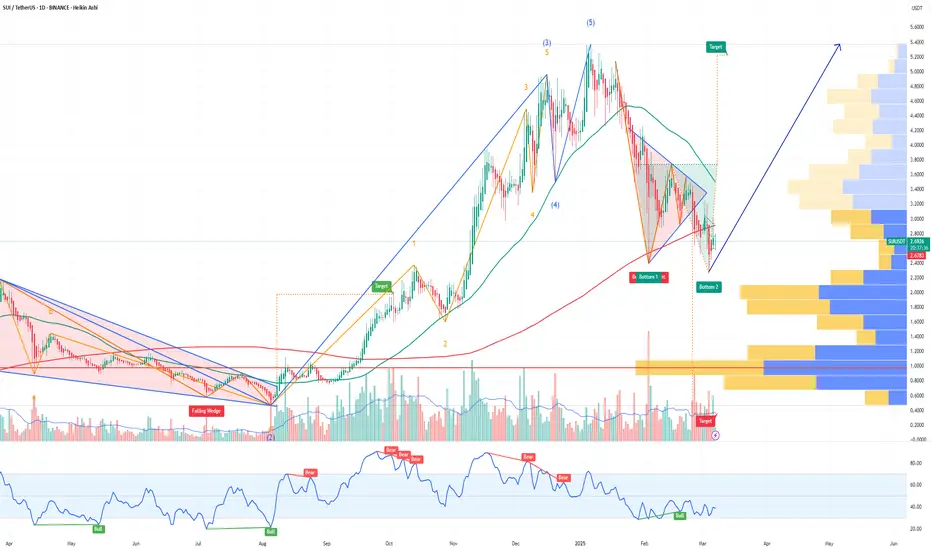
Trump's World Liberty Financial to add SUI to strategic reserve!CRYPTOCAP:SUI , a leading Layer-1 blockchain, has entered into a significant partnership with World Liberty Financial (WLFI), a decentralized finance (DeFi) platform affiliated with Donald Trump.
This collaboration involves integrating Sui's native token (SUI) into WLFI's "Macro Strategy" reserve, a strategic token fund designed to diversify holdings and support emerging blockchain projects.
The partnership also aims to explore product development opportunities leveraging Sui's technology.
WLFI's Macro Strategy reserve already includes prominent digital assets such as Bitcoin, Ethereum, and tokenized real-world assets like U.S. Treasury-backed tokens.
The addition of SUI reflects WLFI's focus on supporting innovative blockchain projects while expanding decentralized finance access to a broader audience.
The announcement of this partnership coincides with broader developments in the U.S. crypto landscape.
President Trump is expected to unveil details about a proposed "Crypto Strategic Reserve" during the White House Crypto Summit on March 7, 2025.
This reserve is anticipated to focus primarily on Bitcoin while also considering other digital assets
Trump-backed World Liberty Financial plans to add SUI to its strategic reserve.
I think the upside for SUI is Huge from here!
Trump token bullishKey Levels: The main resistance is at 10.40 dollars , and the main support is at 7.71 dollars . The descending trendline keeps the price below it, and the 200-period moving average above the price confirms the bearish trend .
Closer Zones: A nearby resistance is observed at 8.06 dollars, overlapping with the trendline. The closer support is at 7.71 dollars. A break above 8.06 dollars could push the price toward 9.60 dollars .
Intermediate Level: On the way up, the 8.25 dollars level acts as an intermediate resistance.
Target: Based on the previous move of 2.50 dollars, the potential upside target is around 9.60 dollars .
Conclusion: A breakout above the nearby resistance could signal a weakening bearish trend and the start of an upward move .

April 25, 2025 - Trump’s Tango, Tech, and Insider DramaHello everyone, it’s April 25, 2025. We’re closing in on Trump’s 100-day mark back in the White House, and if there’s one word to sum up his impact on markets: chaos. With 137 executive orders signed already, he’s turned global markets into a high-stakes rollercoaster though this week saw signs of recovery, confidence remains fragile, and volatility is still running the show.
The main trigger? You guessed it: Trump and his tariff diplomacy. After weeks of U-turns, threats, and NYSE:TWTR meltdowns, he’s finally announced that talks with China have begun. That was enough to send the AMEX:SPY up 2%, pull the CME_MINI:NQ1! out of correction territory (+2.74%), and ignite a 5.63% jump in the Philadelphia Semiconductor Index, even though it’s still miles below its all-time high.
OANDA:XAUUSD is sitting at $3,332, BLACKBULL:WTI hovers around $63.21, and INDEX:BTCUSD has skyrocketed to $93,200. Not bad for a week that started in total disarray.
Now here’s where things get fishy: US indices started climbing before Trump’s announcement—classic “somebody knew something.” Insider trading? Just your average Thursday. And while Trump claims talks are underway, the Chinese side played coy, denying any ongoing negotiations. Either someone’s lying, or the talks are happening over dim sum in DC.
Beyond geopolitics, NASDAQ:GOOG crushed earnings expectations and added a juicy dividend and GETTEX:70B in buybacks, exploding 6% after-hours. Meanwhile, NASDAQ:INTC flopped—flat profits, poor outlook, and a CEO trying to turn cost-cutting into a growth story. The market wasn’t buying it: down 5.7% after-hours.
NYSE:NOW , though, is living its best life. Strong results, AI momentum, and federal contracts boosted shares 15%. Other names like NASDAQ:PEP , NYSE:PG , and NASDAQ:AAL warned on the future thanks to—you guessed it—political and economic uncertainty.
On the macro front, ECONOMICS:USIJC (US jobless claims) ticked higher, inflation seems to be cooling, and if next week’s PCE and employment data confirm the slowdown, the Fed might just blink and cut rates in May. Market hopes are pinned on Powell holding steady—unless, of course, Trump decides to live-tweet through it.
Futures are up 0.37% ( CME_MINI:ES1! ) this morning, signaling optimism—possibly misplaced—in Trump’s “friendly” overtures toward China. Let’s just say we’re one golf game away from another market tantrum.
Enjoy your weekend, stay alert, and cross your fingers for a quiet Sunday tweet-wise.

Gold is still Strong; Long-Term!Hello TradingView Family / Fellow Traders. This is Richard, also known as theSignalyst.
📈GOLD has been overall bullish from a macro perspective trading within the rising wedge pattern in orange.
After rejecting the $3,500 round number and upper bound of the wedge, XAUUSD signaled the start of the correction phase.
Moreover, the $3,100 - $3,150 zone is a strong support.
🏹 Thus, the highlighted blue circle is a strong area to look for buy setups as it is the intersection of support and lower orange trendline acting non-horizontal support.
📚 As per my trading style:
As #XAUUSD approaches the blue circle zone, I will be looking for bullish reversal setups (like a double bottom pattern, trendline break , and so on...)
📚 Always follow your trading plan regarding entry, risk management, and trade management.
Good luck!
All Strategies Are Good; If Managed Properly!
~Rich
Disclosure: I am part of Trade Nation's Influencer program and receive a monthly fee for using their TradingView charts in my analysis.

DexeDexe usdt Daily analysis
Risk rewards ratio >5 👈👌
Time frame daily
First target =16$
2th target = 19.5 $
Stop is very tight. Below of support line.
If price break the support line and my stop , I don't lose because it's very tight. On the other hand, if price reach to my target , I get good benefit

Xrp (Ripple)Ripple
Xrp usdt Daily analysis
Time frame daily
Risk rewards ratio >3.2 👈👌
Target 3.2$
Ripple technical analysis ✅️
My last short position reached the target.
Head and shoulders pattern completed.
Now it is a good time to start
My critical area is red box that you see on the chart. It is very important area .
If Ripple can reach and break this resistance, we will have a good pump
But now 3 _3.2$ is a good target

TRUMP price analysis✊ At the end of March, we last wrote about #Trump and “looked like water” predicting a price drop to $7-7.20 if the “great and brilliant leader” did not stop doing stupid things.... but then came the April sanctions...
We can comment and discuss it for a long time, but it's no use - you can't get the rust out of the metal or out of your head...
It was interesting on 19.04 - when a large unlock of 40 million #Trump coins took place and participants expected the price dump to continue.... but no...
and already on 23.04 - the news comes out that #Trump will have dinner with the largest holders of his token and, oh, miracle = 75% of the OKX:TRUMPUSDT price pump
There are already jokes on Twitter that the TOP-5 holders will be able to choose to who will be the next to set or remove abnormal taxes during dinner)
But seriously, there is every chance that the #TRUMUSDC price pump will continue and God grant us patience to keep and hold this small amount of #Trump coins to $24-$32 or maybe to $40...
_____________________
Did you like our analysis? Leave a comment, like, and follow to get more

April 24, 2025 - Not getting fired (yet)Hello everyone, it’s April 24, 2025, welcome back to another wild episode of “Trumponomics: The Market Edition.” For the second day in a row, global markets are on the rise, and yes, it’s all thanks to the Trump playbook: slap tariffs everywhere, terrify the market, escalate tensions, then toss out a gesture of peace and voilà — rally mode engaged.
The key word this morning? Relief. Relief that Trump might chill out on China, and Powell isn’t getting fired (yet). But let’s not pop the champagne too soon — anyone betting against a weekend plot twist from Trump hasn’t been paying attention.
In the US, the Fed’s Beige Book (a.k.a. the economy’s mood diary) painted a picture that’s… let’s say “limp but not lifeless.” Only 5 of the 12 Fed districts saw growth, and even that was more “walker with tennis balls” than Olympic sprint. Inflation? Creeping in slowly, with companies sharpening their price-hike pencils just in case Trump cranks up the tariff heat again. Employment? Not awful, but nothing to brag about. And uncertainty? It was mentioned 80 times in the report. That’s not a joke.
Meanwhile, auto sales are up — not because the economy’s booming, but because Americans are panic-buying ahead of expected price surges from more tariffs. Business travel is tanking, and tourism’s taking a nosedive. Welcome to the “Not-quite-a-crisis-but-definitely-not-fine” States of America.
As for OANDA:XAUUSD , after a brief flirtation with $3,500, it’s cooled down to $3,337. BLACKBULL:WTI is holding at $62.86. And INDEX:BTCUSD ? It’s back in the spotlight at $92,000 and climbing — yes, people are talking about it again, which should tell you something about the vibe out there.
On the politics front, Trump hinted that the tariff moratorium could be revoked for some countries, and he’s back to pestering Powell to cut rates. Classic. Meanwhile, Wall Street is just trying not to get whiplash. NYSE:BA numbers came in better than feared, and NASDAQ:NVDA supply chain via INX looks solid despite wild swings.
Today’s economic calendar includes durable goods data and jobless claims in the CME_MINI:ES1! are down 0.2% — looks like investors are just bracing for the next Trump curveball.
TL;DR: Markets are riding the Trump-coaster, gold cooled off, crypto’s surging, and America’s economy is wobbling but still upright — for now. Keep your helmets on.

Resistance Watch📈 $TRUMP Analysis: Resistance Watch 🔴
$TRUMP has formed a key red resistance zone.
A breakout above this zone could signal potential trend continuation. 🚀
Keep an eye on volume for confirmation!
Remember that this coin is highly volatile.

Phemex Analysis #76: Pro Tips for Trading the TRUMP Rally!The TRUMP token ( PHEMEX:TRUMPUSDT.P ) has recently experienced a surge in value, with a 60% increase, fueled by news of President Donald Trump inviting the top 220 token holders to a dinner on May 22nd. Additionally, the top 25 holders are reportedly invited to a private event and tour at the White House. These exclusive events have generated significant excitement and speculation within the market, driving increased trading volume and price appreciation. This analysis will explore the potential scenarios for TRUMP token's price action in the short to medium term.
Possible Scenarios
1. Hype-Driven Rally Continuation
The current rally is largely driven by hype and speculation surrounding the upcoming events. If this momentum continues, TRUMP token could see further short-term price increases.
Pro Tips:
Monitor social media sentiment and trading volume for signs of continued hype.
Identify key resistance levels that the price may test, such as $17, $24 & $30.
Consider taking profits on short-term long positions as the event date (May 2nd) approaches.
Implement a trailing stop-loss to protect profits while staying in the trend.
2. Post-Event Sell-Off
It is common for the price of an asset to decline after a major event, as the initial excitement fades. This is a potential risk for TRUMP token following the May 22nd dinner.
Pro Tips:
Be prepared for a potential "sell-the-news" event.
Tighten stop-loss orders or consider exiting long positions before the event.
Consider shorting opportunities if the price breaks below key support levels following the event, but manage risk.
3. Consolidation and Long-Term Value Assessment
After the initial volatility, TRUMP token's price may consolidate as the market attempts to determine its intrinsic value. This consolidation phase could be influenced by factors beyond the immediate hype.
Pro Tips:
Identify the consolidation range and trade accordingly, buying low and selling high within the range.
Assess the token's long-term viability and adoption potential.
Be cautious about long-term positions until the consolidation phase resolves.
Conclusion
The upcoming events involving President Trump have introduced a significant element of hype into the TRUMP token market, leading to a rapid price increase. Traders should be aware of the potential for both continued short-term gains and a post-event sell-off. It is crucial to monitor market sentiment, volume, and price action closely. By employing appropriate risk management strategies and considering the token's long-term fundamentals, traders can navigate the volatility and make informed decisions.
Pro Tips:
Elevate Your Trading Game with Phemex. Experience unparalleled flexibility with features like multiple watchlists, basket orders, and real-time adjustments to strategy orders. Our USDT-based scaled orders give you precise control over your risk, while iceberg orders provide stealthy execution.
Disclaimer: This is NOT financial or investment advice. Please conduct your own research (DYOR). Phemex is not responsible, directly or indirectly, for any damage or loss incurred or claimed to be caused by or in association with the use of or reliance on any content, goods, or services mentioned in this article.

British PMIs fall, Trump says won't fire PowellThe British pound dropped as much as 0.7% earlier today and is under pressure. In the North American session, GBP/USD is trading at 1.3265, down 0.45% on the day.
The pound has taken advantage of broad US dollar weakness recently, rising 3% in the month of April. On Tuesday, the pound climbed as high as 1.3423, its highest level since September 2024.
UK PMIs reports softened in April, another reminder that that the UK economy is struggling. The Services PMI fell to 48.9 from 52.5 in March, below the market estimate of 51.3. There are growing fears that the UK will fall into recession and global economic uncertainty has led to decreased business activity.
The Manufacturing PMI eased to 44.0, matching the market estimate but lower than the March reading of 44.9. This was the lowest reading since August 2023 as the deteriorating global market outook has reduced demand for UK exports. The increase in employer tax contributions has hurt employment and lowered confidence.
The International Monetary Fund has lowered its 2025 global growth forecast to 2.8, down from 3.3% in January. The downgrade was in response to US tariffs and the IMF warned that an escalation of trade tensions between the US and other countries would create further market volatility and lead to even lower growth.
US stock markets are sharply higher on Wednesday after President Trump said that he had no intention to fire Federal Reserve Chair Jerome Powell. Trump had intensified his attacks on Powell in recent days, resulting in sharp slides in US equity markets and the US dollar.
Trump also said that China tariffs would drop "substantially" and investors hope this signals a de-escalation in the nasty trade war between the US and China.

TRUMP - Dead cat bounce?TRUMP looks like a typical dead cat bounce, acquiring major short squeeze getting bonked and probably a dead cat bounce. Plan at 18.21

Trump vs. Powell: 4d Gold Price Roller Coaster📊 Summary of Recent 4 Trading Days
During the ongoing US-China trade war, President Trump has ramped up his public criticism of Federal Reserve Chair Jerome Powell. Though he lacks the authority to remove Powell directly it seems, Trump's frustration with the Fed’s independent policy direction has led to an apparent institutional power struggle.
This conflict hasn’t gone unnoticed by the markets. Just the mention of removing Powell caused the gold price to spike, as stock market money got squeezed out, amplified by tensions in the trade war. The Federal Reserve’s credibility is high, so such remarks naturally trigger significant volatility.
After Trump's initial outburst, gold surged $216. But when he softened his tone, the price reversed just as dramatically—falling about $240 (with the trading day still ongoing at the time). Hopes for progress in trade negotiations also played a role in this sharp reversal.
⚠️ Warning Signs of Market Distortion
Statements from the US President now function almost like market-moving events in addition to normal news. For gold traders, this creates an unstable environment where typical technical setups may fail.
The past days showed signs of manipulated or artificial movements—with potential insider activity. One notable example: Gold looked set to break higher after a 1-hour candle closed above the EMA 20 line. But a sudden $12 bearish candle in the last 30 seconds erased the setup. It felt orchestrated—possibly by institutional players defending key levels.
💡 Trader’s Takeaway
Don’t blindly trust technical signals in this environment.
Watch for political noise—it’s louder than usual.
Prefer quieter markets if you’re risk-averse.
Expect $100+ daily ranges and frequent price whipsaws.
🗣 What’s your take?
Is Trump really influencing the gold market on purpose—or just creating chaos? Let’s discuss below. 👇
-------------------------------------------------------------------------
This is just my personal market idea and not financial advice! 📢 Trading gold and other financial instruments carries risks – only invest what you can afford to lose. Always do your own analysis, use solid risk management, and trade responsibly.
Good luck and safe trading! 🚀📊

BnbBnb usdt Daily analysis
Time frame daily
Risk rewards ratio >2.3
Target 843$
Bnb move up and down between two Grey line that you can see on the chart
3 times it dropped but couldn't break the support line and now it is a good time to reach the target ( upper side of grey tunnel )

Nightly $SPY / $SPX Scenarios for April 23, 2025🔮 🔮
🌍 Market-Moving News 🌍
🇺🇸 U.S.–China Trade Tensions Ease: President Trump announced plans to "substantially" reduce tariffs on Chinese imports, signaling a potential de-escalation in the trade war. Treasury Secretary Scott Bessent labeled the current tariffs as "unsustainable," and the IMF warned of a "major negative shock" to global growth due to the ongoing trade conflict.
📉 Tesla's Profit Decline: Tesla reported a 71% drop in Q1 profits, attributing the decline to backlash over CEO Elon Musk's involvement in government affairs. Musk announced plans to reduce his role in the "Department of Government Efficiency" (Doge) starting in May.
🛫 Boeing's Earnings Under Scrutiny: Boeing is set to report earnings, with investors closely watching for impacts of trade tensions on Chinese plane deliveries. The company's performance is seen as a bellwether for the aerospace sector amid global economic uncertainties.
📊 Key Data Releases 📊
📅 Wednesday, April 23:
🏠 New Home Sales (10:00 AM ET):
Forecast: 675,000
Previous: 662,000
Measures the annualized number of newly constructed homes sold, indicating housing market strength.
📈 S&P Global Manufacturing & Services PMI (9:45 AM ET):
Manufacturing Forecast: 49.5
Services Forecast: 51.0
Provides insight into the economic health of the manufacturing and services sectors.
🛢️ EIA Crude Oil Inventory Report (10:30 AM ET):
Reports on the weekly change in the number of barrels of commercial crude oil held by U.S. firms, influencing oil prices and energy sector performance.
⚠️ Disclaimer: This information is for educational and informational purposes only and should not be construed as financial advice. Always consult a licensed financial advisor before making investment decisions.
📌 #trading #stockmarket #economy #news #trendtao #charting #technicalanalysis

What if Kid Rock ran the Fed?Gold has broken above $3,400 for the first time, setting a new all-time high as investor confidence in the United States continues to decline.
Citi forecasts gold could reach $3,500 within the next three months. However, this projection might be underestimating Trump’s potential to further undermine confidence in the US.
On Monday, President Trump intensified pressure on Federal Reserve Chair Jerome Powell, calling him a “major loser” and demanding immediate interest rate cuts. Last week the President said, "Powell's termination cannot come fast enough,".
A move to dismiss Powell would likely trigger significant market volatility. Markets generally view Powell as a stabilizing figure, and history shows that a less independent central bank is less effective at keeping inflation under control.
I think it might be fair to wonder what a Federal Reserve Chairman Kid Rock would do for the price of gold.

Yen surges to five-month high as US dollar under pressureThe Japanese yen came flying out of the gates on Monday. In the European session, USD/JPY is trading at 141.00, down 0.79%. Earlier the yen strengthened to 140.47, its strongest level since Sep. 2024.
The US dollar has posted losses against the major currencies on Monday, including against the yen. Investors gave the US dollar a thumbs down after President Trump's top economic advisor said that Trump was considering the dismissal of Fed Chair Jerome Powell.
Trump has been increasingly critical of Powell for not lowering interest rates and said last week that "Powell's termination cannot come fast enough". Trump fired his latest salvo after Powell said that US tariffs would raise inflation and that the Fed could find itself having to balance keeping a lid on inflation and supporting economic growth. Powell added that tariffs are "likely to move us further away from our goals".
Powell has insisted that he isn't going anywhere and will serve until the end of his term in May 2026. Can Trump legally fire Powell? That is a complicated legal question, but the markets aren't waiting for an answer and the US dollar has retreated.
Trump's attacks on Powell threaten the independence of the US central bank and is eroding confidence in the US dollar. The dollar is also under pressure from Trump's tariff policy, which has dampened the confidence of foreign investors.
USD/JPY has pushed below support at 141.16. Below, there is support at 140.14.
There is resistance at 142.62 and 143.64
