TRUMP Looks Bullish (1D)It seems that the bullish phase of the Trump coin has started from the point where we placed the green arrow on the chart.
We appear to be at the end of wave B of the bullish phase. As long as the price holds above the green zone, it can potentially move toward the targets marked on the chart.
A daily candle closing below the invalidation level would invalidate this analysis.
For risk management, please don't forget stop loss and capital management
Comment if you have any questions
Thank You
Trumpbtc

TRUMP IS PUMPING!!!Hello friends🙌
📈Given that the price has reached its bottom and buyers support it, you can buy at 3 specified points with capital and risk management and move with it to the specified targets.
🔥Follow us for more signals🔥
*Trade safely with us*

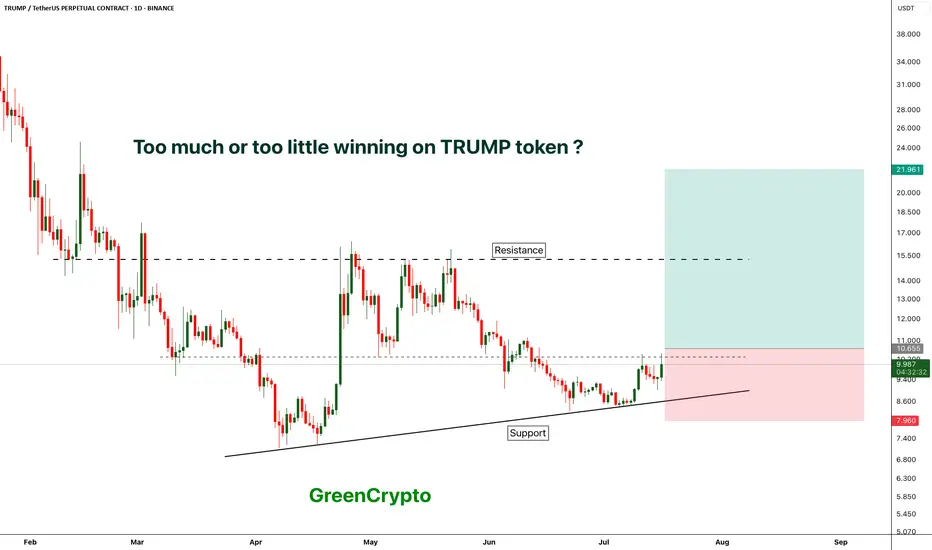
TRUMP - TOO MUCH WINNING ?Trump token is finally seeing some greens after hitting the bottom
currently price is trading near the local resistance.
We have long trade opportunity if the candle closes above local resistance.
Entry Price: Above 10.655
Stop Loss: 7.9
TP1:12.592
TP2: 15.218
TP3: 21.843
TP4++: Keep 20% of the position running with trailing stoploss.
Max Leverage: 5x
Don't forget to keep stoploss
Cheers
GreenCrypto
#TRUMP/USDT#TRUMP
The price is moving within a descending channel on the 1-hour frame and is expected to break and continue upward.
We have a trend to stabilize above the 100 moving average once again.
We have a downtrend on the RSI indicator that supports the upward move with a breakout.
We have a support area at the lower boundary of the channel at 9.53, acting as strong support from which the price can rebound.
Entry price: 9.70
First target: 10.07
Second target: 10.40
Third target: 10.70

#TRUMP/UDT#TRUMP
The price is moving within a descending channel on the 1-hour frame, adhering well to it, and is heading towards a strong breakout and retest.
We are experiencing a rebound from the lower boundary of the descending channel, which is support at 11.10.
We are experiencing a downtrend on the RSI indicator that is about to break and retest, supporting the upward trend.
We are heading towards stability above the 100 Moving Average.
Entry price: 11.22
First target: 11.37
Second target: 11.55
Third target: 11.77

TRUMP buy/long setup (4H)It seems that a diametric has completed on the chart. However, Wave G is suspected not to have fully ended yet, and only a part of Wave G might be complete.
A trigger line has been broken, and a support zone has formed, where short-term trades or scalping opportunities can be considered.
As you know, this is a meme coin and carries risk, so make sure to manage leverage and capital properly.
Targets are marked on the chart—secure profits at each target.
The closure of a 4-hour candle below the invalidation level will invalidate this analysis.
For risk management, please don't forget stop loss and capital management
Comment if you have any questions
Thank You

Trump New Update (2H)It seems that the TRUMP symbol is forming a Diametric pattern and is currently aiming to complete wave F.
As long as the green zone holds, the price can move toward the red box.
A 4-hour candle close below the invalidation level would invalidate this analysis.
For risk management, please don't forget stop loss and capital management
Comment if you have any questions
Thank You

TRUMP is bullish (1H TF)The trigger line has been broken, and a bullish iCH has formed on the chart. A support zone has also developed, while the order blocks above have been consumed.
Targets are marked on the chart. A daily candle closing below the invalidation level will invalidate this analysis.
Do not enter the position without capital management and stop setting
Comment if you have any questions
thank you

#TRUMP/USDT#TRUMP
The price is moving in a descending channel on the 1-hour frame and is adhering to it well and is heading to break it strongly upwards and retest it
We have a bounce from the lower limit of the descending channel, this support is at a price of 15.35
We have a downtrend on the RSI indicator that is about to break and retest, which supports the rise
We have a trend to stabilize above the Moving Average 100
Entry price 17.14
First target 19.62
Second target 22.00
Third target 24.32

#TRUMP/USDT Ready to go higher#TRUMP
The price is moving in a descending channel on the 1-hour frame and sticking to it well
We have a bounce from the lower limit of the descending channel, this support is at a price of 26
We have a downtrend on the RSI indicator that is about to be broken, which supports the rise
We have a trend to stabilize above the moving average 100
Entry price 30.72
First target 36.00
Second target 41.70
Third target 48.47

TUMP UPDATE (1H)This analysis is an update of the analysis you see in the "Related publications" section
The price has been rejected downward from the red box zone in the previous analysis. The trend remains unchanged and is bearish down to the lower zones. Only the time correction for waves D and E has extended.
From the point marked on the chart, it seems the TRUMP correction has started.
Wave D of this corrective pattern has also completed, and the price has entered wave E.
The green zone is where this meme coin might react.
For risk management, please don't forget stop loss and capital management
Comment if you have any questions
Thank You

Let's take a look at TRUMP (1H)Since there is limited data available for the TRUMP token, we need to check it on lower timeframes.
From the point where we placed the red arrow on the chart, it appears that a correction in TRUMP has started.
This correction seems to be a diametric pattern.
If you're looking for a rebuy, look for opportunities in the green zone.
Closing a 4-hour candle below the invalidation level will invalidate this analysis.
For risk management, please don't forget stop loss and capital management
Comment if you have any questions
Thank You

