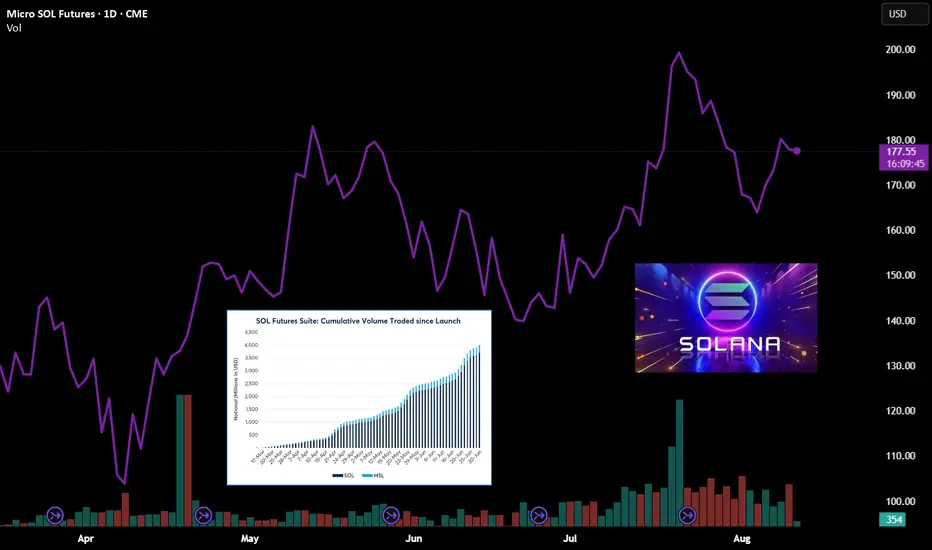
Solana: On the Verge of a BreakoutCME: Solana ( CME:SOL1! ) and Micro Solana Futures ( CME:MSL1! ), #microfutures
On August 7th, President Donald Trump issued an executive order concerning the 401(k) retirement plans. The key points:
• The order aims to broaden the investment options available to participants in defined contribution plans by directing the Department of Labor (DOL) to explore regulatory changes.
• The order focuses on making "alternative assets" more accessible as investment options, including private equity, private credit, real estate, and digital assets.
• The order directs the DOL to review existing guidance and clarify fiduciary duties regarding alternative assets, with a focus on mitigating litigation risk that might discourage fiduciaries from offering these investment options.
Cryptocurrency market surged upon this big news. This order could open a significant new pool of capital in the form of 401(k) savings to cryptocurrencies. Market size of 401(k) is currently estimated at $8.7 trillion. Potentially, this could expand to cover the $12.2 trillion held in all employer-based defined contribution (DC) retirement plans.
According to CoinMarketCap, as of August 11th, the Top 5 Cryptos by market cap (excluding stablecoins) are:
1. Bitcoin (BTC), $2.4 trillion. At $120K, the king of Cryptos gained 27% year-to-date
2. Ethereum (ETH), $517 billion. At $4300, ETH also gained 27% in 2025
3. XRP, $190 billion ($3.20 each)
4. BNB, $111 billion ($800 each)
5. Solana (SOL), $96 billion. At $180, SOL is down 7.8% year-to-date
Why did SOL fall while BTC and ETH rebounded and reached new highs?
Solana is a blockchain platform that has rapidly gained popularity due to its focus on high speed, scalability, and low transaction costs. It is designed to support a wide range of decentralized applications (dApps), decentralized finance (DeFi) protocols, NFTs, and Web3 applications. Since its launch in March 2020, Solana has quickly become a leading challenger to rival Ethereum.
Solana's price declined in 2025 due to a combination of factors including broader market corrections, a decrease in activity on the network, particularly related to meme coins, and the impact of token unlocks from the FTX bankruptcy. Additionally, the Solana blockchain has experienced several outages, which have negatively impacted investor confidence.
In my opinion, the tail wind propelling BTC and ETH will also push SOL higher. The 401(k) new capital infusion could have an outsized impact on SOL due to its smaller market cap. Bargain hunters may scoop up SOL because of its relatively low prices. Earlier, ETH rebounded from $1,500 to $4,300 after BTC initiated a bull run. A similar catchup rise could happen to SOL.
Trading with SOL and MSL
CME Group launched Solana futures (SOL) and Micro Solana futures (MSL) on March 17th. Since launch, SOL and MSL have seen a total of 153.1K contracts traded, representing $4.6B in notional value and 31.2K equivalent SOL.
A trader sharing a bullish view on Solana could explore CME SOL or MSL futures.
SOL futures have a notional value of 500 Solana coins. With the current market price at $180, each SOL contract is valued at $90,000. To buy or sell one contract, a trader is required to post an initial margin of $38,210.
MSL futures have a notional value of 25 coins. Each MSL contract is valued at $4,500 at the current price level. A trader is required to post an initial margin of $1,911.
To maintain a long position in Solana over the long run, while enjoying capital efficiency through leverage, a trader may employ a futures rollover strategy.
Rollover is when a trader moves his position from the front month contract to another contract further in the future, prior to the expiration of his existing holding.
These steps illustrate how to hold a long Micro Solana Futures position overtime:
• In August, a trader buys (going long) a September contract (MSLU5).
• About two weeks before the contract expires on the last Friday in September, the trader will enter an offsetting trade, going short on MBTU5 to close his existing position. He would book a profit or loss, determined by the difference in selling and purchasing prices.
• Simultaneously, the trader would buy a December contract (MSLZ5) and reestablish a long position in Solana.
• In mid-December, the trader will close out MSLZ5 (going short), and buy a March 2026 contract (MSLH6), and continue to hold a long position on Solana.
• The trader would repeat the above steps, so far as he holds a bullish view.
Warnings: Solana prices are extremely volatile. Holding spot Solana coins with no leverage could face potential drawdown of 70%-80%. With leverage embedded in futures, a price move in the wrong direction could quickly deplete the available fund and trigger margin calls.
One advantage Micro Solana futures contracts have over the spot asset is the daily price limit. If MSL moves up or down 10% within the trading day, futures trading will be halted. This will give the market time to cool off and help investors avoid being blown out by short-term panic.
Happy Trading.
Disclaimers
*Trade ideas cited above are for illustration only, as an integral part of a case study to demonstrate the fundamental concepts in risk management under the market scenarios being discussed. They shall not be construed as investment recommendations or advice. Nor are they used to promote any specific products, or services.
CME Real-time Market Data help identify trading set-ups and express my market views. If you have futures in your trading portfolio, you can check out on CME Group data plans available that suit your trading needs www.tradingview.com
Trumprally
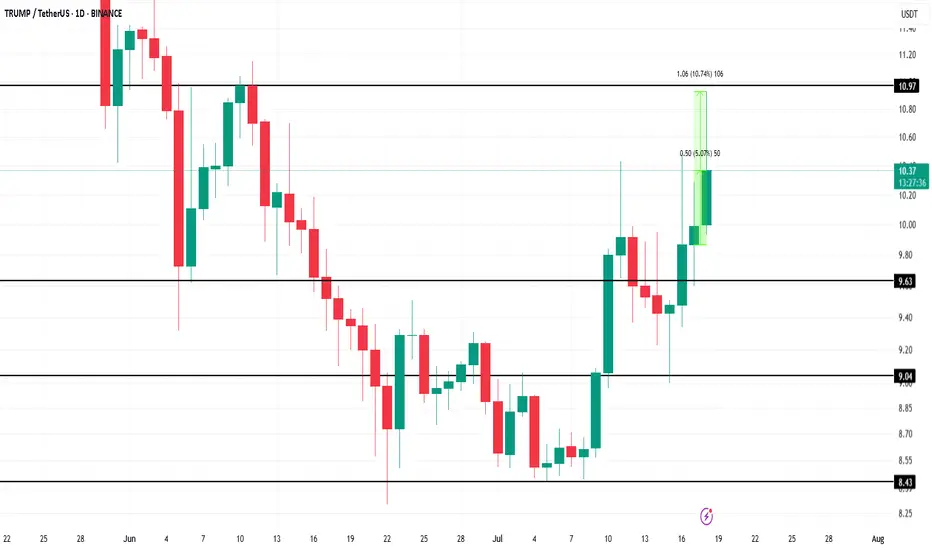
TRUMP Token's $950 Million Unlock Sparks Short-Lived Price RallyBINANCE:TRUMPUSDT recently saw its first major token unlock in six months, which flooded the market with fresh supply. The 90 million TRUMP tokens unlocked today are much smaller than the previous unlock in January, yet they still increased liquidity significantly.
However, the lack of response to the unlock, despite the substantial capital entering the market, further indicates a cooling of investor enthusiasm around the meme coin
BINANCE:TRUMPUSDT price rose by 5% today, trading at $10.39 at the time of writing. It briefly surged by 10% during the intraday high , but the rally was short-lived, and the price retraced.
If BINANCE:TRUMPUSDT fails to breach the $10.97 resistance level again, the coin could face potential corrections to $9.63 , making recovery difficult. The token will need strong demand to push past this resistance and secure more gains.
However, should BINANCE:TRUMPUSDT capitalize on broader market bullish momentum, it could break past $10.97 and reach $11.00 . This would likely invalidate the current bearish outlook and provide an opportunity for a further rise to $12.18.
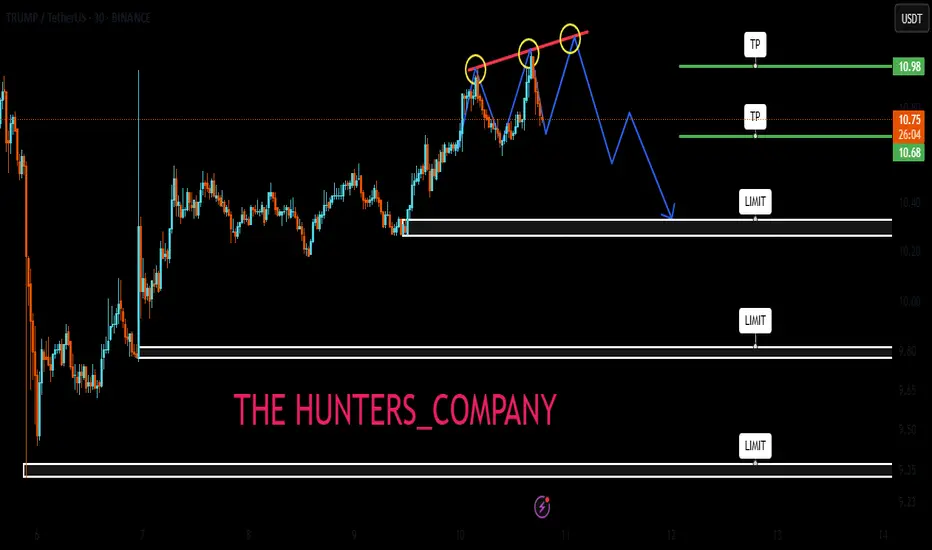
Trump's signalHello friends🙌
🔊Given the good growth we had, you can see that the price has hit resistance and you can see that the upward waves are getting weaker, which indicates that we are likely to have a correction until the support areas are identified...
You can buy in the identified support areas in steps and with capital management and move with it to the specified targets.
🔥Join us for more signals🔥
*Trade safely with us*
TRUMP BUY ???Hello friends🙌
🔊As you can see in the picture, we have brought you two Trump charts:
1_TRUMP/USDT, in which we see an upward trend.
2_TRUMP/BTC, in which we see a downward trend.
✔Now what is the conclusion? When this negative divergence occurs, it means that money flows from Bit to Tether, and we can expect good growth from it to the specified targets, given the price reaching important support and its return📈
🔥Join us for more signals🔥
Trade safely with us.

Trump:New update(don't miss it)hello friends👋
This time we came with the analysis of Trump's famous coin meme, which you requested a lot.
Well, as you can see, by making a double floor, the price has broken its downward channel and has grown well.
After the price growth, we saw the price suffering and then the price correction, which caused the formation of an upward pattern.
Now, according to the successful formation of this ascending pattern, it should be seen whether the buyers support the price in the specified support areas or not...
Pay attention that our trend is upward and the pattern made also shows an upward trend, that's why we have identified the support areas for you to enter the transaction step by step with risk and capital management.
🔥Follow us for more signals🔥
*Trade safely with us*

Live Trump TradeHello friends
Based on the analysis and research we have concluded that it is possible to enter into a transaction with risk and capital management, given the entry of buyers and the price pullback.
*Trade safely with us*

#TRUMP/USDT#TRUMP
The price is moving within a descending channel on the 1-hour frame and is expected to break and continue upward.
We have a trend to stabilize above the 100 moving average once again.
We have a downtrend on the RSI indicator that supports the upward move with a breakout.
We have a support area at the lower boundary of the channel at 9.53, acting as strong support from which the price can rebound.
Entry price: 9.70
First target: 10.07
Second target: 10.40
Third target: 10.70

#TRUMP/UDT#TRUMP
The price is moving within a descending channel on the 1-hour frame, adhering well to it, and is heading towards a strong breakout and retest.
We are experiencing a rebound from the lower boundary of the descending channel, which is support at 11.10.
We are experiencing a downtrend on the RSI indicator that is about to break and retest, supporting the upward trend.
We are heading towards stability above the 100 Moving Average.
Entry price: 11.22
First target: 11.37
Second target: 11.55
Third target: 11.77

TRUMPPPPPPPPPPPPPPPPPPPHello friends
Considering the good growth we had, you can see that the price formed a flag and corrected after reaching its ceiling.
Now, with the price correction, there is a good opportunity to buy in stages and with capital management and move towards the specified goals.
*Trade safely with us*

$TRUMPUSDT Breakout Alert!$TRUMP has officially broken above its descending trendline after holding firm support around $11.8. The price also reclaims the 100 EMA (orange line), signaling strength and potential for a trend reversal.
📈 Technical Highlights:
Downtrend breakout confirmed ✅
Retest of resistance turned support around $13.3 ✅
Targets in sight:
• TP1: $16.52
• TP2: $21.04
• TP3: $26.35
This breakout setup remains valid as long as TRUMPUSDT holds above $13.3. A clean trendline flip often leads to explosive follow-throughs.

TRUMP COIN BUY...Hello friends
Given the price growth we had, the price correction has now managed to make good bottoms, which indicates the strength of the trend, so we can enter the trade.
The purchase and target points have also been identified...
Follow capital management.
*Trade safely with us*

Trump token bullishKey Levels: The main resistance is at 10.40 dollars , and the main support is at 7.71 dollars . The descending trendline keeps the price below it, and the 200-period moving average above the price confirms the bearish trend .
Closer Zones: A nearby resistance is observed at 8.06 dollars, overlapping with the trendline. The closer support is at 7.71 dollars. A break above 8.06 dollars could push the price toward 9.60 dollars .
Intermediate Level: On the way up, the 8.25 dollars level acts as an intermediate resistance.
Target: Based on the previous move of 2.50 dollars, the potential upside target is around 9.60 dollars .
Conclusion: A breakout above the nearby resistance could signal a weakening bearish trend and the start of an upward move .

Phemex Analysis #76: Pro Tips for Trading the TRUMP Rally!The TRUMP token ( PHEMEX:TRUMPUSDT.P ) has recently experienced a surge in value, with a 60% increase, fueled by news of President Donald Trump inviting the top 220 token holders to a dinner on May 22nd. Additionally, the top 25 holders are reportedly invited to a private event and tour at the White House. These exclusive events have generated significant excitement and speculation within the market, driving increased trading volume and price appreciation. This analysis will explore the potential scenarios for TRUMP token's price action in the short to medium term.
Possible Scenarios
1. Hype-Driven Rally Continuation
The current rally is largely driven by hype and speculation surrounding the upcoming events. If this momentum continues, TRUMP token could see further short-term price increases.
Pro Tips:
Monitor social media sentiment and trading volume for signs of continued hype.
Identify key resistance levels that the price may test, such as $17, $24 & $30.
Consider taking profits on short-term long positions as the event date (May 2nd) approaches.
Implement a trailing stop-loss to protect profits while staying in the trend.
2. Post-Event Sell-Off
It is common for the price of an asset to decline after a major event, as the initial excitement fades. This is a potential risk for TRUMP token following the May 22nd dinner.
Pro Tips:
Be prepared for a potential "sell-the-news" event.
Tighten stop-loss orders or consider exiting long positions before the event.
Consider shorting opportunities if the price breaks below key support levels following the event, but manage risk.
3. Consolidation and Long-Term Value Assessment
After the initial volatility, TRUMP token's price may consolidate as the market attempts to determine its intrinsic value. This consolidation phase could be influenced by factors beyond the immediate hype.
Pro Tips:
Identify the consolidation range and trade accordingly, buying low and selling high within the range.
Assess the token's long-term viability and adoption potential.
Be cautious about long-term positions until the consolidation phase resolves.
Conclusion
The upcoming events involving President Trump have introduced a significant element of hype into the TRUMP token market, leading to a rapid price increase. Traders should be aware of the potential for both continued short-term gains and a post-event sell-off. It is crucial to monitor market sentiment, volume, and price action closely. By employing appropriate risk management strategies and considering the token's long-term fundamentals, traders can navigate the volatility and make informed decisions.
Pro Tips:
Elevate Your Trading Game with Phemex. Experience unparalleled flexibility with features like multiple watchlists, basket orders, and real-time adjustments to strategy orders. Our USDT-based scaled orders give you precise control over your risk, while iceberg orders provide stealthy execution.
Disclaimer: This is NOT financial or investment advice. Please conduct your own research (DYOR). Phemex is not responsible, directly or indirectly, for any damage or loss incurred or claimed to be caused by or in association with the use of or reliance on any content, goods, or services mentioned in this article.

USDJPY LONG FORECAST Q2 W16 D14 Y25USDJPY LONG FORECAST Q2 W16 D14 Y25
We caught a the long play for a similar setup. We need more this time around.
Why? To be sure of the weekly order block rejection. Compared to EURUSD and EURGBP for example... That is the type of weekly order block rejection we prefer. With that said we will not give up on USDJPY. We simply must await more levels of confluences.
15' break of structure, Order block creation as a result of the BOS. Pull back into area, lower time frame break of structure.
Let's see what USDJPY provides us with.
FRGNT X

TRUMPHello friends
Due to the price drop, we reached a good support area where good buyers supported the price.
Now we can buy in steps and with capital management in the specified support areas and move to the specified targets.
Always buy in fear and sell in greed.
*Trade safely with us*

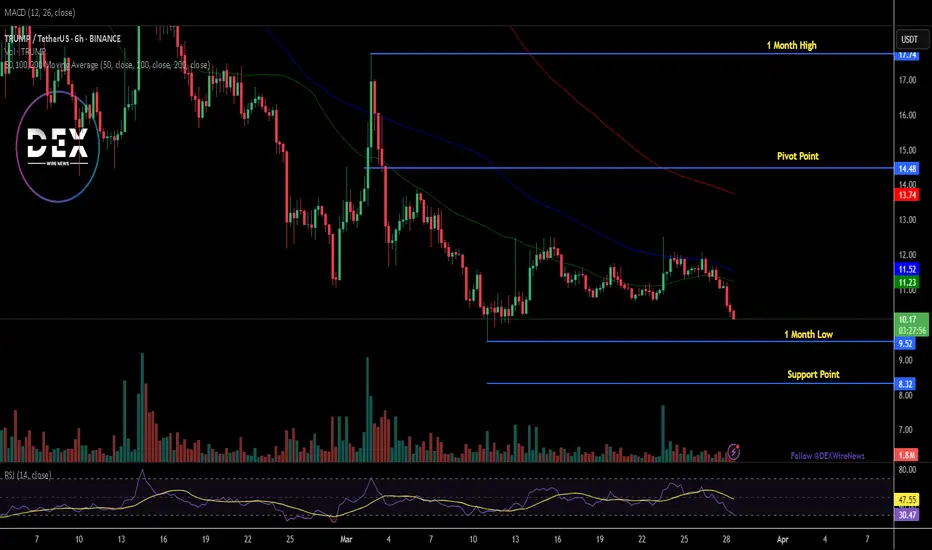
Breaking: $TRUMP Token Dips 10% Reverting to $10 ZoneThe price of OFFICIAL TRUMP coin ($TRUMP) tanked 10% today, falling back to the $10 region. The asset ever since peaking to an all time high of $76, faced insane selling pressure losing about 80% of total value together with its compatriot $MELANIA coin.
For Weeks now, $TRUMP has been circumventing in the $10- $12 zone albeit the crypto market was most of the time in a bloodbath season. For $TRUMP coin, should the bulls push the token above the 38.2% Fibonacci retracement point, that may be the catalyst the token needs to spark a bullish renaissance as hinted by the Relative Strength Index (RSI) at 30- pointing at the disparity $TRUMP has to capitalise and make a bullish move.
Similarly, the 1-month low is serving as support point for $TRUMP should extreme selling pressure push the token lower.
OFFICIAL TRUMP Price Live Data
The live OFFICIAL TRUMP price today is $10.21 USD with a 24-hour trading volume of $517,239,338 USD. OFFICIAL TRUMP is down 8.71% in the last 24 hours. The current CoinMarketCap ranking is #45, with a live market cap of $2,041,294,317 USD. It has a circulating supply of 199,999,430 TRUMP coins and a max. supply of 999,999,993 TRUMP coins.
TRUMP/USDT:BUY LIMITHello friends
Given the price growth, now that the price is correcting, you can buy in steps and be careful to ensure that capital management is followed.
*Trade safely with us*

Gold takes Adv. since Trump-a-rally pans out to Bulls fartIt's gone 2 weeks or so, since Mr. Trump has secured a win over his Democrat-rival Kamala Harris in the 2024 U.S. presidential election, as it declared by the Associated Press.
Since that, a lot of stocks soared in a meme-style mode, while Bitcoin clears $93,000 and Dogecoin soared amid Trump-fueled crypto rally.
Among nearly 2000 components of Smallcap Russell 2000 Index TVC:RUT , appr. 90 percent of them (without any fundamental reasons) were up on November 6 - at the day Trump clinched White House victory.
For S&P 500 SP:SPX and Nasdaq-100 NASDAQ:NDX indices these numbers were 70 and 75 percent respectively.
Since US dollar interest rates are still near multi year highs and Powell still says the Fed is in no hurry to cut interest rates.. all of that means Trump-a-rally gives no light for super-duper bets, as it's been discussed in earlier posted ideas.
Moreover, Geopolitics is roaring back, as current U.S. President Joe Biden tries to authorize the yellow-blues to use powerful long-range American-made weapons inside Russia's legal areas, potentially inside Kursk region where located The Kursk Nuclear Power Plant, that is one of the three biggest nuclear power plants (NPPs) in Russia and one of the four biggest electricity producers in the country.
The main graph is for Gold spot OANDA:XAUUSD , and it indicates on Cup with Handle technical structure in development as Gold takes Adv. since Trump-a-rally pans out to Bulls fart.

TRUMP/USDT(BUY)hello friends
Due to the correction of the price and the breaking of the resistance, we can now buy with risk management and move to the specified goals.
*Trade safely with us*

#TRUMP/USDT#TRUMP
The price is moving in a descending channel on the 1-hour frame and is expected to continue upwards
We have a trend to stabilize above the moving average 100 again
We have a descending trend on the RSI indicator that supports the rise by breaking it upwards
We have a support area at the lower limit of the channel at a price of 12.50
Entry price 13.00
First target 13.53
Second target 14.31
Third target 15.06

TRUMP - LONGRisky trade on TRUMP, it should bounce in these areas. I don't recommend using too much capital. Protect the trade soon.

Bitcoin - Will Bitcoin Hit $100,000?!Bitcoin is trading below the EMA50 and EMA200 on the four-hour timeframe and is trading in its descending channel. Bitcoin’s upward correction and its placement within the channel ceiling will allow us to resell it. It should be noted that there is a possibility of heavy fluctuations and shadows due to the movement of whales in the market and capital management in the cryptocurrency market will be more important. If the downward trend continues, we can buy within the demand range.
During the past trading week, spot Bitcoin ETFs saw a capital outflow of $651 million, breaking their consecutive weekly inflow streak in the United States. Similarly, U.S. spot Ethereum ETFs experienced a modest capital outflow of $26 million, reflecting a nearly neutral trend in this segment.
Over the past few months, Bitcoin and Ethereum have followed different trajectories—Bitcoin has seen a substantial price increase, whereas Ethereum has faced notable challenges. One contributing factor to this divergence has been the economic policies proposed by U.S. President Donald Trump, which have favored Bitcoin.
Bitcoin’s price is currently just below $100,000, after approaching $110,000 in mid-January. Meanwhile, Ethereum has significantly declined from its recent high in December, as concerns over a potential “dangerous” bubble have emerged.
Wall Street giant Goldman Sachs has unofficially confirmed that it has purchased approximately $2 billion worth of Bitcoin and Ethereum in the form of exchange-traded funds (ETFs). According to a regulatory report, Goldman Sachs ramped up its investments in Bitcoin and Ethereum ETFs during the fourth quarter, increasing its Ethereum ETF holdings by 2000% and boosting its Bitcoin ETF investments to over $1.5 billion.
The ETFs acquired by Goldman Sachs include Bitcoin and Ethereum funds managed by BlackRock, as well as those under the control of Fidelity and Grayscale.
In 2023, BlackRock led the campaign for U.S. regulatory approval of spot Bitcoin ETFs, culminating in the launch of a series of these funds in January 2024. These ETFs quickly became some of the fastest-growing exchange-traded funds in history.
For the first time in November, U.S. physical Bitcoin ETFs surpassed $100 billion in net assets, with BlackRock’s iShares Bitcoin Trust (IBIT) now managing over $60 billion in assets.
However, some analysts have downplayed the significance of Goldman Sachs’ Bitcoin and Ethereum ETF investments. James Van Straten, a senior analyst at CoinDesk, stated: “Goldman Sachs’ position, like that of many other banks and hedge funds, is not necessarily a net long position.”
Last month, BlackRock CEO Larry Fink revealed that he had been in discussions with sovereign wealth funds regarding Bitcoin investments, predicting that such talks could push Bitcoin’s price as high as $700,000.
Fink, who spearheaded Wall Street’s entry into the cryptocurrency market last year through a series of Bitcoin ETFs, told Bloomberg at the World Economic Forum in Davos: “If all these discussions had materialized, Bitcoin’s price could have reached $500,000, $600,000, or even $700,000.”
In another major development, the U.S. Securities and Exchange Commission (SEC) officially announced that Ripple is not considered a security and should not be subject to securities regulations. This decision marks a significant victory for Ripple and could ease regulatory constraints and lawsuits that the SEC has pursued against other altcoins.
Additionally, the SEC has indicated that it may drop its lawsuit against Coinbase and has requested 30 days to review the exchange’s applications. Earlier this week, the SEC also dropped its case against Binance, signaling that SEC Chairman Gary Gensler’s crackdown on cryptocurrencies has largely failed. The lawsuit against Coinbase had been one of the most significant regulatory actions against the crypto industry during Gensler’s tenure at the SEC.

TRUMPUSDT Long – High Potential SetupI've allocated 20% of my balance to this trade, going long on TRUMPUS. The probability of a price surge up to $59 is high, considering the ongoing political cycle. With Trump remaining a key figure in U.S. politics, there will be continuous news catalysts driving market volatility.
Trade Setup:
Entry: Current price range
Target: $59 (295% potential gain)
Stop-loss: $5.4 (isolated position for risk control)
I see this as a low-risk, high-reward trade, leveraging strict risk management while capitalizing on market sentiment. 🚀📈
