10Y: Positioning for a Falling Yield EnvironmentCBOT: Micro 10 Year Yield Futures ( CBOT_MINI:10Y1! ), #microfutures
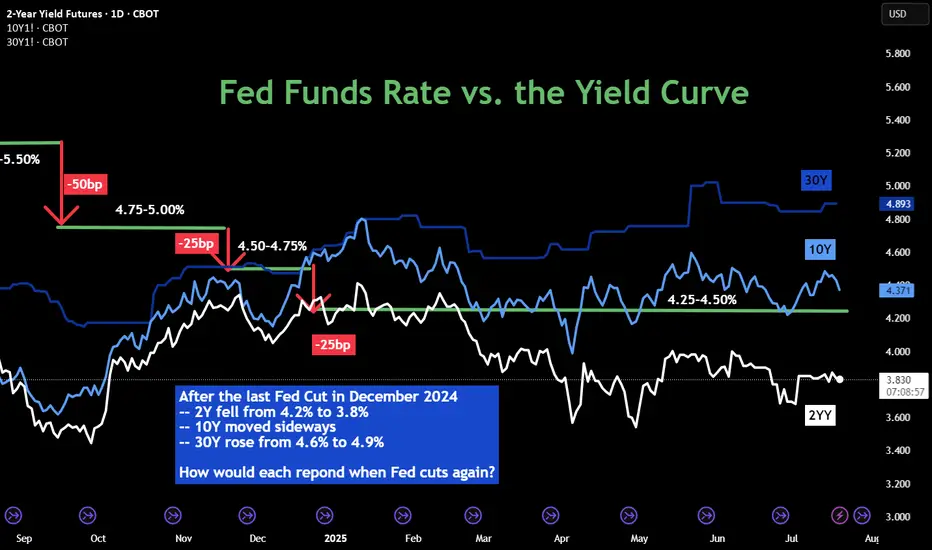
The Federal Reserve last cut interest rates in December 2024. Since then, it has kept the rates unchanged in its January, March, April and June FOMC meetings. While the official Fed Funds rate stays at 4.25-4.50% in the past seven months, we have seen diverging trends in the interest rate market:
• 2-Year Yield has trended down from 4.25% to around 3.85%;
• 10-Year Yield mostly moved sideways, currently at 4.42%;
• 30-Year Yield rose from 4.60% to top 5.00% in May, then pulled back to 4.89%.
The futures market expects the Fed to cut rates once or twice in the remaining four FOMC meetings in 2025, according to CME Fed Watch Tool.
• As of July 20th, there is a 95.3% chance that the Fed will keep rates unchanged in its July 30th meeting;
• The odd of lowering 25 bps is approximately 60% for September 17th;
• By the last 2025 meeting on December 10th, futures market sees just 6.4% chance that the Fed keeps the rates at current level 4.25-4.50%, while the odds of 1 cut to 4.00-4.25% are 29.2%, and the odds of 2 cuts to 3.75-4.00% are 64.3%.
The Fed’s Challenges
The Fed tries to fulfil its dual mandate established by the Congress: (1) to support maximum employment and (2) to maintain price stability. Its official targets are to keep the unemployment rate below 4%, as measured by the BLS nonfarm payroll data, and to keep the inflation rate at 2%, as measured by the PCE price index. When we face an outlook of rising prices and slowing employment, the Fed will have a hard time meeting both policy goals.
Firstly, as the Trump Administration raises tariffs for all trading partners on all imports, it’s a matter of time before the inflation rate picks up again. Even if many countries may reach trade agreements with the U.S., they will still get a bigger tax bill.
• According to the Bureau of Economic Analysis (BEA), the total US imports of goods and services was $4.1 trillion for 2024.
• Imports account for 14% of the US GDP in 2024, which is $29.2 trillion (BEA data).
• Simple math suggests that a universal 10% tariff hike could contribute to 1.4% in price increases, assuming all tariffs are passed through to the retail prices.
The most recent inflation data is the June CPI at 2.7% (BLS data). The tariff hike could easily push inflation to twice the Fed policy target. Therefore, cutting rates will be a very difficult decision if inflation rebounds.
Secondly, US employment growth has slowed down significantly in 2025. On July 3rd, the BLS reported total nonfarm payroll increased by 147,000 in June, and the unemployment rate changed little at 4.1 percent. Current employment growth is less than half the level in December 2024, which saw the data above 300,000.
There are weaknesses in the payroll data. All private sectors combined accounted for about half of the employment gain, or 74,000. Government jobs, while at a much smaller base, accounted for the other half.
Tariffs raise the cost of input, while business borrowing costs remain high at current rate level. To support growth and maximum employment, cutting rates make sense.
Finally, the Fed is under tremendous pressure from the Administration. President Trump openly and repeatedly calls for a 300bp cut.
In an ideal world, the Fed wants to make monetary policy decisions free of political interference. It may not be the case. Let’s look at the Fed rate decisions during the first Trump presidential term. The current Fed Chair was appointed to the role by President Trump in February 2018.
• The Fed raised interest rates four times in 2018, for a total of 100 basis points, with the Fed Funds rate increased from 1.25-1.50% to 2.25-2.50%.
• Under pressure from the White House, the Fed cut rates three times in 2019 for a total of 75 basis points, with the Fed Funds rate ending at 1.50-1.75%.
• In 2020, in response to the Pandemic, the Fed cut rates by 150 points, all the way to a zero-rate environment (0%-0.25%).
In my opinion, the Fed will cut rates this year, similar to 2019. Once the Fed Chair retires in May 2026, his replacement, who will be nominated by President Trump, will no doubt follow his guidelines and bring the Fed Funds rate all the way down to 1%-2% level.
While there is uncertainty in the timing and pace, we are likely to embark on the path to low interest-rate environment.
Shorting Micro 10-Year Yield Futures
A trader sharing a bearish view on interest rates could explore shorting the CBOT Micro 10-Year Yield Futures ($10Y).
Last Friday, the August 10Y contract (10YQ5) was settled at 4.425. Each contract has a notional value of 1,000 index points, or a market value of $4,425. To buy or sell 1 contract, a trader is required to post an initial margin of $300. The margining requirement reflects a built-in leverage of 14.7-to-1.
Let’s use a hypothetical trade to illustrate how to use a short futures position to take advantage of a potential Fed rate cut.
Hypothetical Trade:
• Short 1 10YQ5 at 4.425, and set a stop loss at 4.60
• Trader pays $300 for initial margin
Scenario 1: Fed keeps rates unchanged on July 30th, 10Y moves sideways
• If Futures price changes little after the July FOMC, the trader could close the position
• He could short the September contract 10YU5, with an eye open for the September 17th FOMC rate decision
• This is a futures rollover strategy.
Scenario 2: Fed cuts 25 bps on July 30th, 10YU5 falls 250 points to 4.175
• Short position gains: $250 (= (4.425-4.175) x 1000)
• The hypothetical return will be 83% (= 250 / 300)
Happy Trading.
Disclaimers
*Trade ideas cited above are for illustration only, as an integral part of a case study to demonstrate the fundamental concepts in risk management under the market scenarios being discussed. They shall not be construed as investment recommendations or advice. Nor are they used to promote any specific products, or services.
CME Real-time Market Data help identify trading set-ups and express my market views. If you have futures in your trading portfolio, you can check out on CME Group data plans available that suit your trading needs www.tradingview.com
Trumptariffs
Trump's signalHello friends🙌
🔊Given the good growth we had, you can see that the price has hit resistance and you can see that the upward waves are getting weaker, which indicates that we are likely to have a correction until the support areas are identified...
You can buy in the identified support areas in steps and with capital management and move with it to the specified targets.
🔥Join us for more signals🔥
*Trade safely with us*
Copper: Event-driven Trade Idea on Recent TariffsCOMEX: Micro Copper Futures ( COMEX_MINI:MHG1! ), #microfutures
The Event
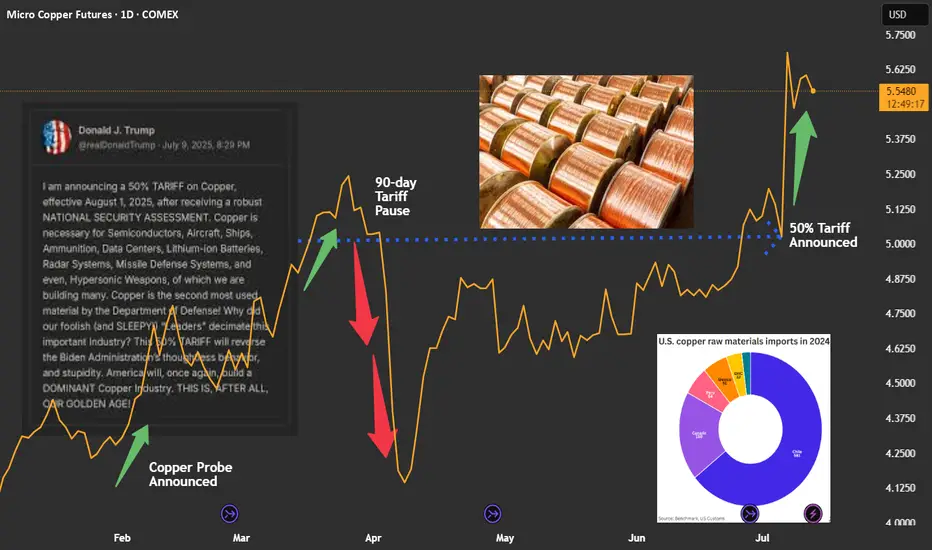
On July 9th, President Trump announced that he would impose a 50% tariff on imports of copper, effective August 1st.
The decision was based on national security assessment. Copper is the second most used material by the U.S. Department of Defense. The President intents to use tariffs to reduce reliance on imports and shore up support for domestic production.
Immediate Market Reaction
U.S. copper prices ended Tuesday’s session over 13% higher — the sharpest single-day gain since 1989. The September COMEX copper futures contract was settled at $5.584 a pound on Friday, up 35.7% year-to-date.
Due to tariffs, Copper in the U.S. is priced at a large premium over international markets.
• UK: LME copper contract was quoted at $9,660.5 per ton on Friday.
• China: SHFE coper futures was settled at RMB 78,420 per ton. It can be converted to $10,959.4 via the Dollar/RMB exchange rate of 7.1555.
• US: COMEX copper quote of $5.584 can be converted to $12,312.7 per ton.
• As of Friday, COMEX copper is priced at a 27.5% premium over LME copper, and a 12.3% premium over SHFE copper.
The U.S. Copper Market
The U.S. Geological Survey reports that the 2024 total refined copper consumption was 1.8 million metric tons. Of which, 850,000 tons were from mining, 150,000 tons were refined from scrap, and 810,000 tons from imports.
Chile is the biggest source of U.S. copper imports, accounting for 581,000 tons, or 71.7% of total imports. Canada is the second largest, for 169,000 tons, or 20.9%.
Copper is a widely used base metal, found in products ranging from machinery, electronics, household goods, housing, infrastructure projects, to aircraft and missiles.
Since President Trump announced a probe into copper in February, traders have been poised for a hike on copper duties, leading to major shifts in inventories away from Europe and Asia and into the U.S.
The Next Event: Will the Copper Tariffs get postponed or reduced?
The goal to increase domestic production of copper is very challenging. It will take years to ramp up and decades to fully meet demand — at a massive upfront investment cost.
Hiking the import duties would not help national security. It could not change the fact that the biggest copper mines are in Chile, Peru and Canada. A sharp increase in the cost of copper will quickly translate into wide-ranging inflation in the U.S.
In my opinion, once the Trump administration realizes the full impacts, we could possibly see a crawl-back from the intended copper tariffs. The effective date would be postponed, the tariff rate could be reduced, and many companies may get exemption/waiver. We have seen similar maneuvers happening multiple times in the past few months.
Overall, the actual impact of copper tariffs will be much smaller than the original announcement.
Shorting COMEX Copper Futures
Historically, the price difference between COMEX and LME coppers has been near-zero and was around the $150 level in 2024.
Since February, COMEX copper has been trading at $500-$1,500 premium over LME. As of Friday, COMEX copper futures have gone up 35% this year and are now priced at $2,652 per ton above LME copper.
In my opinion, these price differences reflect no economic fundamentals. It is purely due to the ever-changing global tariff conflict. If President Trump rescinds his tariff narratives, we could likely see a large drop in COMEX copper prices.
A trader sharing this view could explore shorting the COMEX Micro copper ( GETTEX:MHG ).
Last Friday, the September micro copper futures contract (MHGU5) was settled at 5.5910. Each contract has a notional value of 2,500 pounds of high-grade copper, or a market value of $13,977.5. To buy or sell 1 contract, a trader is required to post an initial margin of $1,100. The margining requirement reflects a built-in leverage of 12.7-to-1.
Let’s use a hypothetical trade to illustrate how to use a short futures position to take advantage a potential reduction on copper tariffs.
Hypothetical Trade:
• Short 1 MHGU5 contract at 5.5910, and set a stop loss at 6.00
• Trader pays $1,100 for initial margin
Scenario 1: Tariffs go into effect, copper rises to $6.57
• Futures reflect a 50% premium over current LME copper price, which is at $4.38 per pound
• Short order stop loss at 6.00, and the maximum loss is $1,022.5 (= (6-5.591) x 2500)
• The trader loses most of the margining fund, but owes no more
Scenario 2: Trump Rescinds Tariffs, Copper falls to $4.38
• COMEX copper will be priced at No premium over LME
• Short position gains: $3,027.5 (= (5.591-4.38) x 2500)
• The hypothetical return will be 275.2% (= 3027.5 / 1100)
The above scenarios show that
• When copper falls, short position will have higher returns due to its leverage nature.
• When copper rises, the stoploss will kick in to set maximum losses.
The above trade idea could be deployed using the standard-size Copper Futures contract. Its notional value is 25,000 tons, which is 10 times bigger than that of the micro contract. The initial margin is $11,000. The standard-size contract is more liquid. On Friday, it had a total volume of 60,313 contracts, and an open interest of 221,682.
Happy Trading.
Disclaimers
*Trade ideas cited above are for illustration only, as an integral part of a case study to demonstrate the fundamental concepts in risk management under the market scenarios being discussed. They shall not be construed as investment recommendations or advice. Nor are they used to promote any specific products, or services.
CME Real-time Market Data help identify trading set-ups and express my market views. If you have futures in your trading portfolio, you can check out on CME Group data plans available that suit your trading needs www.tradingview.com
Live Trump TradeHello friends
Based on the analysis and research we have concluded that it is possible to enter into a transaction with risk and capital management, given the entry of buyers and the price pullback.
*Trade safely with us*

The TACO Trade Is Back!🌮 AMEX:SPY
📊 The Setup:
The TACO trade ("Trump Always Chickens Out") continues to prove its resilience in the face of trade war headlines. The market dips sharply when tariffs are announced, and then surges back up as the news cycle turns, with Trump pausing or reversing his decisions.
We’ve seen multiple examples of this year-to-date on the AMEX:SPY chart:
🔹 Trump Pauses Tariffs for Canada & Mexico – market bounces.
🔹 Trump Pauses Most Liberation Day Tariffs – another bounce.
🔹 Trump Floats Lowering Tariffs on China – bounce continues.
🔹 Trump Pushes Back EU Tariffs to July – market rips higher.
It’s as if every tariff tantrum is followed by an inevitable rebound. Could this be the pattern to trade around for the next few months?
At this point, it almost feels like we’re watching a predictable movie. Every new threat to impose tariffs or spark a trade war is just a scene in the “TACO” storyline, and the markets are starting to get used to the plot twist.
Are we playing into an endless loop of fear and relief? Is this time different, or just the same old TACO? How much longer can we trust that the market will “chicken out” and bounce back every time tariffs are floated?

US Federal Court Rules Trump Tariffs UnconstitutionalUS Federal Court Rules Trump Tariffs Unconstitutional
According to media reports, the US Court of International Trade has:
- declared the tariffs imposed by President Donald Trump illegal;
- ruled that the President exceeded his authority;
- blocked the tariffs, emphasising that under the US Constitution, only Congress has the power to impose tariffs.
The decision was made unanimously by a panel of three judges. Financial markets reacted with:
- a rise in US stock indices;
- strengthening of the US dollar — most notably seen today on the USD/CHF chart, as demand for so-called safe-haven assets declined in light of the tariff reversal.
Technical Analysis of the USD/CHF Chart
The bullish momentum has broken upward through:
- a local downward trendline (shown in red);
- resistance at the 0.8300 level, near the May 22 high.
Additionally:
- the RSI indicator on the 4-hour chart has moved upwards to the overbought territory;
- the area highlighted with a purple rectangle resembles a bullish Fair Value Gap.
Could this upward momentum lead to a sustained uptrend? There is reason for doubt.
Consider the steep decline in USD/CHF in early April (driven mainly by the introduction of Trump's tariffs) and the relatively small size of today's bullish candle compared to that prior drop.
Price action seems to suggest that market participants are skeptical about any lasting change in the situation. The Trump administration has already filed an appeal, and it’s possible the White House could succeed in defending its position.
This article represents the opinion of the Companies operating under the FXOpen brand only. It is not to be construed as an offer, solicitation, or recommendation with respect to products and services provided by the Companies operating under the FXOpen brand, nor is it to be considered financial advice.

Trump Delays Tariffs, but Trade Tensions with EU Are Heating UpDonald Trump is back in headline mode — and this time, the EU is in his crosshairs.
After weeks of relative calm, the US President reignited global trade tensions by announcing a 50% tariff on all EU imports. But in a surprise twist — and in true reality-TV fashion — he’s now pushed the start date from June 1 to July 9.
So Europe gets a five-week stay of execution. Lucky? Or just stuck in limbo?
Let’s dive into what it means for markets, why traders aren’t exactly panicking yet, and whether this is just another Trump bluff — or a prelude to Trade Wars, Season 2.
🍝 All EU Imports — Yes, Even the Pasta
Trump’s post-holiday bombshell would slap a sweeping 50% tariff on everything from French wine and Italian olive oil to German sedans and Spanish ham.
His reason? Brussels is “dragging its feet,” and Trump, never one to shy away from drama, says enough is enough.
Cue the “America First” soundtrack.
But with the tariff now rescheduled for July 9, markets are interpreting this as more of a pressure tactic than an immediate economic hammer. A cooling-off period? Or the calm before the tariff storm?
👀 Markets Blink — But Just Barely
When the initial June 1 announcement hit Friday, Europe’s Stoxx 600 TVC:SXXP dropped about 1% — not exactly a meltdown, more like a “here we go again” shrug.
US stocks , which are closed for Memorial Day Monday, had already wrapped Friday in the red. Investors were digesting the potential for yet another trade war rerun — just when things were starting to feel a bit less chaotic.
The new July 9 date has offered some breathing room, but it hasn’t erased the risk. Instead, it’s created a countdown clock for volatility — one that traders can’t ignore.
⏳ Bluff or Battle Plan?
Trump’s tone this time is more poker table than podium.
“That’s the way it is,” he told reporters.
“Our discussions with them are going nowhere!” he posted on Truth Social.
“I’m not looking for a deal — we’ve set the deal: 50%.”
Still, the sudden five-week delay suggests there might be some wiggle room behind the scenes. Maybe it’s about giving Brussels time to blink. Or maybe it’s about giving voters time to rally.
🧐 Should Traders Be Freaking Out?
Short answer: No.
Slightly longer answer: Not yet.
While the tone feels sharper and the numbers bigger, traders have learned one thing about Trump: even the most dramatic threats often serve as negotiation leverage.
That said, this isn't 2018. The global economy is more fragile. Rates are higher. Consumer fatigue is real. And if this escalates into tit-for-tat tariffs, the recovery narrative could hit a speed bump — just in time for earnings season.
So traders should:
Keep an eye on EU-exposed sectors — autos, luxury goods, industrials
Monitor the FX space — especially EUR/USD volatility
Watch the earnings calendar for reports from multinationals with eurozone exposure
Stay alert for a potential 3 a.m. Trump pivot post
And maybe keep one tab open for the Brussels response
🌱 A New Deadline, Same Old Drama
So, is this real? Maybe. Is it priced in? Partially. Is it over? Definitely not.
The July 9 date might delay the fallout, but it also means the headlines — and market jitters — aren’t going anywhere. Investors now have five more weeks of speculation, positioning, and potential volatility as the transatlantic trade story unfolds.
And if you’re sitting on European exposure? Maybe don’t go full “buy-the-dip” mode just yet. More like a “watch the tape, prep your hedges, and don’t believe everything you read is final.”
Your turn: are you fading the noise or surfing the chaos? Let us know how you’re playing the next move in this global chess match.

US Technology Stock Sector. The Underpressured PathThe recent reduction of tariffs under former President Trump's administration, while intended to ease trade tensions, has had several negative impacts on the U.S. technology sector, particularly in 2025.
Increased Costs and Supply Chain Disruptions
Despite some tariff reductions, the overall tariff environment remains highly volatile and complex. Many tariffs on tech products, especially those involving China, remain elevated-up on Chinese-made smartphones and other electronics. This has significantly increased manufacturing costs for U.S. tech companies reliant on global supply chains, particularly those sourcing components or assembling products in China, Vietnam, and other Asian countries.
The tariffs have disrupted supply chains, forcing companies to reconsider production locations and logistics. Many firms are shifting production away from China to countries like India or Vietnam to mitigate tariff impacts, but this transition is costly and slow. Reshoring semiconductor manufacturing to the U.S. is challenging due to high labor costs and lack of skilled workforce, which means higher prices for end products like AI-enabled PCs and servers are expected.
Suppressed Consumer Demand and Market Uncertainty
Higher tariffs translate to increased retail prices for consumer electronics, reducing demand. For example, smartphone prices have risen, leading to weaker consumer sentiment and slower sales growth. This is particularly harmful in a sector where rapid innovation and high sales volume are critical for profitability and investment in new technologies.
The uncertainty caused by fluctuating tariff policies has also led to delayed purchasing decisions by enterprises and consumers. Companies are hesitant to invest in new hardware or AI infrastructure due to unclear future costs and potential further tariff changes. This delay threatens technology roadmaps and weakens the U.S. tech sector's competitiveness globally.
Impact on Innovation and Investment
Tariffs have broader implications beyond immediate cost increases. By fragmenting markets and increasing operational costs, they reduce incentives for innovation. Companies face pressure to duplicate investments or abandon certain markets, which slows technological progress and reduces the U.S.'s ability to maintain leadership in emerging fields like AI and advanced semiconductors.
The increased costs and uncertainty have also dampened investment in U.S. tech infrastructure. Although some companies like TSMC and Apple have announced U.S. manufacturing investments to offset tariff impacts, these efforts are insufficient to counterbalance the negative effects fully. The long lead times and capital intensity of building semiconductor fabs mean that reshoring will not provide a quick fix.
Economic and Strategic Risks
The tariffs contribute to broader economic risks, including potential recession, inflation, and job losses in the tech sector and related industries. CEOs across sectors have expressed concerns about the tariffs leading to economic downturns, higher prices, and layoffs. The tech sector, being highly globalized and interconnected, is particularly vulnerable to these macroeconomic shocks.
Moreover, the tariffs strain U.S.-China relations, a critical factor in global tech supply chains and innovation ecosystems. Retaliatory tariffs from China and other countries further complicate market access for U.S. tech firms, reducing their export opportunities and competitiveness.
Conclusion
In summary, the recent tariff reductions under Trump's policy have not fully alleviated the negative impacts on the U.S. technology sector. Elevated tariffs continue to raise manufacturing costs, disrupt supply chains, and suppress consumer demand. The resulting uncertainty delays investments and innovation, while economic risks and strained international relations further threaten the sector's growth and global standing. These factors collectively undermine the competitiveness and future prospects of the U.S. tech industry.
Technical challenge
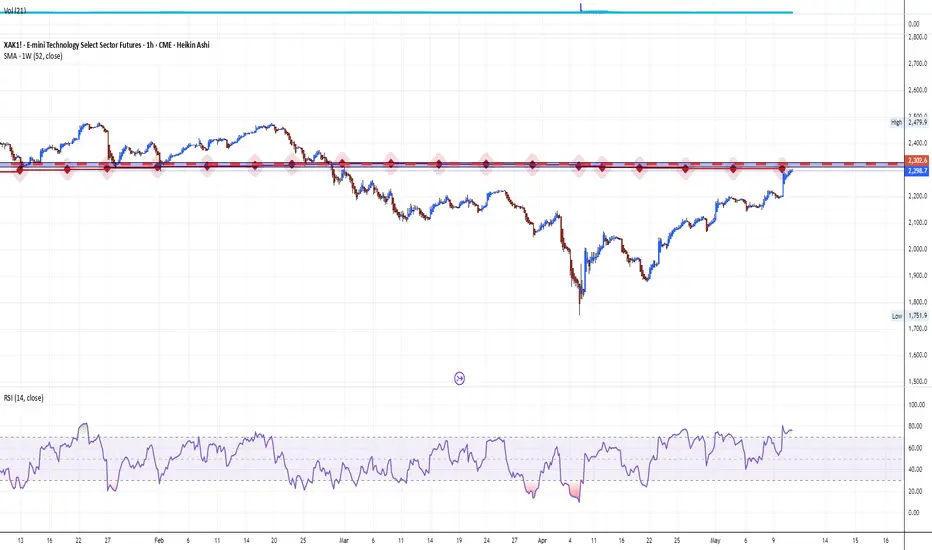
The main technical graph for US Technology Sector Futures CME_MINI:XAK1! (cost-adjusted modification) still remains under key resistance of 52-week SMA, which indicates on further possible bearish pressure.
--
Best wishes
@PandorraResearch Team
NAS100 - Stock Market Expects a Devastating Week!The index is trading above the EMA200 and EMA50 on the 4-hour timeframe and is trading in its ascending channel. I expect corrective moves from the specified range, but if the index corrects towards the demand range, we can look for the next Nasdaq buy positions with a good risk-reward ratio.
U.S. stock futures responded positively to signals from both Chinese and American officials. Looking ahead to the coming week, investor focus is squarely on the Consumer Price Index (CPI) report from the United States—marking the first chance to assess the impact of the new tariffs implemented on April 9.
Meanwhile, ongoing trade negotiations between the U.S. and China remain a crucial factor, with significant implications for inflation, Federal Reserve policy, and overall market expectations. In addition to inflation data, retail sales figures and the preliminary results of the University of Michigan sentiment survey could influence market outlook regarding interest rates—especially since price stability and full employment remain core mandates of the Federal Reserve. At present, Fed officials are working to maintain a cautious stance in order to anchor inflation expectations. However, if clear signs of economic weakness emerge, that stance could shift rapidly—something that several Fed officials have already openly acknowledged.
Retail sales, in particular, could provide a different narrative about the health of the economy. After a notable 1.5% jump in March, estimates suggest that growth in April slowed to just 0.1%. This deceleration may reflect consumer reluctance to spend, stemming either from inflationary pressures or broader economic uncertainty.
Thursday’s data release will include the Producer Price Index (PPI), industrial production, and the Philadelphia Fed manufacturing index—offering a clearer picture of supply-side dynamics and the performance of the industrial sector.
On Friday, attention will turn to a fresh batch of economic indicators: building permits, housing starts, the New York (Empire State) manufacturing index, and especially the University of Michigan’s preliminary consumer sentiment survey. This survey has gained importance in recent months due to notable increases in both one-year and five-year inflation expectations. As recent charts indicate, while consumer confidence has plummeted to multi-year lows, inflation expectations have trended upward—a worrisome combination that could limit the Fed’s ability to ease monetary policy.
Although concerns about a U.S. recession persist, recent data suggest more of a “gradual slowdown” rather than signs of an imminent crisis. In March, both the CPI and PCE indices declined, indicating a temporary easing of inflationary pressures. However, this trend may reverse in April, as the broad implementation of reciprocal tariffs likely raised import costs—particularly for Chinese goods, which now face duties as high as 145%.
New estimates indicate that these tariffs could add 2.25% to core inflation over the next year, effectively reversing the progress made in 2024 on taming price pressures.Prior to the Trump administration’s tariff announcements, economists had differing views on inflation, with some expecting it to approach the Fed’s 2% annual target by year-end. Contrary to trade experts, Trump claimed that sellers would not pass these price increases on to consumers.
Goldman Sachs’ analysis this week suggests that Trump’s tariffs could push inflation to levels not seen since the post-pandemic price surge. The broad import taxes announced between February and April may have a substantial impact on the economy, and consumers are likely to feel the effects first at the checkout counter. Goldman economists estimate that the tariffs could drive annual inflation—as measured by core Personal Consumption Expenditures (PCE)—to 3.8% by December, marking the highest rate since 2023. The Fed’s preferred inflation gauge rose 2.6% last year.
This metric remains above the Fed’s 2% target and has shown limited progress toward that goal since 2023. The last time inflation was below this benchmark was in January 2021.
A renewed wave of price increases could severely strain American household budgets—particularly if the labor market also weakens, as many economists anticipate. This would also represent a significant setback for the Federal Reserve, which has kept interest rates elevated since 2022 in an effort to combat post-pandemic inflation.
While inflation hovered around 3% at the beginning of 2024 with little change, it saw a notable drop in March. Many analysts forecast that inflation will continue to decline and approach the 2% target by the end of 2025.
Walker and Peng’s analysis factored in both the direct effects of tariffs—most of which will likely be passed on to consumers—and several indirect consequences. The trade war has unexpectedly weakened the U.S. dollar, reducing Americans’ purchasing power.
Moreover, some manufacturers may shift production away from China, where tariffs are particularly severe, to locations with higher production costs. As a result, American consumers may end up paying significantly more for imported goods, especially in categories like consumer electronics and apparel.

DXY Analysis: Rising Dollar and Market ImplicationsAnalyzing the recent DXY chart, we observe a significant upward movement following a demand build-up. This article explores the implications of a rising U.S. Dollar Index (DXY) on currency pairs and major indices like the SP 500 and NASDAQ, aligning with current market dynamics.
DXY Chart Breakdown:
The chart highlights a strong weekly/daily demand level at 98,500, with an internal structural shift marking a pivot point. A demand build-up preceded a sharp rise, tapping the extreme level
of the last point of supply at 100.385, suggesting bullish momentum. The DXY currently
stands at 99.915, with potential to test previous supply levels around 101.850.
Impact on Currency Pairs:
A rising DXY typically strengthens the USD, influencing forex markets:
• XXXUSD Pairs (e.g., EURUSD, GBPUSD): These pairs are likely to decline
as fewer dollars are needed to purchase foreign currencies, reflecting the USD’s
increased value.
• USDXXX Pairs (e.g., USDJPY, USDCAD): These pairs are expected to
climb, as a stronger USD buys more of the counterpart currency.
Exceptions may arise due to region-specific economic data or central bank policies.
Effects on Major Indices:
The strengthening dollar has broader market implications:
• SP 500: Multinational companies may face pressure from reduced overseas earnings, while higher interest rates (often linked to a rising DXY) could lower valuations, potentially leading to declines.
• NASDAQ: Tech-heavy and growth-oriented, the NASDAQ may underperform due
to its sensitivity to a stronger USD and rising borrowing costs, especially for firms
with global revenue.
However, a risk-off sentiment or strong U.S. economic data could counter these effects,
supporting both indices.
Conclusion:
The DXY’s upward trajectory signals a robust USD, likely pressuring XXXUSD pairs
downward and lifting USDXXX pairs. For indices, the SP 500 and NASDAQ may face
headwinds, though context like economic releases or global sentiment will play a key role.
Traders should monitor these levels closely for strategic entries and exits.
Trump’s speech today may create short-term volatility for the DXY. A focus on tariffs could push it toward 101.850.

$SPX / $SP500 – China Deal or Global Meltdown? The Risk/Reward 📉 The S&P 500 ( SP:SPX / VANTAGE:SP500 / $ES_F) is at a geopolitical crossroads.
After the Global Pause, the index rebounded, but only to retest resistance near the 200-day EMA. Now it faces a binary outcome:
Scenario A: ✅ Deal with China
Estimated probability: 20%
Potential upside: +10%
Expected value: +2%
Scenario B: ❌ No Deal with China
Estimated probability: 80%
Potential downside: -50%
Expected value: -40%
📉 Expected move: -38% net Markets are not priced for this. Volatility ( TVC:VIX ) is quietly coiling under the surface (chart 2), ready to explode if the no-deal scenario materializes.

XAUUSD - Gold Trend Before FOMC!Gold is trading above its EMA200 and EMA50 on the 4-hour timeframe and is trading on its uptrend line. A continued upward move in gold will put it in the supply zone, where it is possible to look for short positions. A downward correction in gold will also open up long positions.
Gold traders endured another turbulent week, marked by the second consecutive decline in prices—once again underscoring the market’s acute sensitivity to economic news and developments.
Adrian Day, CEO of Adrian Day Asset Management, offered a cautiously humorous take on the situation by likening it to the Peggy Lee song that asks, “Is that all there is?” He pointed out that gold has pulled back by over 7% from its recent high in less than two weeks.Although this correction is notable, it hasn’t been deep enough to flush out all short-term traders or weak-handed investors from the market.
Day added that rising fears of a U.S. recession—which typically exert early downward pressure on gold—alongside the possibility of easing U.S.-China trade tensions, may limit investment demand for gold in the short term. Concluding his comments, he maintained a cautious stance, saying that further downside remains likely and that his outlook for the coming week is bearish.
Meanwhile, U.S. President Donald Trump, in a new interview with NBC, addressed several key economic and political issues. He stated that if necessary, the deadline for selling TikTok would be extended, and some tariffs on Chinese goods might become permanent. Nevertheless, he indicated that he is also considering reducing certain tariffs in the future.
Trump emphasized that small businesses do not require additional assistance and that the Federal Reserve should cut interest rates. He confirmed that Jerome Powell will remain Fed Chair through the end of his term in 2026. He also mentioned potential successors for his own position, naming Vance and Rubio as possibilities.
After a week dominated by employment data, the upcoming week will be entirely focused on monetary policy. The centerpiece will be the May FOMC meeting, the Fed’s rate decision, and Jerome Powell’s press conference on Wednesday. While markets broadly expect the Fed to hold rates steady, Powell’s official remarks and answers to press questions—especially following his sharp tone earlier in April—will be under close scrutiny.
It is widely expected that the Federal Reserve will leave its key interest rate unchanged on Wednesday, as policymakers assess how President Trump’s tariffs gradually impact various sectors of the economy. Markets are currently pricing in a potential rate cut starting in July. The Fed’s dual mandate is to maintain low inflation and high employment, and it may face a dilemma if tariffs negatively affect both indicators, as many economists now warn.
Immediately following the Fed meeting, senior policymakers including Barr, Kugler, Waller, and Cook will travel to Iceland to attend the Reykjavik Economic Conference. On Friday, they will participate in panels discussing artificial intelligence, labor market trends, and monetary research—topics that could offer insights into the Fed’s long-term policy direction.
Simultaneously, traders are also awaiting two key reports: the ISM Services Index for May, due today, and weekly jobless claims figures set for release on Thursday. Together, these reports will help complete the picture of the U.S. economy as critical monetary policy decisions approach.

$USD Breaks Down – “Mission Accomplished” or Just Getting📉 The US Dollar Index ( AMEX:USD / TVC:DXY / $USINDEX) has officially broken beneath the multi-year support zone from 2020, right as Trump prepares to declare "Mission Accomplished".
From Inauguration to Liberation Day, and now the final stage: Meltdown.
🧭 Key Events Marked:
🟥 Inauguration
🟥 Trade War
🟥 Liberation Day
🟩 Mission Accomplished
🔻 Meltdown incoming?
📊 The breakdown aligns with a sharp spike in Nasdaq down volume (see chart). This isn't just a currency move — it's a market-wide stress signal.
Watch closely:
TVC:DXY below 99 = structural weakness.
Risk-on assets may melt up temporarily, but volatility could snap back fast.
Global currency pairs ( FX:EURUSD , FX:USDJPY , FX:GBPUSD ) are all on alert.

Trump token bullishKey Levels: The main resistance is at 10.40 dollars , and the main support is at 7.71 dollars . The descending trendline keeps the price below it, and the 200-period moving average above the price confirms the bearish trend .
Closer Zones: A nearby resistance is observed at 8.06 dollars, overlapping with the trendline. The closer support is at 7.71 dollars. A break above 8.06 dollars could push the price toward 9.60 dollars .
Intermediate Level: On the way up, the 8.25 dollars level acts as an intermediate resistance.
Target: Based on the previous move of 2.50 dollars, the potential upside target is around 9.60 dollars .
Conclusion: A breakout above the nearby resistance could signal a weakening bearish trend and the start of an upward move .

SOLUSDT - Trade LogSOLUSDT – Long Setup in Daily FVG
Entry: Buy at 124 USDT (floor of the daily Fair Value Gap)
Stop Loss: 105 USDT (just below the daily FVG low)
Take Profit: 200 USDT (new all‑time highs)
Rationale:
• Price is retracing into the daily FVG, offering a high‑probability support zone
• Daily RSI double divergence & trendline support reinforce the FVG floor
• Spot accumulation targeting euphoria phase—leveraging the FVG for entry
Risk Management: Risk ~5% of account. If SOL closes below 105 USDT (invalidating the FVG), exit and reassess. Keep an eye on BTC direction as the primary driver.

DJT Weekly Options Trade Plan 2025-04-15NASDAQ:DJT DJT Weekly Analysis Summary (2025-04-15)
Below is a consolidated analysis based on the four reports:
─────────────────────────────
SUMMARY OF EACH MODEL’S KEY POINTS
• Grok/xAI Report:
– Notes that DJT is trading near its 10‐period EMAs on both the 5‑minute and daily charts.
– Indicates a moderately bullish short‐term outlook (helped by positive news about “Truth Social” investment accounts) even though the max pain is at $19.00.
– Recommends a call option trade (buy naked call) at or near the $20.00 strike with an acceptable premium (~$0.63).
• Claude/Anthropic Report:
– The report encountered an error and produced no usable analysis.
• Llama/Meta Report:
– Observes that while the 5‑minute chart shows short‐term bullishness (with price above key EMAs), the overall daily picture and max pain theory (targeting $19.00) point toward a slightly bearish bias.
– Suggests trading a put (such as buying the $19.50 put) but notes factors like high daily volatility and mixed indicators.
• Gemini/Google Report:
– Provides a nuanced view where the 5‑minute charts show consolidation near $20 while the daily chart’s indicators (RSI, MACD histogram, bullish postive news) favor a moderately bullish move.
– Highlights key liquidity around the $20 strikes and ultimately favors a call trade—leaning toward a slightly out‑of‑the‐money option ($20.50 call) but noting that trade risk should be managed tightly.
• DeepSeek Report:
– Summarizes the technical picture with DJT trading above short‐term moving averages but acknowledges max pain at $19.00.
– With a positive news catalyst and falling volatility (VIX), it leans moderately bullish and recommends a call purchase at the $20.00 strike.
─────────────────────────────
AREAS OF AGREEMENT AND DISAGREEMENT
• Agreement:
– All models note a current price of roughly $19.96 with technical support around the short‐term (near the 10‑period EMA).
– Ea
ch analysis recognizes key levels: immediate support near $19.85–$19.94 and resistance around $20.00–$20.50.
– Most models see positive momentum from favorable news (Truth Social catalyst) and improving short‑term indicators.
– Options-chain details (high OI and volume at the $20 strikes) underline the importance of that level.
• Disagreement:
– Llama/Meta tilts toward a bearish reading (using daily MACD and max pain theory, expecting a move toward $19.00) and suggests puts rather than calls.
– Strike selection differs slightly—with some reports favoring the ATM $20.00 call (Grok/xAI and DeepSeek) and others suggesting a slightly OTM $20.50 call (Gemini/Google).
─────────────────────────────
CONCLUSION AND RECOMMENDATION
Overall Market Direction Consensus:
The majority of analyses (three out of four usable models) lean moderately bullish on DJT in the near term. Positive technical momentum on the daily charts together with supportive news outweigh the bearish hints (like max pain and Llama/Meta’s view).
Recommended Trade:
– Trade Type: Buy single‑leg, naked call
– Chosen Strike: $20.00 call (weekly option)
– Expiration: 2025‑04‑17
– Entry: At open with an entry price near the ask of $0.63 per contract
– Risk/Reward Targets:
• Profit Target: Approximately a 20% premium gain (rising from $0.63 to about $0.76)
• Stop‑Loss: About 50% loss of the premium (around $0.32)
– Confidence Level: About 70% (reflecting the bullish bias driven by news and short‑term technicals, while remaining cautious of the max pain level)
Key Risks & Considerations:
– The max pain at $19.00 may exert downward pressure as expiration nears.
– Short‑term volatility remains high (VIX at 30.12), so the trade will need tight risk management.
– Should DJT fail to break above immediate resistance or show signs of a sharp reversal (e.g. dropping below $19.85), consider exiting early to protect capital.
─────────────────────────────
TRADE_DETAILS (JSON Format)
{
"instrument": "DJT",
"direction": "call",
"strike": 20.00,
"expiry": "2025-04-17",
"confidence": 0.70,
"profit_target": 0.76,
"stop_loss": 0.32,
"size": 1,
"entry_price": 0.63,
"entry_timing": "open"
}

Will Gold Retest 3170 ATHs in Sight Amid Rising Global TensionsXAU/USD has decisively broken above the significant 3170 resistance level, confirming bullish momentum and signaling a potential continuation of its long-term uptrend. This breakout is not just technical—it's backed by a growing fundamental storm.
With escalating geopolitical tensions, the ongoing trade war rhetoric surrounding Trump’s tariff policies, and persistent global macro uncertainty, gold is once again asserting its role as a premier safe haven asset. These drivers are creating the perfect backdrop for further upside, possibly pushing gold toward new all-time highs.
Currently, price is in a healthy correction phase, pulling back toward the former resistance zone at 3170, which now acts as strong support. A retest and confirmation in this area may offer a high-probability long setup for trend-followers and breakout traders alike.

“Markets are strong” – Are they really?President Trump recently stated that "markets became very strong once they got used to tariffs."
But let’s look at the facts:
📊 AMEX:SPY is down -9% YTD, and major names like:
MSFT: -7.55%
AAPL: -18.66%
NVDA: -12.94%
Tech is bleeding, and the broader S&P 500 is clearly reflecting the pressure of trade policy uncertainty.
🟥 Tariffs = market stress
🟩 Market resilience = not the same as strength
What we’re seeing is not a “strong market” — it’s a market under pressure trying to survive political noise. The weekly chart shows a clear drop after the peak, followed by uncertainty, not conviction.
💭 Is this truly the “strength” investors want to see?

Trump Manipulates the Market Again: Tariffs ON/OFF PlayOnce again, we’re watching how political narratives are used to shake the markets — and Bitcoin was no exception this time.
🔻 Step 1: "TARIFFS ON" Announcement
Market instantly reacts with a sharp sell-off
BTC drops from 81K to nearly 75K
Fear spikes, media goes wild
📉 That’s your classic short squeeze setup.
🔺 Step 2: "TARIFFS OFF" Retraction
Massive green candle, BTC rebounds from lows
Shorts get liquidated
Price rips back up in minutes
💸 It’s a textbook fake panic followed by a well-timed reversal. Someone knew what was coming. Someone profited. And it wasn’t retail.
🔎 What does this mean? This is not just market volatility — this is narrative-based manipulation. If you're trading without paying attention to headlines, you're already behind.
🧵Follow the money. Follow the timing. Follow the candles. #Bitcoin #BTCUSD #MarketManipulation #Tariffs #Trump #PoliticsInMarkets #Whales #NarrativeTrading #PriceAction

Skeptic | GOLD: Is the Uptrend Over… or Just Taking a Breather? Welcome back, guys! 👋 I'm Skeptic.
Today, we're diving deep into XAU/USD , breaking down the current structure and upcoming trade opportunities. 🔍
Recap & Current Structure:
As mentioned in our previous analysis , after the recent uptrend, we've entered a corrective phase. This correction coincides with rising economic tariffs from the U.S. and retaliatory tariffs from the EU and China—particularly targeting U.S. goods.
Interestingly, gold, which is typically considered a safe-haven asset, also experienced a decline. This raises a red flag: when even gold falls, it signals that markets are likely pricing in an economic slowdown . Everyone seems to be chasing liquidity.
The recession risk is very real, so trade cautiously until a clear trend emerges. Right now, the market is in a state of uncertainty. Given the sharp declines in stocks, gold, and silver, we could see range-bound movement or consolidation this week—and possibly into the next.
Despite this, the major daily trend for gold remains upward , although momentum has clearly weakened. If we see a lower high and a confirmed break below support at 2958.53 , that would significantly shift the outlook—potentially leading to a deeper correction or even a trend reversal, especially in case of broader economic recession signals.
Let’s zoom into the 1H timeframe for actionable trade setups:
📈 Bullish Scenario (Long Setup):
- Trigger : Break & close above 3039.58
- Confirmation : 7 SMA below the candle during breakout + RSI climbing above OB
- Invalidation : Rejection and close back below 2994.10
📉 Bearish Scenario (Short Setup):
- Trigger : Rejection at 3019.98 followed by a drop below 2958.51
- Confirmation : RSI entering oversold
⚠️ Key Notes:
- Risk Management: Avoid overleveraging. Wait for clear confirmations before entering any trade.
Stay sharp, stay Skeptical, and I’ll catch you in the next analysis!

Walmart Withdraws Earnings Guidance Amid Tariff UncertaintyWalmart (NYSE: NYSE:WMT ) has withdrawn its operating profit forecast for the current quarter. The company cited tariff-related uncertainties as the reason. Rising import duties from countries like China and Vietnam have impacted cost structures. Walmart aims to keep pricing flexible to protect margins.
Despite the near-term challenges, Walmart reaffirmed its full-year guidance. The retailer expects net sales to grow between 3% and 4%. It also sees adjusted operating profit growth between 3.5% and 5.5% for the year.
Walmart highlighted additional concerns, including insurance-related costs and shifts in consumer behavior. Shoppers are spending more on low-margin essentials due to inflation. This change in product mix has also pressured the company’s margins.
CEO Doug McMillon said Walmart will continue focusing on pricing discipline, inventory efficiency, and expense control. He admitted that the current environment remains unpredictable. However, the company will stick to its long-term strategy.
Technical Analysis
Walmart’s stock is currently trading at $90.46, up 10.53%, with a high of $90.80. The price has bounced from a strong support zone near $82, forming a bullish momentum candle. NYSE:WMT is now testing a resistance area at $89, previously a demand zone.
A successful break and retest could lead to a rally toward the $105.30 previous high. However, rejection at this level could see the price fall back to the $82 support. But with the recent bullish momentum, a breakout at $89 is possible.

Charles Schwab ($SCHW) Upgraded by Morgan Stanley to Overweight Morgan Stanley has taken new rating actions on financial exchanges and brokers as markets face heightened uncertainty. The investment bank highlighted concerns over economic growth, sticky inflation, and interest rate paths. Recession fears and tariff-induced volatility have also rattled investor confidence.
According to Morgan Stanley, such conditions increase the need for hedging, trading, and risk management by corporations and asset owners. The note added that the recent market sell-off may discourage retail investor activity, especially as portfolio losses and margin calls mount.
Despite these challenges, Charles Schwab (NYSE: SCHW) received an upgrade to Overweight. The firm cited Schwab’s more stable earnings profile and strong fundamentals. Morgan Stanley sees a 20% annual EPS growth for Schwab over the next two years. The bank also noted Schwab’s resilience amid the volatile macro environment.
Technical Analysis
Charles Schwab's stock is showing strength despite the broader market downturn. Price action recently formed an inverted Head and Shoulders pattern. This is aligned with an ascending trendline that dates back several months.
Currently, SCHW is testing a solid horizontal support level that confluences with the trendline near $70. If momentum remains strong, the next potential target is $84, the high from February 2025. The bullish chart formation, combined with Morgan Stanley’s upgrade, supports a possible price surge from the current level.

TradeCityPro | MNTUSDT Effects of the Bybit Hack👋 Welcome to TradeCityPro Channel!
Let’s dive into the analysis of the popular DeFi coin that’s active on the Mantle chain—where they’re running multiple airdrops and utilizing it for fees. Let’s break it down and analyze it together!
🌐 Overview Bitcoin
Before starting the analysis, I want to remind you again that we moved the Bitcoin analysis section from the analysis section to a separate analysis at your request, so that we can discuss the status of Bitcoin in more detail every day and analyze its charts and dominances together.
This is the general analysis of Bitcoin dominance, which we promised you in the analysis to analyze separately and analyze it for you in longer time frames.
📊 Weekly Timeframe
After hitting 1.4077, which was our previous ATH, there were practically no buyers present here, preventing us from breaking this key ceiling and moving upward.
Additionally, after the rejection from this high and an engulfing of the previous two candles, it’s safe to say our upward movement has concluded, and we’re now heading into at least a period of correction. This has already started as we’ve entered a resting phase from the prior trend.
However, after breaking 0.9030—coinciding with the news of the Bybit hack and the theft of Ethereum and its coins by North Korean hackers—we experienced a sharp drop. Given that Bybit held a large volume of this token, the decline was even more pronounced.
📉 Daily Time Frame
In the daily timeframe, after the rejection from 1.4077 and a deep drop, we moved upward again. This time, we hit resistance at 1.2353 multiple times, but nothing happened—buyers couldn’t push above this level.
With this lack of buying pressure, sellers stepped into the market. We then formed a support at 1.0102, but after breaking it—along with the hack news—we saw a sharp drop down to 0.06552! This level is highly significant!
It’s important because this was previously a key resistance, and after breaking it earlier, we kicked off our main uptrend. So, it’s a critical support now, and it won’t break easily! However, if this support does fail, we’ll likely see a drop to 0.5340.
For buying, it’s not a good time yet. But if we get support at 0.6552 with a strong daily candle, we could consider a buy. Alternatively, wait for a box formation and structure. Our current entry trigger would be a break above 0.8464. For selling, my stop loss would be below 0.5340.
✍️ Final Thoughts
Stay level-headed, trade with precision, and let’s capitalize on the market’s top opportunities!
This is our analysis, not financial advice always do your own research.
What do you think? Share your ideas below and pass this along to friends! ❤️
