Levi Strauss Drops to $13.5 Despite Strong Q125 Earnings Report Levi Strauss & Co. (NYSE: NYSE:LEVI ) closed at $13.50 on April 7, falling 2.81%. Despite strong Q1 results, macroeconomic pressures and tariff-related uncertainties weighed on the price.
In its Q125 earnings report released on April 07th, 2025, the company reported a 9% organic net revenue growth in Q1 2025. Direct-to-consumer sales rose 12%, driven by strong e-commerce activity. Wholesale revenue increased 5%, with the U.S. segment growing by 8% and international sales rising 9%.
Levi achieved a record gross margin of 62.1%, up 330 basis points from last year. Adjusted EBIT margin expanded by 400 basis points to 13.4%. The adjusted diluted EPS came in at $0.38, marking a 52% year-over-year increase.
SG&A expenses grew 2% to $744 million while inventory levels were up 7% from last year. The company also declared a dividend of $0.13 per share, up 8%.
In regional performance, the Americas led with an 11% increase in revenue. The U.S. segment alone contributed an 8% rise. Europe posted a 3% gain, led by growth in the UK and Germany. Asia saw a 10% revenue increase, with a 14% boost in direct-to-consumer sales.
Despite strong numbers, challenges persist. The company shut down 21 net stores, including 51 franchisee locations in China. The China business was flat year-over-year. Moreover, tariff-related risks remain a concern, potentially impacting pricing and margins.
Technical Analysis: Stock Near Double Support in Descending Channel
NYSE:LEVI is trading within a descending channel from its $24.34 high recorded in June 6th 2024. Price action shows consistent lower highs and lower lows. Currently, the stock is approaching a double support zone around $12.0 to $13.0. This area has acted as a strong floor in past cycles.
Its 3-day RSI currently reads at 26.32, signaling oversold conditions. This could indicate a potential bounce if the support zone holds.
If the price breaks below the $12.0 level, the next downtrend could open and target the $11 or $10 psychological level.
Next Move: Bullish Breakout or Bearish Continuation?
Should the price hold support, a short-term reversal may follow, with resistance at $15.25, and then the descending channel upper band at around $17.00.
A confirmed break above $17.00 would shift momentum to the upside. Until then, the downtrend remains intact. Volume during the recent drop reached 10.7 million shares, showing strong selling interest.
The next earnings report is expected between June 24 and June 30. Watch for signs of reversal or further decline near this key support.
Trumptariffs

Retard Finder Coin (RFC) Surges Over 230% in Last One Week Retard Finder Coin (RFC) continues its explosive rally. The meme coin has surged 44.20% in the last 24 hours. In the last 7 days, RFC has gained 231.38% and 254.63% over the last 30 days.
As of now, RFC trades at $0.03901 with a market cap of $37.6 million and its daily trading volume has reached $14.79 million. Circulating supply stands at 961.55 million RFC out of a total 1 billion tokens.
RFC is a meme coin with no utility. It was created purely for entertainment. Inspired by meme culture, it aims to bring humor to the crypto space. The token has a large online community with over 660,000 followers.
The coin gained traction alongside a broader crypto market recovery. Bitcoin climbed back to $79,000 after dropping below $75,000 due to recent tariff announcements by Trump. Ethereum now trades above $1,500, XRP above $1.80 as the overall market continues to recover.
Technical Analysis
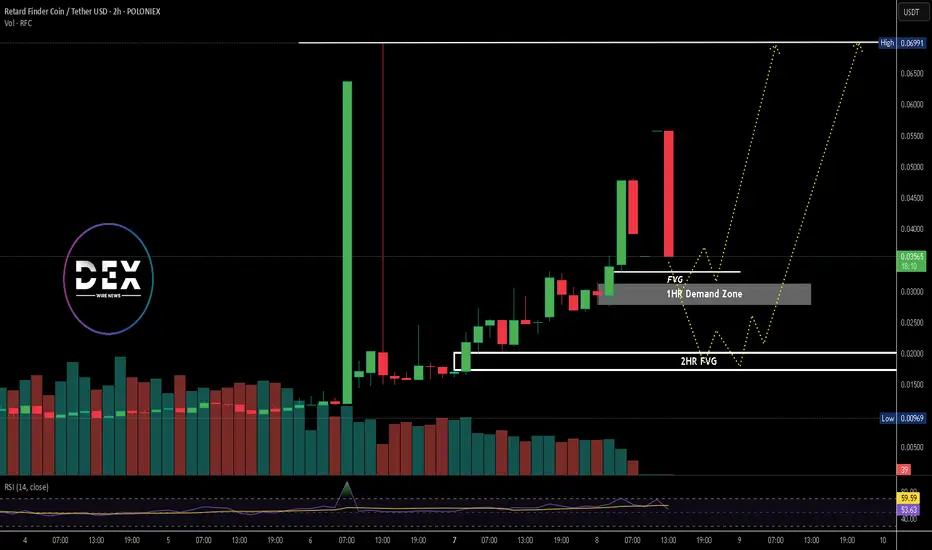
RFC reached a recent high of $0.06991 on April 6th. After the peak, it dropped sharply to $0.01476. Since then, the price has been recovering steadily. However, the last two hours have shown bearish movement.
Watch closely as the price approaches key levels as the coin needs to reclaim momentum to retest the previous high. If RFC gains strength again, it could return to $0.06991 and possibly surpass it. This would need a strong support for price to get a rejection from and get enough strength to break above a key swing high
Potential Support Zones
Currently, support lies at the 1-hour demand zone and a fair value gap (FVG) lying above at around $0.03000. If price breaks below this level key support area, it may fall further to the 2-hour FVG at $0.01884.
This zone could serve as a key support area for bulls to regroup. If the price confirms a bullish reversal at either level, RFC could resume its upward trend. Failure to hold support in any of the levels may lead to a deeper retracement.
Key levels to monitor remain around these support zones. In summary, RFC continues to draw attention despite its lack of utility. The coin rides the meme wave and strong community support. While short-term volatility persists, these key technical levels offer potential entries for bullish continuation.
Bitcoin Falls Below $75,000, Impacting Crypto-Exposed StocksBitcoin (BTC) slipped under $75,000 on Monday as fresh U.S.-China trade tensions rattled markets. The drop followed President Donald Trump’s announcement of new tariffs on Chinese goods. Beijing responded swiftly, increasing fears of a prolonged trade war.
Bitcoin fell to a daily low of $74,500 before recovering to trade near $79,000. This marked its lowest level since November 2024. Before the drop, Bitcoin had consolidated around $85,000 for several weeks.
The crypto market lost 7% of its total market capitalization in 24 hours. Coinglass data showed $1.61 billion in crypto liquidations. Bitcoin dominance rose slightly to 62.62%.
Ethereum (ETH) and XRP also recorded sharp losses. Ethereum briefly dropped below $1,500 but rebounded above support. XRP fell over 10%, currently trading at $1.8710.
Meme coins and altcoins mirrored the losses. Nearly all top-30 tokens saw double-digit declines. Derivatives traders reduced exposure, with open interest falling 10% to $91.19 billion.
Crypto-Exposed Stocks Take a Hit
Stocks tied to crypto followed Bitcoin’s slide. Shares of Coinbase Global (COIN), Marathon Digital (MARA) and Robinhood (HOOD) all declined. Strategy Inc. (MSTR), formerly MicroStrategy, dropped 9.24% in pre-market trading. The company holds a large Bitcoin treasury, making it sensitive to BTC movements.
However, chipmaker Nvidia (NVDA) rose 3.5% in a minor rebound. The stock had fallen 14% the previous week, its worst since January 2024. Nvidia remains down 27% year-to-date.
Technical Analysis: Bitcoin Retests Key Levels
Bitcoin has remained bearish since hitting an all-time high of $109,000 in January. The recent slide takes BTC back to levels last seen in November 2024. Despite temporary bounces, the market continues to trend downward.
BTC is now hovering above $78,000 but may head toward $71,000 support. This level could provide a base for a potential rally. A move below $71,000 could trigger further declines.
Recovery Depends on Macro Conditions. Traders are watching for new developments and macroeconomic data. The market needs positive catalysts to reverse bearish sentiment. Sentiment remains fragile after Trump’s tariffs and fears of global slowdown. The future of the crypto market under Trump’s administration is uncertain.

$AEHR Set to Report Q125 Financial Results Post-Market April 8thAehr Test Systems ( IG:NASDAQ : NASDAQ:AEHR ) will report its first-quarter fiscal 2025 financial results on April 8, 2025. The announcement will follow the market close and the earnings call will begin at 5:00 p.m. Eastern Time.
The upcoming report covers the fiscal quarter ending February 28th, 2025. Zacks Investment Research expects the company to post an EPS of $-0.02. This compares to an EPS of $-0.05 from the same quarter last year.
As of 3:35 p.m. EDT on April 7th, AEHR stock traded at $7.31, up $0.05(0.69%), with the price hovering above a key support level at $7.
Recent Financial Performance and Guidance
In July 2024, Aehr reported financial results for the fourth quarter and full fiscal year 2024.
For Q4 2024, revenue was $16.6 million, down from $22.3 million in Q4 2023. GAAP net income was $23.9 million or $0.81 per share. This included a tax benefit of $20.8 million. Non-GAAP net income was $24.7 million or $0.84 per share.
Bookings during the quarter totaled $4.0 million. The backlog stood at $7.3 million as of May 31, 2024. Effective backlog, including post-quarter orders, reached $20.8 million. For the full year 2024, Aehr recorded record revenue of $66.2 million. This was slightly higher than $65.0 million in 2023. GAAP net income for the year was $33.2 million or $1.12 per share. Non-GAAP net income reached $35.8 million or $1.21 per share.
Cash and cash equivalents were $49.2 million at the end of May 2024. This was an increase from $47.6 million at the end of February 2024. The company expects at least $70 million in revenue for fiscal 2025. It also projects a pre-tax profit of at least 10% of revenue.
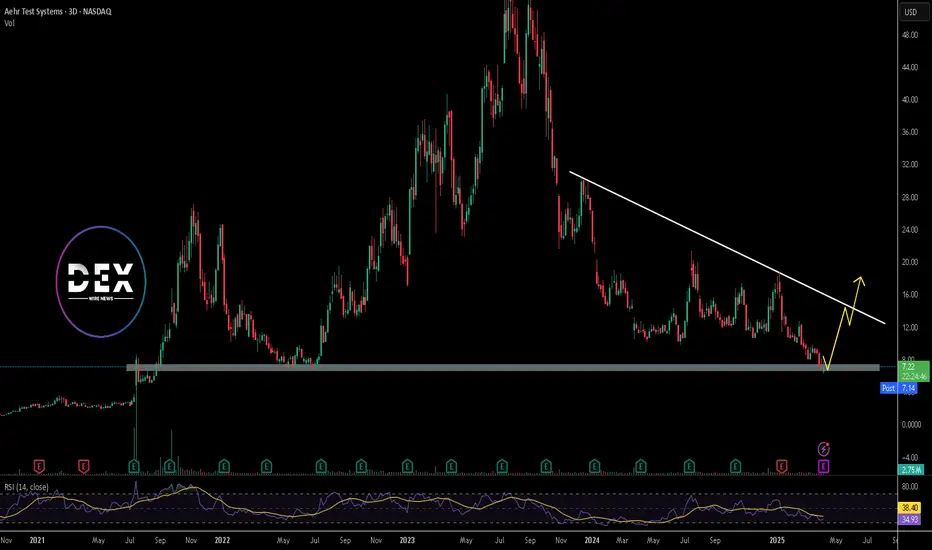
Technical Analysis: Support at $7 Holds
AEHR stock is testing a crucial support zone at $7, a level that has shown buyer interest in the past. The stock is currently trading slightly above support as traders watch to see if it remains above this level after earnings.
A positive earnings report may offer more bull strength at the support and trigger a rebound. If the price rebounds, the next immediate target is a descending trendline resistance. The trendline has rejected prices to trade above it in recent months. This therefore acts as a strong point that will need positive market developments to break above.
However, if earnings disappoint and bearish pressure grows, the stock could fall below $7. A breakdown would however expose NASDAQ:AEHR to lower support zones and potential new lows.
PVH Corp to Announce Q1 2025 Earnings After Market ClosePVH Corp. (NYSE: NYSE:PVH ) reported its fourth-quarter and full-year 2024 results on March 31, 2025. The company exceeded revenue expectations and outlined a stable 2025 outlook.
Fourth-quarter 2024 revenue fell 5% year-over-year to $2.372 billion. This included a 3% decline from the 53rd week in 2023. The company had guided for a 6% to 7% drop. On a constant currency basis, revenue declined 2%, beating expectations of a 4% to 5% fall.
Full-year 2024 revenue dropped 6% to $8.653 billion, slightly better than guidance. Constant currency revenue fell 5%.
PVH posted a GAAP operating margin of 8.9%, just under its 9.2% guidance. A pre-tax actuarial loss of $28 million on retirement plans affected results. On a non-GAAP basis, the operating margin was 10%, in line with expectations.
GAAP earnings per share were $2.83 for Q4, matching the lower end of guidance. Full-year GAAP EPS reached $10.56. Non-GAAP EPS came in higher at $3.27 for Q4, beating the forecast of $3.05 to $3.20. Full-year non-GAAP EPS totaled $11.74, above the $11.55 to $11.70 range.
In 2025, PVH expects flat or slightly higher revenue growth compared to 2024. The company forecasts a non-GAAP operating margin near or slightly above 10%. EPS is projected between $12.40 and $12.75, with a $0.20 negative impact from foreign currency translation.
In other news, the company repurchased $500 million of its stock in 2024. PVH plans another $500 million in share buybacks through accelerated share repurchase agreements in 2025.
Technical Analysis: Price At Key Support
As of writing, NYSE:PVH stock is trading at 65.54, -2.18 (-3.22%), and testing a key support zone. This zone combines horizontal support with an ascending trendline. A breakdown below this level could trigger further declines, with the next major support lying near $44, the previous low.
Upside Potential Hinges on Earnings Strength
If support at $64 holds, PVH could rally toward the $90 resistance zone and immediate target.
The future movement will likely depend on Q1 2025 earnings. A strong report may fuel a short-term rebound. A weak result on the other hand, could drive the price below the current support.

Nifty recovers from lows of the day. But not out of danger yet.Nifty as expected suffered heavy losses due to Trump Tariff Tornado which has engulfed the global markets. The good thing which is the silver lining in the cloud was that it recovered from the lows of the day by a lot. The lowest point of today or perhaps the year 2025 so far was 21743 and we closed the day at 22161. Which is about 418 points. However we are not out of the woods yet. We will hopefully see bottom formation later during this week or the next if this lowest point is already not the bottom. The support levels for Nifty remain at 21743, 21289, 20790 and 20320. Resistance for Nifty will be at 22266, 22711, 23083 and 23384. Above 23384 closing Nifty will be back to the bulls territory and we can hope for a recovery towards 24K first and then 25K.
As of now the ball is still in Trump's court as the world sizzles with his Whims and fancies. China is planning a stimulus package for its industry and High level cabinet meeting is going on in India as I write this to counter the effects of Trump Tariff and swift recovery of our economy in addition to minimising the effect of damage.
The best strategy is to wait out the Trump Storm reassess the situation once bottom is formed. Those who have liquidity this is a good oppertunity to go long after bottom fishing.
Disclaimer: The above information is provided for educational purpose, analysis and paper trading only. Please don't treat this as a buy or sell recommendation for the stock or index. The Techno-Funda analysis is based on data that is more than 3 months old. Supports and Resistances are determined by historic past peaks and Valley in the chart. Many other indicators and patterns like EMA, RSI, MACD, Volumes, Fibonacci, parallel channel etc. use historic data which is 3 months or older cyclical points. There is no guarantee they will work in future as markets are highly volatile and swings in prices are also due to macro and micro factors based on actions taken by the company as well as region and global events. Equity investment is subject to risks. I or my clients or family members might have positions in the stocks that we mention in our educational posts. We will not be responsible for any Profit or loss that may occur due to any financial decision taken based on any data provided in this message. Do consult your investment advisor before taking any financial decisions. Stop losses should be an important part of any investment in equity.

Flow Traders: A Deep Dive into a Volatility PlayFlow Traders has long been recognized as one of the leading market makers in Exchange Traded Products (ETPs), holding a dominant position in Europe and steadily expanding its global footprint. The firm’s success is driven by its technological prowess—its ultra-low latency trading systems and proprietary algorithms enable it to provide liquidity across thousands of listings. When compared with major competitors such as Virtu Financial, Citadel Securities, Jane Street, and Optiver, Flow Traders stands out for its high profit margins and robust returns during volatile periods. However, its earnings can swing dramatically: record profits during periods of market turbulence contrast with more compressed margins in quieter times.
Historically, Flow Traders followed a dividend policy with an intended payout ratio of at least 50% of net profits. In FY23, for example, the company paid a total dividend of €0.45 per share (an interim dividend of €0.30 per share plus a final dividend of €0.15 per share). However, in its recent 2Q24 results and AGM communications, Flow Traders announced a revised dividend policy that suspends regular dividend payments until further notice. The Board has made this decision to accelerate the expansion of its trading capital base—a move the management believes will deliver greater long-term value for shareholders through reinvestment in technology and market expansion rather than immediate income distribution.
Technologically, Flow Traders continues to push the boundaries by investing in co-located servers, low-latency networks, and even exploring cloud-based systems with microsecond-level synchronization. These initiatives ensure that the firm maintains a competitive edge, even as peers like Virtu and Citadel invest heavily in their own technological infrastructure. While Flow’s niche focus—especially in European ETF market making—provides a strong competitive moat, the firm is also expanding into fixed income and digital assets.
For valuation purposes, I used a blended approach incorporating a Discounted Cash Flow (DCF) model and industry comparables, augmented by a scenario analysis that reflects the inherent cyclicality of its earnings. In my model, three scenarios were considered over a five-year period. Under the best-case scenario, where global market volatility surges and Flow capitalizes on its technological advantages to boost market share, the five-year target price could reach around €80 per share. In a base-case scenario, reflecting a more normalized yet steadily growing trading environment, the target price might be closer to €40 per share. In the worst-case scenario—if markets remain persistently calm and competitive pressures intensify—the target could drop to about €15 per share.
Given the current market environment, the probabilities are 30% for the best-case, 60% for the base-case, and 10% for the worst-case. Additionally, the discount rate in the DCF 6%, reflecting today’s economic landscape risk premium. With these assumptions, discounting the future target prices at 6% yields present values of approximately €60, €30, and €11 for the best, base, and worst scenarios respectively. Weighting these figures accordingly results in an expected intrinsic value of around €37 per share today.
So, what does this mean for investors? At current trading levels in the mid-€20s, Flow Traders appears to be undervalued relative to its long-term potential. Although the firm is currently not paying dividends—opting instead to reinvest its profits to grow its trading capital—the strategic focus on reinvestment may unlock greater growth opportunities. In essence, Flow Traders represents an intriguing volatility play: it can generate outsized returns in turbulent times while offering a balanced risk/reward profile in more normalized markets.
Ultimately, Flow Traders’ strategic decision to suspend dividends underscores its commitment to long-term growth. Investors are essentially buying into the firm’s reinvestment strategy, which has historically delivered strong returns on trading capital. As market volatility and technological advancements continue to drive the industry, Flow Traders is well-positioned to capitalize on emerging opportunities and create shareholder value over the long run.
Speculation: With Trump’s tariffs continuing to rock global markets and trigger bouts of heightened volatility reminiscent of past trade wars, there’s reason to speculate that Flow Traders could find itself in a particularly advantageous position. As tariffs fuel uncertainty and market swings—further rattling investor confidence and prompting rapid shifts in liquidity—Flow Traders’ expertise in market making, especially in ETPs, could allow it to capture significant trading opportunities. The elevated volatility may widen bid-ask spreads and boost trading volumes, directly benefiting firms like Flow that thrive on rapid, high-frequency trades. While these are merely speculative thoughts, given the unpredictable nature of tariff-driven market disruptions, Flow’s focus on liquid, exchange-traded products might well make this turbulent period a silver lining for the company.

Merck & Co. (NYSE: $MRK) Sets Up Q125 Earnings Call for April 24Merck & Co. (NYSE: NYSE:MRK ) will hold its Q1 2025 earnings call on April 24 at 9:00 a.m. ET. Company executives will present financial results and performance updates during the call.
As of April 4th, 2025, MRK closed at $81.47, down $4.92 (5.70%). The stock has declined steadily since peaking at $134 in June 2024.
In Q4 2024, Merck posted global sales of $15.6 billion, a 7% increase from the previous year. Sales growth stood at 9% when excluding foreign exchange effects. Full-year 2024 revenue reached $64.2 billion, a 7% increase over 2023. Human health sales grew 8%, driven mainly by oncology treatments.
KEYTRUDA remained the company’s top product with sales of $7.8 billion in Q4, rising 21%. WINREVAIR generated $200 million in sales, while new vaccine CAPVAXIVE added $50 million. The Animal Health division showed strong momentum, growing 13% year-over-year. Merck’s global reach extended to nearly 500 million people in 2024.
However, GARDASIL vaccine sales dropped 18% in Q4 due to lower demand in China. This led Merck to pause GARDASIL shipments to the region temporarily. Operating expenses for the quarter totaled $7.4 billion. The company reported a gross margin of 80.8%, up by 3.6 percentage points. Earnings per share came in at $1.72.
For 2025, Merck expects revenue between $64.1 billion and $65.6 billion. EPS guidance is set at $8.88 to $9.03, excluding foreign exchange impact. The Medicare Part D redesign could reduce revenue by about $400 million in 2025. This would affect WINREVAIR and other small molecule oncology drugs.
Technical Analysis
MRK stock is currently testing a major support level at $81.A confirmed breakdown at this critical level could push the stock lower. Price momentum and volume suggest a likely continuation of the bearish trend unless support holds. With the bearish pressure in place, the next support level lies at $70.
The weekly chart shows consistent lower highs and lower lows since June 2024. MRK has fallen nearly 65% from its peak of $134.
If the $81 current support holds, a short-term rebound is possible, with an immediate resistance target around $95. Reclaiming this level may signal early signs of a trend reversal. If a strong break at the $81 level is witnessed, the next target remains the $70 support.
The current trend favors sellers. One thing to watch closely is the April 24th, 2025, earnings call as performance updates may provide clarity on near-term price direction.

S&P 500 Records Largest Weekly Decline Since 2020The S&P 500 Index has suffered its steepest two-day drop since the pandemic crash in March 2020. On April 4th, 2025, the benchmark index closed at 5,074.08, down 322.44 points (5.97%). This marks a loss of $5.4 trillion in market value across just two sessions.
The sell-off followed comments from Federal Reserve Chair Jerome Powell. He warned that President Donald Trump’s new tariffs could lead to persistently higher inflation. All 11 sectors in the S&P 500 closed in the red. Only 14 stocks remained positive as Nvidia and Apple fell more than 7%, while Tesla dropped 10%.
The Nasdaq 100 Index plunged 6.1%, confirming a bear market after losing over 20% from its February peak. The rapid decline mirrors the speed seen during the 2020 COVID crash and the 2000 dot-com bust.
President Trump announced sweeping tariffs on U.S. imports on Wednesday. These include a 10% general tariff and higher rates on dozens of countries. China responded by imposing a 34% levy on American goods. The tit-for-tat measures triggered fears of a full-scale global trade war.
Global markets reacted sharply. Investors pulled out of stocks and moved into safer assets like government bonds. The two-day loss of $5 trillion on the S&P 500 set a new record, surpassing the $3.3 trillion loss during March 2020.
Rick Meckler, of Cherry Lane Investments, said the escalation is now deeper than many investors expected. The initial belief that tariffs were a negotiation tactic has now given way to serious market concerns.
Technical Analysis: Price Approaching Key Support Zones. Will They Hold?
The S&P 500 has shown a bearish trend since early 2025. Several weekly candles have closed bearish, confirming a strong downtrend. Currently, the index is trading lower toward a key ascending trendline near $4,930.
The $4,930 support level may offer short-term support. A bounce from here could see a brief recovery. However, the sentiment remains bearish without strong economic data or policy changes.
Further Downside Risk If Support Fails
Another horizontal support sits at $4,780. If both support levels fail, the index may fall toward the $4,500 psychological zone. This level is crucial as it marks a long-term support and potential reversal point.
At present, bearish momentum dominates, with much strength coming from trade war fears. Unless data shifts investor sentiment, the downtrend may persist.

Jaguar Land Rover Temporarily Halts U.S Shipments Amid TariffsJaguar Land Rover (JLR), owned by Tata Motors, has paused shipments to the U.S. market this April. The move follows a 25% import tax on vehicles imposed by U.S. President Donald Trump. JLR described the U.S. as a vital market and stated it is now adjusting to new trade rules with business partners.
The pause is a short-term step. The company aims to finalize longer-term strategies to manage the new tariffs. Analysts believe other British carmakers may soon follow this approach. Britain's auto sector faces pressure from falling domestic demand and the costly transition to electric vehicles.
David Bailey, a University of Birmingham professor, predicts more stoppages. He said automakers will reassess their plans amid rising costs and trade uncertainty. Recent data shows U.K. car production fell 13.9% last year to 779,584 units. Over 77% of these vehicles were exported.
The Society of Motor Manufacturers and Traders (SMMT) voiced concern. CEO Mike Hawes said the timing worsens an already challenging period. He urged swift trade talks to protect jobs and growth. The SMMT has stayed in regular contact with the U.K. government to seek solutions.
To soften the tariff’s impact, carmakers rushed to build inventories in the U.S. JLR was among them. U.K. car exports to the U.S. jumped 38.5% in Dec, 12.4% in January and 34.6% in February.
According to official figures, British automakers shipped £8.3 billion ($10.7 billion) worth of cars to the U.S. in the 12 months through September. Cars remain Britain’s largest goods export to the U.S. However, goods make up a smaller portion of overall trade. Services account for 68.2% of the £179.4 billion ($231.2 billion) in total U.K.-U.S. trade during the same period.
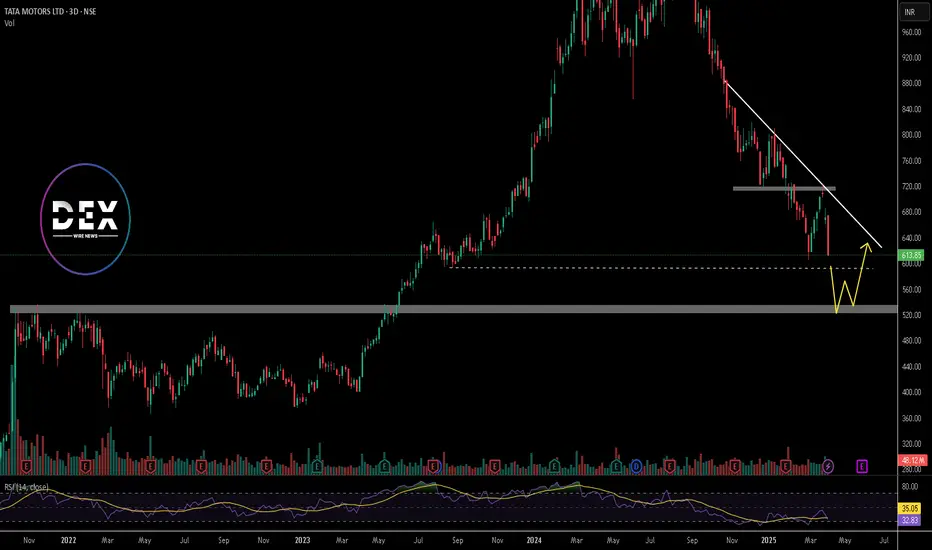
JLR is not independently listed. But looking at the parental company, Tata Motors (TATAMOTORS.BO) trades on India’s BSE. Its stock closed at INR 613.85 on April 4th, 2025 (6.15%).
Technical Analysis: Bearish Momentum Since July 2024 Highs
Tata Motors stock peaked at INR 1179 in July 2024. Since then, it has shown a sharp downtrend. It has surged in bearish momentum and has been breaking major support levels. In late January 2025, the price broke below key support at INR 715 and has retested it in March 2025. Currently, it trades lower and is approaching the next support at around INR 591.
If this level fails to hold, the price may fall to INR 525. The downtrend has persisted for months, indicating sustained bearish pressure in the market. The weekly RSI now reads 32, derived from deep bearish sentiment. If the RSI dips further, it may signal oversold conditions. However, the current momentum suggests the stock could still drop.
If INR 591 holds, a short-term bounce may follow, with a short-term recovery phase that could push the stock toward the descending trendline. Still, bears maintain control for now, and a break below 591 may accelerate further losses.
Crude OIL CRASH - OPEC & Trump - Recession Catalyst#Recession is here, Markets are bleeding.
Crude #Oil is the kicker.
I shorted TVC:USOIL on Friday.
Hunting on this trade for a while now.
Very #Bearish outlook on #WTI.
MARKETSCOM:OIL Weekly
#FundamentalAnalysis
- #OPEC+ Output Hike (411K bpd)
- #Trump #Tariffs & #TradeWar
I'm looking at a #CrudeOIL #MarketCrash, similar to the #Covid era, when NYMEX:CL1! went in minus on #Nymex #Futures.
TVC:USOIL & my BIG SHORT
#Trading EASYMARKETS:OILUSD via CFDs with #Leverage.
Executed my #Sell Position on #WTI at $64.
* DYOR before, it's not a financial advice, I just share.
#TechnicalAnalysis
- #ElliottWave Impulse Cycle a (white)
- #Correction in Primary ABC (red)
- #LeadingDiagonal in Primary A (red)
- #Descending Triangle in Primary B (red)
Why will BLACKBULL:WTI Crash?
#Bearish Primary C (red) has started.
#Break-out below the Triangle Flat Line.
Important Note:
The #Bearish #Impulse will continue lower.
After the short-lived pull-back, Sellers will dominate.
$63-64 Range is the Entry.
MARKETSCOM:OIL Daily
TVC:USOIL #Short #TradeSignal
- Entry @ $63-64 Range
- SL @ $73
- TP1 @ $40
- TP2 @ $30
- TP3 @ $20
Stay in the green and many pips ahead!
Richard (Wave Jedi)

Goldman Sachs Raises Recession Odds to 35% Amid Tariff Fears Goldman Sachs (NYSE: GS) has lowered its S&P 500 year-end target again. The firm now sees the index ending at 5,700 points, down from its earlier forecast of 6,200. This revision comes just days before President Trump’s new round of tariffs is set to begin. The updated target implies only a 2% gain from Friday’s close of approximately 5,597.
Chief U.S. Equity Strategist David Kostin pointed to rising tariffs and slowing economic growth as key concerns. The revised forecast reflects a cautious outlook in light of economic risks. This is the second time Goldman has slashed its target this month.
At the same time, Goldman Sachs has raised its 12-month recession probability to 35%, up from a previous 20%. Chief Economist Jan Hatzius explained that higher tariffs and softening economic data contributed to the decision. Goldman now estimates the average U.S. tariff rate will rise to 15% in 2025, compared to an earlier projection of 10%.
Alongside these changes, the bank has cut its Q4 2025 U.S. GDP growth forecast to 1.0% from 1.5%. The adjustment follows weakening household and business confidence. Recent White House comments also suggest officials may accept short-term economic strain to pursue long-term trade objectives.
These developments reflect growing concern across Wall Street. Goldman’s 5,700 target ranks among the lowest of major forecasts. With markets already on edge, the new projection underscores broader fears over trade tensions and economic resilience.
Technical Analysis: Bearish Momentum Below $500
The S&P 500 has turned bearish after falling below a key support at $510. This level had held firm previously but now acts as resistance. The break and close below the key level signals strong bearish pressure and there is a possibility of more bearish momentum.
Price is currently trending lower towards the next potential support at $440. If it breaks below it, further drop could follow. The bearish pressure may continue unless the bulls defend the key support level.
However, if the bulls can finally defend the $440 level, it could potentially recover and target $510. In that case, the first resistance to overcome is $510. If it is also broken above, the next target would be the $592 resistance zone. A break above $592 could revive bullish momentum.
As of April 4th 2025, Goldman Sachs stock closed at $21.74, down 1.50% on the day. Investors await further updates ahead of the earnings report due April 14th 2025.

Trump Tariffs send global Markets into free fall. Trump Tariff announcements has sent the global markets into free fall. The reaction has sent global markets into knee jerk reaction. Global trade will axis will realign because of these actions of US. As per the analysis of many experts the disadvantages to India are limited. There are opportunities galore in sectors like Pharma and Textile etc. The support levels for Nifty currently are at 22338, 21983, 21289, 20095 and finally 19864. The resistances for Nifty are 23037, 23266 and 23894. Long term Resistance for Nifty remain at 24831 and 25K levels.
Short term outlook for Nifty is weak. In the medium term Nifty can remain range bound and Long term outlook for Nifty still remains strong. Investors with Long term outlook can search for Bottom Fishing opportunities in Blue chip stocks which are available at good prices.
Focus should be on India centric themes where products and companies are less dependent on exports specially to US. Having said that it can be a blessing in disguise for sectors like Pharma and Textile. If Indian leadership can turn this obstacle into oppertunity by taking the right steps it can be a curse in disguise. Investors can also look at collecting some ETFs international as well as local as a long term investment.
In cricket matches sometimes losing a toss can be a blessing in disguise this is something like that.
Disclaimer: The above information is provided for educational purpose, analysis and paper trading only. Please don't treat this as a buy or sell recommendation for the stock or index. The Techno-Funda analysis is based on data that is more than 3 months old. Supports and Resistances are determined by historic past peaks and Valley in the chart. Many other indicators and patterns like EMA, RSI, MACD, Volumes, Fibonacci, parallel channel etc. use historic data which is 3 months or older cyclical points. There is no guarantee they will work in future as markets are highly volatile and swings in prices are also due to macro and micro factors based on actions taken by the company as well as region and global events. Equity investment is subject to risks. I or my clients or family members might have positions in the stocks that we mention in our educational posts. We will not be responsible for any Profit or loss that may occur due to any financial decision taken based on any data provided in this message. Do consult your investment advisor before taking any financial decisions. Stop losses should be an important part of any investment in equity.

Tesla Stock Drops 9%+ After Q1 Deliveries Drop to Three-Year LowTesla (Nasdaq: NASDAQ:TSLA ) is trading at $242.52 as of 1:04 PM EDT on April 4th, down 9.26%. The stock fell $24.76 after reporting weak Q1 2025 results. This came two days after Tesla closed its worst quarter since 2022, shedding 36% in market value. The company delivered 336,681 vehicles in Q1, missing analysts’ expectations of 360,000 to 377,590. This marked a 13% drop compared to Q1 2024, when it delivered 386,810 units. Production also fell to 362,615 vehicles from 433,371 in the prior year.
Tesla produced 345,454 units of its Model 3 and Model Y. Deliveries for those models stood at 323,800. Other models, including the Cybertruck, accounted for 12,881 deliveries. The quarter saw partial factory shutdowns to upgrade lines for a redesigned Model Y.
CEO Elon Musk said this model could again be the world’s best-selling car in 2025. But now the question is, will it?
Looking at it, Tesla faces several challenges, including increased EV competition and reputational damage tied to Musk’s political involvement. Of late, the CEO’s position in Trump’s Department of Government Efficiency (DOGE) has drawn backlash.
Protests, boycotts and vandalism against Tesla facilities and vehicles spread across the U.S and Europe. In Germany, Tesla’s EV market share dropped from 16% to 4%. Across 15 European countries, market share fell to 9.3% from 17.9%.
China also posed challenges. Tesla sold 78,828 EVs in March, an 11.5% year-on-year decline as domestic competitors like BYD increased their market presence. In Canada, Tesla claimed 8,653 EV sales during a January weekend to qualify for subsidies. The transportation ministry froze the payments and launched a probe into the claim.
Technical Analysis: Price Approaches Key Support Zone
Tesla’s price has declined sharply since hitting an all-time high of $488 in late December 2024. Since January, the stock has been in a downtrend, respecting a descending trendline. In early February, it broke a key support level at $290 and retested the level in late March before continuing downward.
Currently, the stock is approaching support at $190, a critical level for short-term price action. If it holds, the stock could attempt to break the descending trendline and move toward the $290 resistance.
If Tesla's bearish bias persists and breaks below $190, the next support sits at $140. This aligns with the head of a previously completed head-and-shoulder pattern. Breaking this level could trigger further losses.
The next few weeks will determine if it rebounds or slides deeper, with earnings report expected on Apr 22nd, 2025.

Tariff FUD is reking ports. SPY 505 First Stop. 460 Second.Trading Fam,
It's no surprise that Trump's implementation of high tariffs would cause initial FUD. This can be observed in the massive spikes on the $VIX. What is unknown and has caught many traders by surprise, myself included, is how substantial of a drop would be incurred by investor uncertainty.
Initially, it did appear that 500 might hold. That was a huge support. I knew if it broke, the sell-off would be deep. But I held hope that the market would hold above this trendline. It did not. So, yesterday and today, investors who held are incurring substantial losses.
For those who were smarter than me and sold at or near the top, congratulations! You've saved yourself some duress and cash. Now, some are calling this the beginning of a longer bear market. I still don't see it that way. Honestly (and I know this will be hard to believe), I still see the SPY hitting my target #3 at 670-700 before 2026 comes to an end. Longer-term we still remain in a massive secular bull market since 2009 and to break this long-term trend, the SPY would actually have to break below 300. That is a long way down and I just don't see that happening, though as always, I definitely could be wrong.
Shorter-term I am seeing two prominent areas of support. The first has almost been reached at 505. If I would have played this correctly, I'd be DCA'ing in my first load of cash here. The second area of support is at around 460 and slightly rising daily. This would be where I DCA'ed in another load of cash. However, if that broke, I'd exit immediately and reassess the charts. 300 is a long way down, but over the past 5 years we have seen some extraordinary market price action and volatility. TBH, even the best of us technicians are struggling to understand the larger macro-economic picture, but I'd wager to say that tariff fears may be overexaggerated as market reactions often tend to be.
One interesting note is that crypto price action no longer seems to correlate and prices have help up surprisingly well. Could this be our first indicator that the markets are due to turn up again in a few weeks/months? Unknown. But I can promise you I'll be watching this all closely.
✌️Stew

General Motors (NYSE: $GM) Reports 17% Y0Y in Q12025 Sales General Motors (NYSE: NYSE:GM ) opened at $44.46 on April 4th, 2025, down 3.91%. The stock declined $1.80 in early trading. This came a day after Trump’s new 25% auto import tariffs took effect. In a report released on April 2nd, GM delivered 693,363 vehicles in Q1 2025, a 17% year-over-year increase. This marked the company's best Q1 since 2018. In Q1 2024, GM sold 594,233 units.
The automaker led in truck and compact SUV sales. Electric vehicle sales surged 94% to 31,887 units. GM currently remains the second-largest EV seller in the U.S, behind Tesla.
Other automakers posted mixed results. Ford's sales declined by over 5% on Thursday due to the tariffs.
GM’s growth came partly due to early consumer purchases ahead of the tariffs. Retail sales jumped in March, with buyers seeking to avoid expected price hikes.
Tariffs Threaten GM's Supply Chain
Trump’s 25% tariffs on imported vehicles started on April 3rd. According to the White House, tariffs on auto parts will begin no later than May 3.
Barclays analyst Dan Levy noted that only 52% of GM’s U.S sales in the first three quarters of 2024 came from domestic production. The rest came from plants in Mexico (30%) and other countries (18%). Levy added that GM depends on imports for models like the Equinox and Blazer. These are mostly built in South Korea and Mexico. The tariffs will likely increase production costs and squeeze margins.
Despite strong Q1 performance, GM faces near-term risks from global trade tensions and supply chain disruption.
Technical Analysis: Price at a Key Support Level.
GM stock has been retracing from its $61.24 52-week high in November 2024. It now tests a strong support level at $43, which aligns with the 78% Fibonacci retracement level. If GM bulls hold this key support level, they could trade bullish towards the $53 target resistance. The $53 high serves as a key resistance level of an internal structure high and March high.
However, a break below $43 may push the stock lower, with the next potential support at $39, which aligns with 100% retracement level.
Forecast: Watch for Breakout or Breakdown
GM's technical position is delicate. A rebound from $43 could start a continuation of the trend. But extended trade risks and import costs could drag it down further. The company’s stock has fallen over 11% year-to-date. Analysts on TipRanks rate it a Moderate Buy. The average price target is $62.17, offering a 42% surge from the current market price.
With the earnings date set to be released on Apr 29, 2025, this will provide more clarity on the overall market sentiment.

Ford (NYSE:F) Drop 5%+ as Tariffs Threaten Auto Industry marginsFord Motor Company (NYSE: F) is facing a challenging market environment as its stock price fell 5.27% to $9.61 as of 3:24 PM EDT. This drop comes amid declining sales and the looming threat of new tariffs from the Trump administration. In the last 52 weeks, Ford's stock has traded within a range of $9.06 to $14.85.
On Tuesday 1st April, Ford reported a 1.3% decline in total vehicle sales year-over-year, delivering 501,291 vehicles in Q1 2025. Despite this decline, retail sales rose by 5%, with a strong 19% surge in March, signaling that buyers may be accelerating purchases ahead of the impending tariffs.
General Motors (GM) posted strong results with a 17% increase in sales, delivering 693,353 vehicles in Q1 2025. The company achieved double-digit growth across all its brands, marking its best first-quarter performance since 2018. While GM shares remained stable, Ford shares saw further declines.
Tariffs Add Uncertainty for Automakers
The auto industry is preparing for the impact of a 25% tariff on foreign cars and parts. The Trump administration confirmed on Wednesday that his 25% global car and truck tariffs would take effect as scheduled on Thursday and that duties on automotive parts imports will be launched on May 3rd.
Although Ford manufactures most of its vehicles in the U.S, many essential parts are imported. Higher production costs could push car prices higher, affecting demand.
Ford executives have stated they are assessing the impact of these tariffs on their business operations. Chairman William Clay Ford Jr. assured shareholders that the company is prepared to handle geopolitical uncertainties. Despite this, investor sentiment remains cautious, contributing to the recent stock price decline.
Technical Analysis
Ford’s stock has been trading within a narrow range of $9 to $10 in the last three months. A strong resistance level at $11, tested several times from August to November 2024, remains unbroken. Since failing to break the resistance level, the stock has since then declined.
Currently, the price is testing a double support level at $9 comprising of a horizontal key support and a descending trendline. If this support holds, Ford’s stock may attempt another bull phase toward the $11 resistance level. On the other hand, a break below $9 could push the price lower, with the next potential support level at $8.45.
The 50-day, 100-day and 200-day moving averages are positioned above the current Market price, at $9.74, $10.08 and $10.70 respectively. This indicates strong bearish pressure, limiting bullish momentum in the near term.
Thoughts Moving Forward
With tariffs and the auto industry facing supply chain disruptions, Ford’s stock is likely to remain under pressure. The bearish sentiment could persist in the short term, especially if the price breaks below the key $9 support level.
If support holds, Ford could see a short-term bounce toward $11. However, sustained bullish momentum would require strong demand and improved market sentiment. This would be witnessed if its earnings report, set to be released between April 22nd and April 28th, 2025, is favorable. Until then, geopolitical and economic uncertainties weigh on the stock.

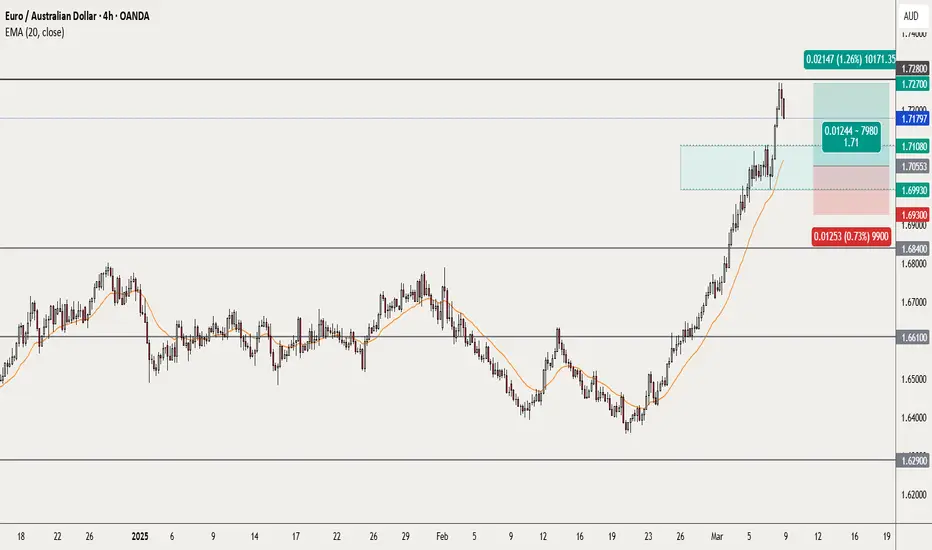
EURAUD looking for value zone to go long ... the week of 10 Mar Weekly – strongly bullish
Daily – strongly bullish
H4 – bullish, now pulling back towards a consolidation zone between 1.7108 and 1.69930 (marked on my chart). 20 ema is also currently located here.
When/If price reaches this zone, I will be monitoring PA on H4 and H1 timeframes with a view to find evidence of a bullish continuation. In the current uncertain US situation, it is vital to establish that control of the market has returned to the bulls, before taking a long trade. Stop can be below the zone (around 1.6930) or a bit lower with the initial target at about 1.7280.
This is not a trade recommendation, merely my own analysis. Trading carries a high level of risk, so only trade with money you can afford to lose and carefully manage your capital and risk. If you like my idea, please give a “boost” and follow me to get even more. Please comment and share your thoughts too!!
It’s not whether you are right or wrong, but how much money you make when you are right and how much you lose when you are wrong – George Soros
Yellow Boy Shorting EurosEUR
With Trump's statements, the wick I was waiting for in the euro came and now I will wait for it to fall below the trend, then I think a nice short awaits us. The 0207 03 region looks good as the first support. I expect DXY to rise to the 108.5 area.

$DXY HOLDS FIRM—TRUMP TARIFFS & FED FUEL 2025 BUZZTVC:DXY HOLDS FIRM—TRUMP TARIFFS & FED FUEL 2025 BUZZ
(1/9)
Good afternoon, Tradingview! The U.S. Dollar Index ( TVC:DXY ) sits at 106.47 today—tariffs and Fed vibes keep it humming 📈🔥. Down a hair from 106.60—let’s unpack this greenback glow! 🚀
(2/9) – YEARLY SURGE
• 2024 Run: From 100.16 to 107+ by Dec 💥
• Today: 106.47—off 0.12% from yesterday 📊
• Driver: Trump tariffs juice inflation fears
TVC:DXY ’s got grit—2025’s off to a zesty start!
(3/9) – BIG BOOSTERS
• Tariffs: Auto, chip threats—dollar darling 🌍
• Fed: Slow cuts—rates outshine abroad 🚗
• Crypto Nod: Pro- AMEX:USD admin vibes 🌟
Greenback’s flexing—policy packs a punch!
(4/9) – MARKET PULSE
• Vs. Peers: Outpaces euro, yen—rate gaps shine 📈
• X Chatter: 107 peak, post-swearing dip?
• Edge: U.S. growth trumps global woes 🌍
TVC:DXY ’s steady—king of the currency hill?
(5/9) – RISKS IN PLAY
• Deficits: Fiscal bloat looms long-term ⚠️
• Geo-Tension: Wars nudge safe-haven bets 🏛️
• Fed Pivot: Faster cuts could dim shine 📉
Tough tailwinds—can TVC:DXY dodge the drag?
(6/9) – SWOT: STRENGTHS
• Tariffs: Inflation lift—dollar darling 🌟
• Rates: Fed’s edge over ECB, BOJ 🔍
• Haven: Chaos loves $ USD—rock solid 🚦
TVC:DXY ’s got muscle—global star!
(7/9) – SWOT: WEAKNESSES & OPPORTUNITIES
• Weaknesses: Debt piles—future wobble? 💸
• Opportunities: Tariff hikes zap rivals 🌍
Can TVC:DXY keep the crown or stumble?
(8/9) – TVC:DXY at 106.47—what’s your vibe?
1️⃣ Bullish—108+ by spring.
2️⃣ Neutral—Holds steady, risks hover.
3️⃣ Bearish—Dips below 100 soon.
Vote below! 🗳️👇
(9/9) – FINAL TAKEAWAY
TVC:DXY ’s 106.47 glow—tariffs, Fed, and grit shine 🌍🪙. Deficits lurk, but strength rules—bull or bust?

Are Trump’s Tariffs More Bark Than Bite? What Markets Are SayingThe heated tariff drama is reverberating across global markets with a different impact depending on the region and the asset itself. Some markets, previously considered highly sensitive to extra tax charges, are actually doing better than the dominant stocks on Wall Street. Or maybe that’s just the calm before the storm? Let’s find out.
🌏 Are Europe's Stocks Great Again?
European stocks are leaving Wall Street equities in the dust, contrary to investor expectations ( contrarians, hat tip to you ). Since Donald Trump officially stepped into the top job in American politics (and started the whole tariff narrative) the Europe-wide Stoxx 600 index SXXP has gained roughly 6% to date. Its US counterpart, the S&P 500 SPX is up about 2.5% over the same time span.
Europe’s start-of-year spectacle is so good it prompted Bank of America analysts to dig into the archives and realize this is the old continent’s best opening since the 1980s. That is, while European countries struggle to power up their economies and the European Central Bank is dropping interest rates fast .
The tech-heavy Nasdaq Composite IXIC has fallen out of favor and is languishing around with a 2.2% increase since Trump took office. Moreover, the elite club called the Magnificent Seven is barely getting by. With the exception of Meta META , which is up more than 20% this year, all the others are either underwater or head above the water.
By the looks of it, Trump is gradually rolling out his punishing tariffs but European investors don’t seem too scared. Earlier this week, the US President revealed his intentions to slap the auto industry with a hefty 25% tariff starting April 2. Drugs and chips got picked on, too, with levies in the same neighborhood.
The auto space in Europe is bound to feel the weight of that auto tariff decision. Currently, Europe’s car manufacturers are taxed with a 2.5% levy on their way to the US. In the other direction, however, the US is obligated to pay a 10% duty when it imports cars into Europe.
The proposed auto tariffs knocked Asia’s automaker stocks during the Asian session on Thursday. The Nikkei 225 index NI225 was trading almost 2% lower with the auto sector dragging the broad performance.
👀 What’s Happening Elsewhere?
Gold XAUUSD is apparently the biggest winner of the tariff threat. As long as it doesn’t get slapped with one. The yellow metal has skyrocketed to levels near $3,000 with a Thursday session high of $2,955 per ounce, breaking its record made earlier in the week . What a bonanza for gold bugs as their main asset is up 15% since mid-December with no corrections and no signs of slowdown.
The US dollar has been taking blow after blow, giving rival currencies some much-needed reprieve . The dollar index DXY , measuring the buck’s strength against six forex rivals, is down about 3% from its two-year peak in early January.
Bitcoin BTCUSD , the fire-breathing volatility dragon, has actually been pretty tamed up as Trump’s crypto working group has stayed mostly tight-lipped over the prospects of crypto-friendly legislation. Prices of the orange coin celebrated inauguration day with an all-time record but have slipped 11% since then to dive back under $100,000.
Against that backdrop, what are you loading up on? Are you stacking up some European shares and shunning their US peers? Or you’re after that OG token under $100,000? Let us know in the comment section!

EURUSD SHORTNFP came in lower than expected but unemployment rate declined. The next event coming up is US CPI, which is expected to go up. I am still maintaining a sell position because any higher than expected CPI will force the FED to continue holding. Also with the Trump's tariff threats I still anticipate the EURO to remain under pressure. Those with no entries watch for 1.03500 and go short.
