OFFICIAL TRUMP 1,244% Target Revealed & Map UpdateI have several questions for you:
1) Did the market break your patience? Are you still holding?
2) How much are you going to take? Will you go for 278% or maybe 1,244%?
TRUMPUSDT has been really uneventful lately and this is good, it means that consolidation is still happening and consolidation is a form of exercise for a trading pair; TRUMPUSDT is building strength.
From a technical analysis perspective, the chart is great, still bullish continues bullish; looks good. Because the action continues to happen as a higher low compared to 7-April. 7-April is the market bottom, as long as this level is not challenged or broken we are now in the bullish zone.
The move that peaked in late April is the initial bullish breakout. The higher low 22-June marks the point where the retrace from the initial bullish breakout ends. 22-June can also signal the start of the next upthrust. From here on we will see growth.
Higher lows lead to higher highs. We have a very clear, strong and ecologically sustainable higher low. This means that a higher high comes next.
Here is the tricky, not so tricky part: TRUMPUSDT will grow to $50, $62, beyond $100 and so on, but, not all growth happens in a single wave. Just as TRUMPUSDT moved from $7 to $16 and then stopped, it can move from $9 to $34 and then make another stop, this one short. Then another rise toward $50 and so on. The market never moves straight down but neither straight up. And this gets us to my point. Will you sell when resistance is hit to later buy back lower, or, will you continue waiting until the market top, higher targets?
That's the question you need to answer to maximize profits when the action goes green. If you decide you want to sell the wave, then make sure to prepare to sell when the market is green. What happens is that if you don't sell when green but wanted to take some profits then you will do so when the market is red. In this case you will not be taking out the maximum possible...
Anyway, we have to leave something for another day. TRUMPUSDT will grow, for certain, but it takes time. Patience is key.
Thank you for reading.
Namaste.
TRUMPUSDT


MR President - When $16?How can we forget Mr TRUMP!!!!!?? The marker mover hahaha, so unless price is likely to stay above 9.148 unless there’s heavy sellingm< weekly looks positive but not lookinh onto those shi

Trump:New update(don't miss it)hello friends👋
This time we came with the analysis of Trump's famous coin meme, which you requested a lot.
Well, as you can see, by making a double floor, the price has broken its downward channel and has grown well.
After the price growth, we saw the price suffering and then the price correction, which caused the formation of an upward pattern.
Now, according to the successful formation of this ascending pattern, it should be seen whether the buyers support the price in the specified support areas or not...
Pay attention that our trend is upward and the pattern made also shows an upward trend, that's why we have identified the support areas for you to enter the transaction step by step with risk and capital management.
🔥Follow us for more signals🔥
*Trade safely with us*

#TRU/USDT#TRU
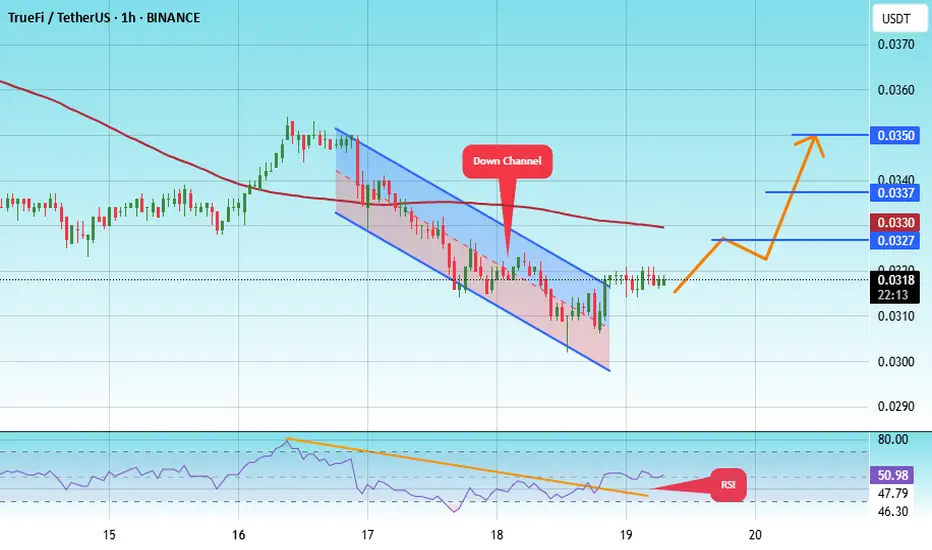
The price is moving within a descending channel on the 1-hour frame, adhering well to it, and is heading towards a strong breakout and retest.
We are experiencing a rebound from the lower boundary of the descending channel. This support is at 0.0300.
We are experiencing a downtrend on the RSI indicator, which is about to break and retest, supporting the upward trend.
We are in a trend of consolidation above the 100 Moving Average.
Entry price: 0.0315
First target: 0.0327
Second target: 0.0337
Third target: 0.0350
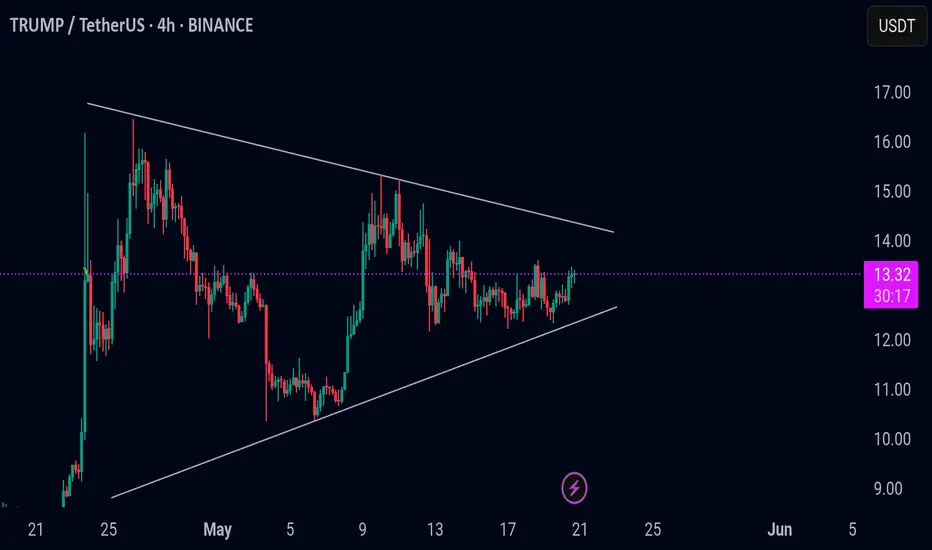
TRUMPUSDT In my opinion, we could still see a further 10% drop, considering the market’s cyclical nature — though it does feel like we’re near the bottom at this point.
Based on the indicators below, MACD and CCI are also showing signs of compression, similar to what we're seeing in the technical analysis.
Overall, I think by June 20th we’ll have a clearer picture of where the breakout from these triangle formations is headed

Live Trump TradeHello friends
Based on the analysis and research we have concluded that it is possible to enter into a transaction with risk and capital management, given the entry of buyers and the price pullback.
*Trade safely with us*

TRUMPUSDT price analysis✊ It seems that the price of $Trump will only skyrocket when #Trump is impeached!
And we're keeping our fingers crossed that this happens as soon as possible... Mr. #Musk, you have nothing to lose — spill the beans!
As a Ukrainian classic wrote: “I gave birth to you — I will kill you.”
🕯 As for the price of OKX:TRUMPUSDT , it is moving very harmoniously and according to the canons of TA, regardless of who makes some “news throws” and does it on time or not.
And this is not surprising, as the crypto market titan Justin Sun has invested in it. His reputation is controversial, but he knows how to defend his “creations” and investments, pump them up, and make money on them.
So, it's purely hypothetical to assume that the price of $Trump will continue to rise, but this is by no means a call to invest in the red-haired jerk's coin. ✊
_____________________
Did you like our analysis? Leave a comment, like, and follow to get more

#TRUMP/USDT#TRUMP
The price is moving within a descending channel on the 1-hour frame and is expected to break and continue upward.
We have a trend to stabilize above the 100 moving average once again.
We have a downtrend on the RSI indicator that supports the upward move with a breakout.
We have a support area at the lower boundary of the channel at 9.53, acting as strong support from which the price can rebound.
Entry price: 9.70
First target: 10.07
Second target: 10.40
Third target: 10.70

TRUMPUSDT – Daily Technical AnalysisTRUMPUSDT – Daily Technical Analysis
The price has reached a key daily support level at $10, showing potential signs of a bullish reversal.
If the support holds, we may see a move toward the resistance area around $14, offering a decent upside opportunity.
In a more bearish scenario, the price could extend its correction to the $9 support zone, which may serve as a stronger foundation for the next upward impulse.
🟢 Key Support Levels: $10 (daily), $9 (secondary support)
🔴 Resistance Zone: $14
Stay tuned for more technical insights and updates.

#TRU/USDT#TRU
The price is moving within a descending channel on the 1-hour frame, adhering well to it, and is heading towards a strong breakout and retest.
We are experiencing a rebound from the lower boundary of the descending channel.
This support is at 0.0375.
We are experiencing a downtrend on the RSI indicator, which is about to break and retest, supporting the upward trend.
We are heading towards stability above the 100 Moving Average.
Entry price: 0.0378
First target: 0.0387
Second target: 0.0395
Third target: 0.0403

#TRUMP/UDT#TRUMP
The price is moving within a descending channel on the 1-hour frame, adhering well to it, and is heading towards a strong breakout and retest.
We are experiencing a rebound from the lower boundary of the descending channel, which is support at 11.10.
We are experiencing a downtrend on the RSI indicator that is about to break and retest, supporting the upward trend.
We are heading towards stability above the 100 Moving Average.
Entry price: 11.22
First target: 11.37
Second target: 11.55
Third target: 11.77

$TRUMP Bounces from Golden Pocket – Rally Incoming?$TRUMP has bounced from a strong support zone around $10.30–$10.50, which lines up with the 0.618 Fib level.
As long as this support holds, price could push toward $11.78 and possibly higher to $13.00+ if momentum builds.
The structure looks healthy, and buyers are stepping in again.
Keep watching, a move toward the upper levels may be starting! 👀
#Trump #ALTSEASON


TRUMP/USD – Watching Key Support at 12.45–12.15 for Potential ReThe TRUMP/USD pair is consolidating near the strong horizontal support zone at 12.45–12.15, aligning with the 61.8% Fibonacci retracement of the previous bullish leg.
🔹 Key Levels & Scenario:
Support zone: 12.45–12.15 – price has repeatedly tested and held this area
Upside targets:
50% retracement at 14.096
78.6% retracement at 15.134
The pair is showing early signs of stabilization, suggesting a potential rebound toward these Fibonacci levels if the support holds.
📉 Invalidation:
A decisive daily close below 12.15 would invalidate the bullish bias and open the door for deeper retracement.
📌 Trading Plan:
Watching for price action signals (candlestick reversal or breakout) above 12.45
Targets: 14.096 and 15.134
SL: Below 12.15 for a conservative risk management approach
This idea focuses on the potential for a short-term reversal in a larger consolidation phase, supported by clear Fibonacci and horizontal confluence.

Official TRUMP Dinner PUMP?Many Altcoins, specially memecoins, in the past few weeks were growing strongly, is OFFICIAL TRUMP being suppressed?
Let's speculate a little bit.
If you were Trump. No, if I were Trump, Master Trump or Alan Trump, and I have this upcoming event on 22-May. Would I want declining prices or a super-pump right at the same time the event is happening?
If I am a very powerful man and know the power of the media, would I want the memecoin that goes by my name to be super-pumping the same night, at the exact same time as the event goes on? Wouldn't this bring that much more attention if prices were to blow up?
What's your take? What do you think will happen?
The chart looks good for TRUMPUSDT, there is no reason why prices shouldn't be going up. Other pairs are similar, many very similar, but many others continued to grow.
Last week and the week before, it was all memecoins in the top performers. This week, somehow, this market behavior was shutdown and we now only have real projects at the top of the list, which is pretty good actually and refreshing.
Overall, these memecoins can cause real harm to the market. The exchanges can fix this by not listing and delisting but that's not the topic today.
TRUMPUSDT looks good, chart-wise, based on TA. It can grow easily and the action is happening within the "bullish zone."
Another one, the biggest candle since March is a bullish candle. And this is also the biggest candle after the All-Time Low. So the bulls have the upper-hand period. So TRUMPUSDT can grow.
But what about the dinner pump?
You think they are waiting and will buy heavily on the day of the event? Maybe a 100% jump?
I am curious as to what your opinion is, and I'll tell you mine... IT IS GOING UP!
Dinner or no dinner...
Thanks a lot for your continued support.
Namaste.

TRUMPUSDT 12H AnalysisTRUMP ~ 12H Analysis
#TRUMP Buy on retest of this support block with short term target of at least 15%++ from here.

Dinner with TRUMP is done, Whats next?So looks like a dinner with Mr Trump made people book profits lOLOLOL, anyways, this is the point of precedence one shall look for.

TRUMPPPPPPPPPPPPPPPPPPPHello friends
Considering the good growth we had, you can see that the price formed a flag and corrected after reaching its ceiling.
Now, with the price correction, there is a good opportunity to buy in stages and with capital management and move towards the specified goals.
*Trade safely with us*

TRUMPUSDT Massive breakout above the Triangle.Official Trump / TRUMPUSDT just crossed above its 1 month Triangle pattern following a May 6th rebound on the 1day MA50.
The upside potential is huge long term but even in the immediate future, it technically targets the 2.0 Fibonacci extension.
Buy and target 25.50.
Follow us, like the idea and leave a comment below!!

$TRUMPTRUMP is currently consolidating above the 25 EMA on the daily timeframe.
As long as the $12 daily support holds, I expect a move toward the marked mid-term targets.
DYOR

Trump/Usdt Plan Trump is trading inside a symmetrical triangle. If the price pumps and breaks out of the triangle, bullish momentum may follow. Otherwise, if the price dumps and breaks down from the triangle, bearish momentum may follow. Wait for a triangle breakout to confirm the next direction. Keep eye on it
TRUMP is Back on the Move! Breakout Trade Setup Inside!!🚀 TRUMP Bull Pennant Breakout – 40% Potential Incoming?! 👀🔥
Hey Traders! If you're all about high-conviction plays and real alpha, smash that 👍 and tap Follow for more setups that actually deliver! 💹💯
TRUMP is breaking out of a symmetrical triangle in the 4H time frame — signaling the potential for a massive upside move! The last time we saw similar consolidation, it exploded with over 40% gains.
📈 Entry: Current Market Price
🎯 Target: $18.70+
🛑 Stop Loss: $12.58
Lev: Use low lev (Max 5x)
📊 Risk/Reward: High-reward setup for breakout traders
🔥 With momentum building and volume picking up, this setup could deliver strong returns if the breakout sustains.
💬 What are your thoughts on this move? Are you trading $TRUMP?
