TRU/USDT Weekly – On the Verge of a Reversal or Breakdown?📌 Overview:
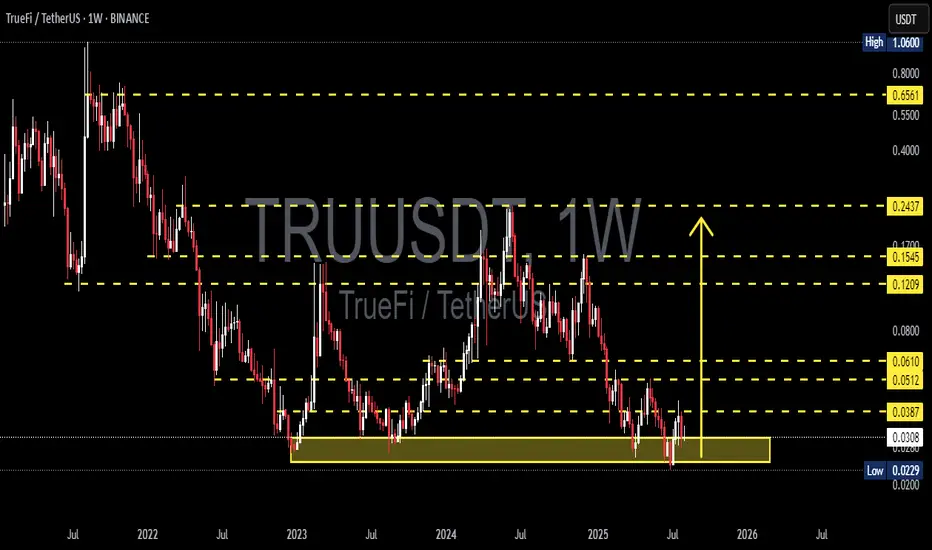
TRU/USDT is currently trading within a key long-term demand zone between $0.0229–$0.0307 — an area that has consistently acted as a strong bounce level since early 2023. Now that this zone is being tested again, the outcome could define the next major move for TrueFi.
---
🔍 Market Structure & Pattern:
The pair has been moving sideways in a year-long accumulation range, hinting at a potential accumulation phase by smart money.
There's a possibility of a triple bottom formation, a classic reversal signal, should price break above resistance with momentum.
Although the overall trend remains bearish, selling pressure is weakening, suggesting a possible trend transition phase.
---
📈 Bullish Scenario (Reversal Potential):
If price holds the support zone and confirms a bullish weekly candle:
Upside Targets:
🔹 $0.0387 (First breakout level)
🔹 $0.0512 – $0.0610 (Previous distribution range)
🔹 $0.1209 – $0.1545 (Mid-term trend shift target)
Potential catalysts: strong breakout volume, improving market sentiment, and weakening BTC dominance.
---
📉 Bearish Scenario (Breakdown Risk):
If price fails to hold above $0.0229 and closes below on the weekly chart:
Price could fall further toward the psychological level around $0.0200 or even lower.
This would confirm a new lower low, continuing the broader bearish trend and possibly entering a capitulation phase.
---
🎯 Key Levels to Watch:
Level Significance
$0.0229 – $0.0307 Major demand zone (historical support)
$0.0387 Initial resistance / bullish trigger
$0.0512 & $0.0610 Previous supply zones
$0.1209 & $0.1545 Mid-term reversal targets
$0.2437 Long-term target if uptrend confirms
---
🔄 Conclusion:
TRU/USDT is at a make-or-break point. Bulls and bears are clashing at this critical support. Will this be the start of a long-awaited reversal, or will we see a deeper breakdown?
The coming weekly candles will be crucial. Smart traders will wait for clear confirmation — not just reaction.
---
🧲 Trading Strategy Ideas:
Conservative Bulls: Wait for a weekly breakout above $0.0387 with volume confirmation.
Aggressive Traders: Consider entry at support with tight stop-loss below $0.0225, aiming for $0.0512 short-term.
Bearish Bias: Short after confirmed weekly close below support.
#TRUUSDT #TrueFi #CryptoReversal #AltcoinAnalysis #SupportZone #TripleBottom #BreakoutSetup #WeeklyChart
Truusdtperp
#TRU/USDT Low Risk vs High Rewards#TRU
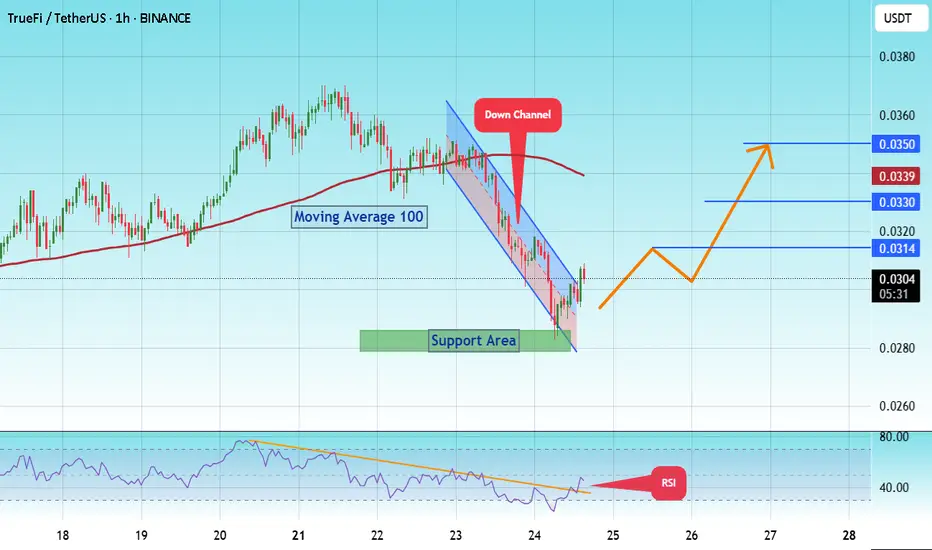
The price is moving within a descending channel on the 1-hour frame and is expected to break and continue upward.
We have a trend to stabilize above the 100 moving average once again.
We have a downtrend on the RSI indicator that supports the upward break.
We have a support area at the lower limit of the channel at 0.0285, acting as strong support from which the price can rebound.
We have a major support area in green that pushed the price upward at 0.0280.
Entry price: 0.0300
First target: 0.0314
Second target: 0.0328
Third target: 0.0350
To manage risk, don't forget stop loss and capital management.
When you reach the first target, save some profits and then change the stop order to an entry order.
For inquiries, please comment.
Thank you.

Truusdt truefi buy setupA clean setup, valid until final tp is not hit. Wick doesn't matter if any news day, closing matters.

TRUUSDT 1W AnalysisTRU ~ 1W Analysis
#TRU This trade is very high risk, this is the lowest support you might consider to start buying back with a short term target of at least 20%+.

#TRU/USDT#TRU
The price is moving within a descending channel on the 1-hour frame, adhering well to it, and is heading towards a strong breakout and retest.
We are experiencing a rebound from the lower boundary of the descending channel.
This support is at 0.0375.
We are experiencing a downtrend on the RSI indicator, which is about to break and retest, supporting the upward trend.
We are heading towards stability above the 100 Moving Average.
Entry price: 0.0378
First target: 0.0387
Second target: 0.0395
Third target: 0.0403

Tru USDT Swing TradeAs much as we doesn't closes below 0.038 first and confirmed tp is 0.060$ . Wait for the entry and start accumulation of true between 0.040-0.035 set tp 0.060$

TRUUSDT 1D Analysis TRU ~ 1D Analysis
#TRU Buy after successfully breaking the $0.052 resistance line with a short-term target of at least 10%+.

TRUUSDT 1WTRU ~ 1W Analysis
#TRU Key support that must be maintained for now. Loss of this support, will suppress lower prices.

TRUUSDT 1WTRU ~ 1W Analysis
#TRU Buy gradually from here if you still have a Conviction on this coin with a short -term target of at least 20%+.

TRUUSDT 1WTRU ~ 1W Analysis
#TRU Support blocks that you might be able to consider to start buying back from here with a short -term target of at least 20%+.

TRUUSDT 1WTRU ~ 1W Analysis
#TRU If you still have Conviction on this coin,. buy gradually on this support block with a minimum target of 20%+

TRUUSDT 1WTRU ~ 1W
#TRU This is a coin from the RWA sector. If you have Conviction on this coin,. Wait until the resistance line of this pattern is successfully broken. after that buy in stages. with a minimum target of 20%+

TRUUSDT Breakout - Strong Momentum Ahead!!BINANCE:TRUUSDT has successfully broken out of resistance after multiple retests of support, signaling a strong bullish trend. Currently trading above the EMA 100, this breakout is backed by impressive volume, indicating solid buying interest. With the technical indicators aligned, we anticipate significant upward movement in the near future.
As always, remember to manage your risk effectively by placing stop-loss orders to protect your position.
BINANCE:TRUUSDT Currently trading at $0.086
Buy level: Above $0.086
Stop loss: Below $0.079
TP1: $0.92
TP2: $0.097
TP3: $0.1
TP4: $0.12
Max Leverage 3x
Follow Our Tradingview Account for More Technical Analysis Updates, | Like, Share and Comment Your thoughts

#TRU/USDT#TRU
The price is moving in an ascending channel on the 4-hour frame and is sticking to it very well
We have a bounce from a major support area in green at 0.0830
We have an uptrend RSI that has been broken upwards which supports the upside
We have a trend to stabilize above the 100 moving average which supports the upside
Entry price 0.0840
First target 0.0953
Second target 0.1022
Third target 0.1103

#TRU/USDT#TRU
The price is moving within a bearish channel pattern on the 12-hour frame, which is a strong retracement pattern and was broken to the upside.
We have a bounce from a major support area in green at 0.0900
We have a tendency to stabilize above the Moving Average 100
We have a downtrend on the RSI indicator that supports the rise and gives greater momentum, and the price is based on it to rise after it was broken upward.
Entry price is 0.1250
The first target is 0.1800
The second target is 0.2100
The third goal is 0.2472

#TRU/USDT#TRU
We have a downtrend on a 4-hour frame, the price is moving within it and adhering to its limits well, and it has just been breached to the upside.
We have a major support area at Saad 0.1200
We have a higher stability moving average of 100
We have a downtrend on the RSI that is about to break higher
Entry price is 0.1490
The first target is 0.1550
The second goal is 0.1700
the third goal is 0.1870

TRU/USDT LOOKING GREAT The TRU/USDT pair appears to be gaining strength in the short term. A breakout has been confirmed on the 1-hour timeframe, indicating a possible bullish momentum. Looking at the 3-day timeframe, TRU's price is breaking through horizontal resistance levels, which could signal a significant upward movement in the coming days.
While the technical indicators suggest a bullish rally, I must emphasize that this is not financial advice. It is essential to conduct your research (DYOR) and consider various factors before making any trading decisions. Keep in mind that the cryptocurrency market can be volatile, and unexpected events may impact price movements.

TrueFi TRU long medium-term trade #20Today our attention was drawn to TrueFi TRU. We think we understand the logic of the behavior of buyers and sellers in this asset.
So, let's try to take a position for a medium-term trade on the following conditions:
Entry: in the range of $0.034-0.0358 (the desired average price is $0.0349)
Stop: $0.0318 (-8.88%)
Take profit: $0.0628 (+80%)
P/L ratio - 9/1
We allocate $5,000 for TRUUSDT trade, because the coin is highly volatile
In the event of a mistake, we will lose $450
If the trade will be a success, we will receive a profit of $4000

📊#TRU 's potential smiley put structure, worth keeping an eye🔥🧠With the end of the rally, we have formed a potential smiley bearish structure in the consolidation process, and if this bearish structure holds, there is a high probability that we will reach the buying area. A healthy pullback makes the next rally more explosive.
Let's see👀
🤜If you like my analysis, please like 💖and share it💬
💕 Follow me so you don't miss out on any signals and analyze 💯

TRUUSDT Breakout Confirmed!TRUUSDT Technical Analysis Update
Buy zone: Below $0.0405
Stop loss: $0.0384
Take Profit 1 : $0.0435
Take Profit 2 : $0.0465
Take Profit 3 : $0.0520
Thanks
Hexa
