TRX flight is not over yet!!Hello trader! Today I have a new idea for you. Like and subscribe to the channel, there is a lot of useful information there.✅
Friends, another coin for your TRX feed, which looks like a continuation of the upward movement.. You can try to act with the current ones with a little good below.
Deal plan:
Entry - 0.10837/0.10103$
Stop - $0.8938
Take - $0.13
Guys, follow risk management, this is, first of all, an altcoin that can show high volatility in the moment!
TRX

Tron TRX price knows how to surprise with its "maneuvers"The TRXUSDT price often moves differently from the rest of the market.
This may be because Justin SUN is behind the project, and he likes to "impose his own game" on the market. He is an interesting character in the crypto industry, you can read various investigations and stories about him in your spare time.
So, the other day, the TRXUSD price hit a strong mirror level of $0.09. Now TRX price is undergoing a correction.
If you believe that Tron's growth trend has not yet reached its culmination and will continue to move in a similar manner to 2020, then buying TRX closer to $0.072 is for you.
However, if the TRXUSDT price consolidates below $0.068, the decline may continue, at least to the range of $0.052-0.055
_____________________
Did you like our analysis? Leave a comment, like, and follow to get more

FTM Speculative Asset Play - DeadCOIN?FTM is one of those coins that is in a pretty uncomfortable place for me, Not much going on in the Fantom Ecosystem and a ton of new competition has sprung up over the past three years, However from a technical standpoint FTM looks incredible right now, Id recommend accumulating at least a small bag in case these targets do come to fruition.
Support Zone : $.2570 - $2670
Major Resistance Zone: $.2960-$.3210
Target 1: $.3863 +31%
Target 2: $.4880 +64%
Target 3: $.6101 +105%
Fantom is a directed acyclic graph (DAG) smart contract platform providing decentralized finance (DeFi) services to developers using its own bespoke consensus algorithm.
Together with its in-house token FTM, Fantom aims to solve problems associated with smart-contract platforms, specifically transaction speed, which developers say they have reduced to under two seconds.
The Fantom Foundation, which oversees the Fantom product offering, was originally created in 2018, with the launch of OPERA, Fantom’s mainnet, coming in December 2019.
Fantom is an open-source decentralized smart contract platform for DApps and digital assets that was created as an alternative to Ethereum. Fantom has the goal of overcoming the limitations of previous generation blockchains and balancing three components: scalability, security and decentralization. The project offers a set of tools to simplify the process of integrating existing DApps, as well as a detailed staking reward system and built-in DeFi instruments.

TRX IF BREAK SUPPORTConsidering the strong growth of currencies yesterday, Yen 7 Shahrivar Tron was not exempted from this growth and was able to show a good reaction to the ceiling of its range and we witnessed the reverse in the same area.
On the price of 0.0777 dollars, which was a very important point in terms of price action, we saw how the price was returned until the price of 0.075 dollars, where we saw the range between these two ranges, and after crossing this range, the first price ceiling of 0.080 dollars and the higher ceiling, i.e. 0.083 dollars We can expect.
If we consider the break from the floor, which is more predictable, we can determine the price of $.0073 for Rios.

Tron ($TRX) Soaring To $0.5Tron (TRX)
TRON is arguably the only one among the old guard of altcoins that continues to show positive dynamics on both the local and global charts. In five months, the asset has surged by 55%, with this growth being quite steady and punctuated by necessary corrections.
As of now, TRX is trading close to the resistance zone of $0.0997-$0.1010. The primary expectation is that the growth will persist, potentially renewing the annual high at the marks of $0.102 and $0.105. Further ascent could also be on the horizon, assuming Bitcoin's price remains steady.
Should Bitcoin undergo a correction, it could similarly affect the TRX trajectory. Under those circumstances, the asset might revisit the support levels around $0.0980, $0.0950-$0.0960, and $0.0935.

TRX/USDT Break the key level area. Rounding Bottom Confirmed!💎 TRX has undeniably made a significant impact on the market with its Rounding Bottom pattern and the successful breakthrough of a key supply zone, signaling a bullish momentum for TRX. However, it's worth noting that TRX has not yet undergone a retesting phase at the demand area, which was previously a supply zone.
💎 Due to this, there's a possibility that TRX will enter a retesting phase at around $0.91 to confirm the continuation of its upward movement. It's conceivable that after a valid retesting phase, we might witness a substantial bounce from the demand area, probability propelling TRX toward our target, the major supply area.
💎 Conversely, a less favorable scenario would materialize if TRX retests the demand area within the range of $0.91 to $0.885 and experiences a breakdown. In this scenario, TRX would transition back to a bearish trend, potentially resulting in a downward movement, with testing areas at $0.717 and even the formidable support area.

TRX is a Beast 🦾Hello TradingView Family / Fellow Traders. This is Richard, also known as theSignalyst.
📊 Unlike many altcoins exhibiting high volatility, TRX has demonstrated steady upward movement throughout the entire year.
This bullish trend is engulfed within the rising broadening wedge pattern outlined in orange, currently approaching the upper boundary marked by the orange trendline, serving as a non-horizontal resistance.
Additionally, the zone between 0.105 and 0.115 presents a robust resistance level.
📈 To maintain long-term control, the bulls must breach the 0.115 resistance.
If successful, a movement toward the subsequent resistance level at 0.14 can be anticipated.
📉 Conversely, as long as TRX trades below 0.115, there is potential for bears to instigate one more correction (confirmation needed on lower timeframes).
In such a scenario, we should be vigilant for trend-following buy setups as TRX approaches the lower boundary of the orange trendline.
📚 Always remember to follow your trading plan regarding entry, risk management, and trade management.
Good luck!
And always remember: All strategies are good if managed properly!
~Rich

TONCOIN - Top 10 Crypto Market Cap PotentialTon Targets - Support and Resistance Zones.
Support Zone: $2.275
Resistance Zone 1: $2.55 - $2.65
Target 1: $2.80
Previous Top Resistance Zone: $3.01 - $3.35
Potential Bull Run Target 1: $4.85
Toncoin (TON) is a layer-1 blockchain that emerged back in 2018 from the creators of the secure messaging app Telegram. The project underwent a transformation after being handed over to the TON Foundation, leading to a name change from "Telegram Open Network" to "The Open Network."
Since 2020, the tech has seen progress thanks to a group of enthusiasts working without commercial interests, forming the TON Foundation. Toncoin, previously called Gram, serves as the native cryptocurrency on the TON network.
Originally, the plan was to integrate TON into a user-friendly app enabling fund transactions for users. Users pay fees and employ TON for transaction validation and payments. The Toncoin network relies on the proof-of-stake (PoS) consensus model to ensure scalability and dependability. As per the project's website, the platform offers swift, transparent, and secure payment services, making transactions cost-effective and eliminating the need for third-party apps.

TRON Bullish ChannelHi, welcome to my analysis.
We know that many crypto perform bearish this year, but not for Tron.
This bullish channel up start from mid Nov 2022 and still perform till now.
If you wanna follow this wave, we have support line at 0.07532 or around channel up support to buy with target at 0.09314 at channel up resistance.
Don't forget to support, if you agree with this analysis.
Happy trading,
May profit be with you.

TRX to $0.10?TRX is trading within the uptrend channel.
which u can see its rally throughout the whole 2023.
$0.080 is the key level for TRX .
must hold.
MACD still favor to the bull.
next resistance $0.10
DYODD

TRON ($TRX) What is Next After The SurgeUnlike the majority of altcoins, TRX began its upward trend even before Bitcoin surpassed its annual high. Currently, TRX is trading at around $0.094, marking the asset's highest price point in the last two years.
Given the ongoing positive dynamics of BTC, a continuation of this growth trend is anticipated. The last time Tron reached these heights was two years ago, rendering the old resistance levels irrelevant. After surpassing the resistance zone of $0.093-$0.094, potential next targets for buyers could be the $0.097 mark and the psychological level of $0.1.
In the event of a correction, the TRX price could fall to $0.091 and enter the buyer's zone between $0.0890-$0.0905. Below that, the support level at $0.0885 could also be tested, without posing a threat to the prevailing uptrend.

TRXUSDT Limit Long is about to TriggerTRXUSDT is clearly one of the strongest coins in the recent months. It has established a clear long-term uptrend, where the resistance has flipped into the support.
We have placed a limit order to go long on the Tron, and we expect quite a strong uptrend to start this week.

Tron clear barrel scraping!!Trx has literally been moving up now for a year! We're days away & it's amazing the consistency of the bottom of Tron. We have seen this with other tokens also and for me it's clearly obvious we're at the lowest point in crypto currently.
This is definitely leading up to the bullrun. The buy walls are in place preventing the price from falling, and the potential for upside is extremely lucrative right now!
🚀🚀🚀🚀🚀

the dock left a signal for the continuation of the trend with a One of them is the opportunity to perform the work with high accuracy in the near future. The last impulse of 70% is only the first investment in the swing of a new trend and in the near future we can expect a retest of intermediate resistance at 0.0210-225 from which there will be an opportunity to move to the main target at 0.025-31. A move left without a retest on the day is a pretty strong signal for the continuation of the trend. It should be borne in mind that longer-term goals are on the 0.05 test and with sufficient volatility we can see a breakdown immediately to this level. It's just that until the cue ball has scored 35k, the 0.025-31 range for docking is a large volume with long-distance trading before the contract extension. With a negative scenario and a general market pullback at the end of the month, there is a possibility of a short-term retest of support at 0.0125 with the trend continuing in the new month.
In combination with a finger-sucked dock, this system provides uft vib pros perl pnt cvp dock wtc drep vite epx fio oax, which I mainly use for work.

ooki is ready to continue the trend in the near futureAfter a wave of growth of 100%, there is a high probability that the ooki trend will continue in the near future. After the momentum of last week, the current weekly has drawn a shadow and there is a payback for the reversal of the weekly candle into a bullish one. In an optimistic scenario, there is a fairly high probability of a breakdown tomorrow. In this case, the goal will be to move past the previous week with the opening of a new week above 0.0035. If there is insufficient volatility, an attempt to move will be formed by a slow trend. On average, the goal is an attempt to consolidate above the trend line formed by hayami. Basically, the target range is 0.0050-75 with further attempts to reach 0.010-0.015.
Ooki remains an option with top growth potential along with uft vib pros perl pnt cvp dock wtc drep vite epx fio oax.

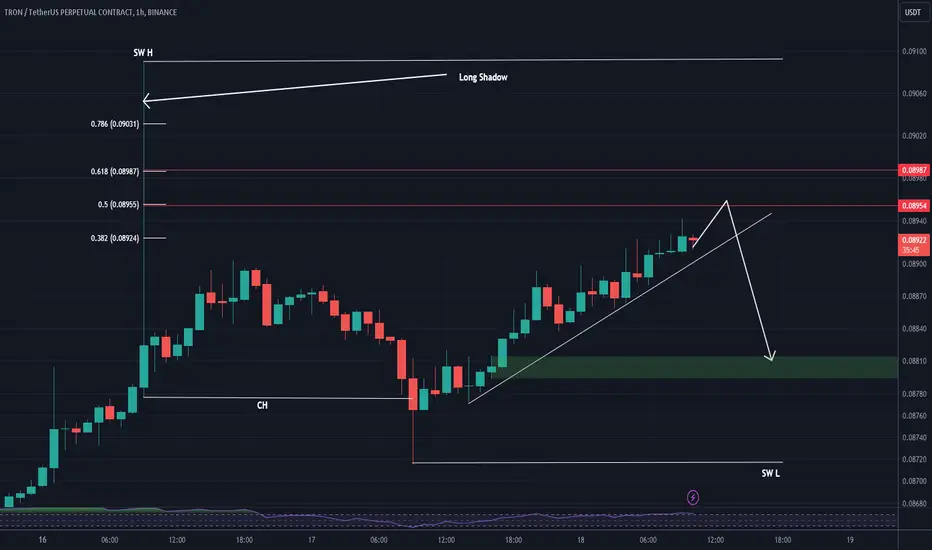
TRX can have a crash (has an educational point)TRX can have a crash
There is an educational tip here, pay close attention:
Educational tip: When we have long shoadow, the price tends to fill 50-60% of these shodows and then continue in the opposite direction. If a CH is in the opposite direction of the long shadow, we have more confirmation.
If more than 70% of the log is filled, it is possible to pass the log.
Above 0.07679: Expected to create a new upward waveHello?
Hello traders!
If you "Follow" us, you can always get new information quickly.
Please also click “Boost”.
Have a good day.
-------------------------------------
Since we operate a stablecoin based on TRX, a drop in price can be a very dangerous warning.
Accordingly, it is one of the coins (tokens) that must be certain about how profits will be realized during trading.
In that sense, if it falls below 0.05378, it is necessary to check the movement of the stable coin (USDD).
(TRXUSDT chart)
If the price remains above 0.07679, it is expected to create a new wave.
(1W chart)
It is necessary to check whether the price can be maintained above 0.07725 and rise above 0.11964.
(1D chart)
Since it has fallen from a rising channel, I think it is highly likely that the current trend will continue until a new trend is created.
Since the StochRSI indicator is currently in the oversold zone, it is necessary to check at which point or zone it receives support or resistance when it leaves the oversold zone.
Accordingly, it is necessary to check whether it can quickly rise above 0.08867 or be supported around 0.08177.
-------------------------------------------------- -------------------------------------------
** All explanations are for reference only and do not guarantee profit or loss in investment.
** Trading volume is displayed as a candle body based on 10EMA.
How to display (in order from darkest to darkest)
More than 3 times the trading volume of 10EMA > 2.5 times > 2.0 times > 1.25 times > Trading volume below 10EMA
** Even if you know other people’s know-how, it takes a considerable amount of time to make it your own.
** This chart was created using my know-how.
---------------------------------

2$ TRX ?Logarithmic chart shows tron in a massive triangle which is holding for now , if the market doesn’t fall bad and keep how its going and if triangle doesn’t break down then i think 2$ for trx is an appropriate target at the end of 2024 and peak cycle , it showed a good strength and also having a greatest daily usage by user , china entering and legalisation the crypto market will also be a good point for tron .

TRX going to lose the trend lineTRX going to lose the trend line after breaking the ylw zone we starting downtrend

🟩 TRXUSD - best crypto I can findThis is the best crypto coin that I can find.
VOLUME
On the bottom you are seeing only the above average volume weeks. We have the famous Wall of Blue (for the IBD students) and a classic VDU-voodoo (Volume Dry Up, for the Gilmo Students) on the right.
PATTERN
The Pattern printed is a typical VCP (for the Minervini students)
BASE CHARACTERISTICS
We have very strong positive week closes on the bottom of each contraction. Every week has closed +40% of its close range.
RELATIVE STRENGTH
The RS compared to ETH or BTC is off the chart!
If I am to buy any crypto this one looks like a real high probability setup

TRX/USDT bullish momentum?? 👀 🚀 Tron Today Analysis💎Paradisers, gear up for a fantastic opportunity with TRXUSDT! We're currently observing it testing resistance levels and setting the stage for a bullish ascent👀
💎Right now, we're looking at two potential scenarios. First, if the price of TRX successfully breaches the resistance at $0.08459, expect a bullish surge. On the other hand, if selling pressure remains strong and the price fails to break through the resistance, we anticipate a retest of the support level at $0.08111, where a bullish continuation could occur.
💎Additionally, if the support level at $0.08111 is broken, consider planning a short entry in #Tron. In this case, your take-profit should be set at the next support level.
Keep your charts updated and Stay one step ahead of the market 🌴

TRX CAN FALL VERY SOON (1D)The structure of TRX in the daily and weekly time frame is the same as the previous analysis. The correction has started from the place where I have marked the red arrow. It means a big diametric!
But the trx went above the red box of the previous analysis and made a stop hunt.
I think we are at the end of wave F and we will have a fall for wave G.
In the red box, we are looking for a downward trigger to enter the sell/short position.
The green area is relatively strong support.
I specified the invalidation level, closing a daily candle above this level will violate the analysis
For risk management, please don't forget stop loss and capital management
When we reach the first target, save some profit and then change the stop to entry
Comment if you have any questions
Thank You

TRXUSD - Similar Gaussian Breaks Price has broken above the Gaussian Chanel on the Weekly timeframe
This is similar to a previous event which led to a large bull run
Will it repeat?
