TRX


Corn Catches UptrendAs far as I have observed, investors are hopeful and continue to invest in corn because the total supply of this corn is very low and it increases by reacting very quickly to the investment.!

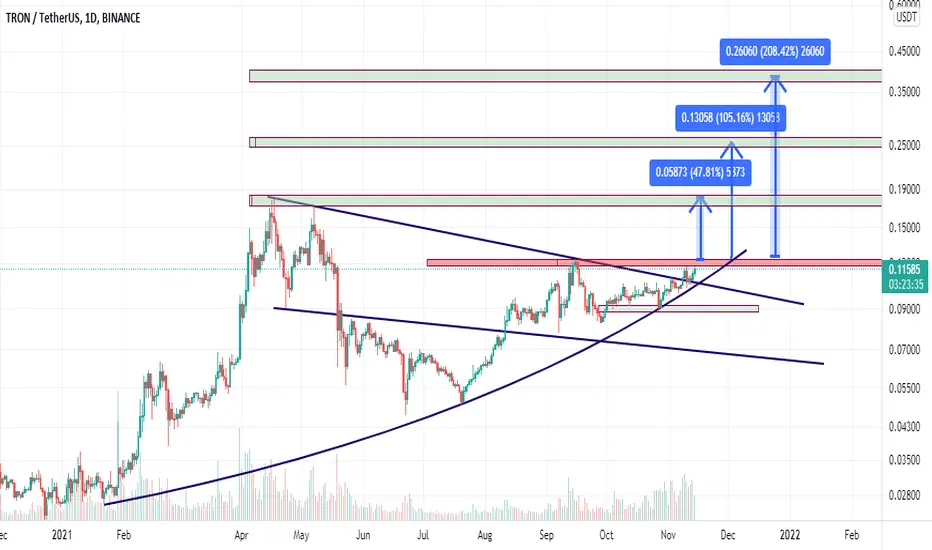
TRXIn the last two months, it has always been traded with a good volume
If the heavy resistance of 0.123 fails, it can easily reach the first target
The range of medium-term targets is indicated in the chart
Tron rabbit digital currency on turtle skin TRX
For TRON digital currency, the heart rate ceiling is not far from the mind. Why?
Because the volume is greatly increasing
It is the most backward digital currency
It is breaking the trend line
And Ichimoku Chico Span moves on the camouflage cloud and waits for the camouflage to break
And another beautiful reason that you will see on my chart

trx/usdt : What's next ?Hi friends .
as we see in the chart tron broke the daily trendline and retest it .
the 50 / 14 ema show the strength of bulls . for confirmation we need 4h candle close above 0.12$ to entry long .
☺☺
our target will be 0.15$ . after the breakout .
please support me with like and follow me for more ideas . ☺☺

TRX SHORT SCALPA double top in the m30 chart and also a break in the ichimoku cloud on the m15 has confirmed a short scalp for trxusdt. Also note the trend line for extra support. Let's see how this plays out. NOT A FINANCIAL ADVICE!


Tron vs Tether (TRXUSDT) Chart Analysis (130% Mapped)We looked at OMUSDT (MANTRA DAO) and here we have a very similar chart.
Tron (TRXUSDT) we consider bullish since its price is trading above EMA10 and all other EMAs.
We can see bullish consolidation taking place as we have prices creeping higher but slowly.
We have higher lows showing up continually since June.
The MACD is safely above zero and the RSI really strong at 60+.
Just as we TRXBTC, TRXUSDT is bullish with good potential for a strong bullish jump.
The main support is set at $0.100 followed by MA200/EMA300.
The next target (resistance/up) is marked on the chart light green (130%+).
That's all.
Thank you for reading.
Namaste.

Breakout on TRX with 3.3 RR and $0.16 targetLooks like a nice moment to enter LONG for me
- breakout
- bounced from 200MA on daily
- 3.3 RR
similar to what we can see on XRP...
Do you agree? Or am I missing something?

TRON Moving (D) Above EMA50 (210% Mapped)TRXBTC (Tron) peaked on May earlier this year after recovering from a low and is getting ready for new bullish action.
After the May peak support was hit in late July just below the 0.618 Fib. retracement level.
(This is marked light blue on the chart).
Afterward, all price action has remained above this level making it a strong/confirmed support.
Now that we are seeing prices move above EMA50 (0.00000173), we can expect additional growth.
The support/stop-loss is set at around 149 satoshis; bullish above this level.
The targets can vary but we have up to 210% potential for growth.
Many pairs are hitting new highs compared to March/April/May.
TRXBTC (Tron) remaining strong after the correction on a higher low can lead to a higher high.
Additional details on the chart.
Thank you for reading.
Namaste.

Tron TRC20 May get a sharp down waveDear Crypto traders, I'm have been sharing a good entries on crypto trades lately. I hope you can understand this technical analysis if you know about Dow theory.

a dreamy expanded trianglefinally I find a dreamy TA on Tron today and I'm extremely bullish on TRX now. could it explode this week?
cypher and shark targetscypher or shark harmonic pattern:
AB=0.38 XA
BC=1.13 AB
tp1=1.6 BC=$0.11 *reached*
tp2=0.78 XA=$0.147 *reached*
tp3=2 BC=0.88 XA=$0.2 cypher reversal
tp4=2.24 BC=$0.3 shark reversal
tp5=1.13 XA=$0.46 shark reversal

TRX/USDT LongTron at a nice place after big consolidation is pure bullish reacting to lower band of daily pitchfork and breakout form big trend line also per btc looks good tron will be at much higher price but it moves slow .

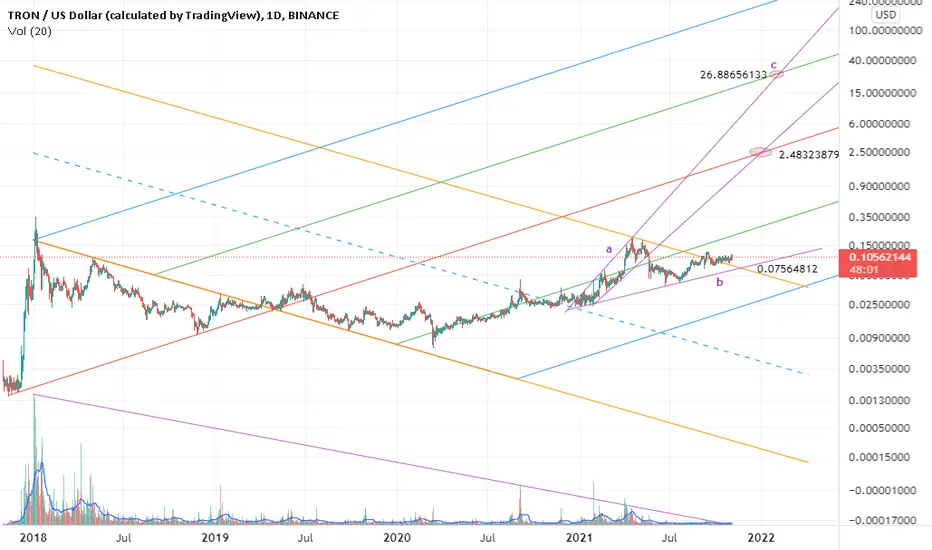
I fall in love with technical of Tron recentlyFibo levels:
1.6 BC=$0.126
2 BC=$0.357
2.24 BC=$0.689
2.6 BC=$1.93
3.6 BC=$29.7

trxhello my frinds, I analysis simply just with trend analysis ,tron in the ascending channel :)
support us for better signals

TRXUSD Entry 0.1060 Take Profit 0.1230TRXUSD (Tron)
Diagonal Trend Line
Horizontal Support Resistance Line
EMA 10
EMA 20

TRX USD Green VS RedI'm publishing this chart because my account only allows me to save a few charts...

TRX longWHo missed the entry here....there is possibility that it may come around white box.......... ;);););)
then i guess there is no come back

TRXUSD channel, fib, gann analyse.. Long Term!!!#TRXUSDT channel, fibonacci, gann analysis, Long Term!!! I am not a financial and trading advisor, I am only drawing my dreams..
#TRX #TRON #TRXUSD #BTC

Tron TRXUSD - Next wave +1000%, Elliott wave + Wedge!- On the chart we can see an incomplete Impulse Elliott Wawe (5th wave).
- Rounding bottom or cup and handle is also printing on the chart.
- Volume is very bullish and also RSI is prepared for another pump!
- Target is 1.618 fib trend-based extension + top of the ascending wedge + 5th elliott wave.
- For expected duration of the trade, probability, stop loss, profit target, entry price and risk to reward ratio ( RRR ) - please check my signature below ↓
- Huge bullish volume is also one of the positive signs!
- If you want to see more of these ideas, hit "Like" & "Follow"!

short time TRX Process *update*The recommendation is not for buying and selling and is for personal analysis only :)
