Trxbreakout

Who is 100x SHORT bitfinex.... Im waiting for 1-2waiting on 1-2 than breach of 1 targeting low..... the rest is ur job LETS GOOOO BABY BEARS RULE...… TIME TO EAT UP SOME BULLS.... CAPITULATION


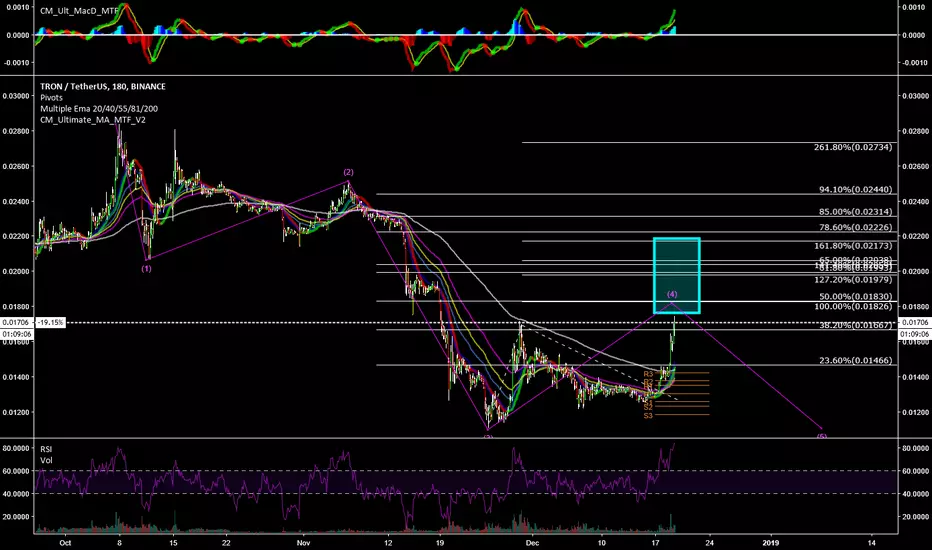
after looking at midterm i am BEARISH BE SAFEI believe there is a possibility of 5 more waves down but will be scalping intraday to play it safe fucking rsi giving this away


Either way short term bearish.... good place to take 50 percent this is the bull count
id be watching the break of the 60 rsi to sell and look at the .236 .38 or .5 for the A wave.... B wave id only dead cat .236 than C wave either double bottom or golden pocket

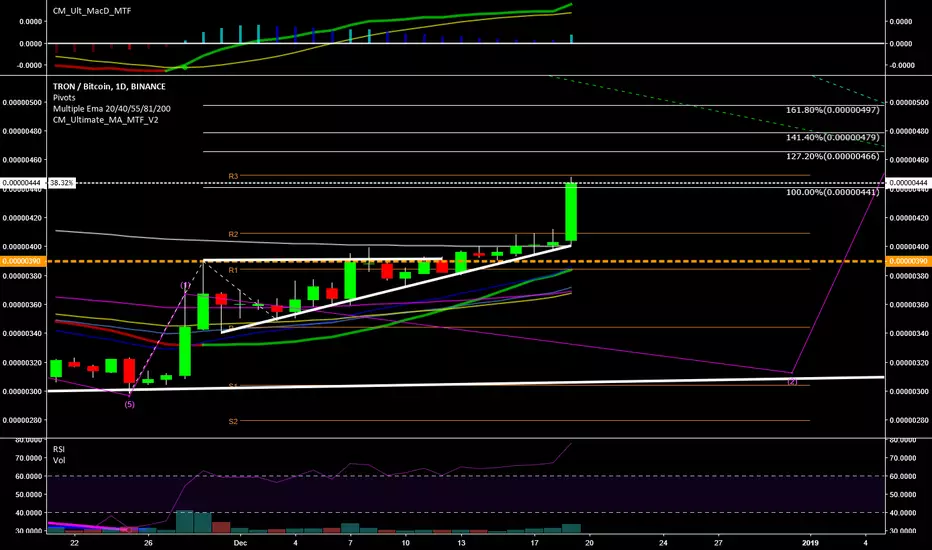
To put this in a little perspectiveI cloned the 1st 5 wave move and moved it over..... look how far we are in comparison almost doubling and we still have an extended 5th to go. 3rd wave of 1st wave hit exact 1 for 1 and struggling to break 440. The shock is where is this 3rd wave going to end if this is the 1st uncomplete lol..... HOLY SHIT
Christmas waveDo you believe Crypto is dying or alive and well....all I see is more adoption and more transactions...…. buy into strength don't be mistaken
Tron (TRX) Tron looks like very obvious accumulation.Everything is on the chart. It cannot be more clear. I even suspect there some sort of painting going on where they intentionally make the chart look like this because it is so close to Wyckoff Accumulation Schematic #2.
Do you not get chills when looking at this?
Tron is one of those coins that has a very bad reputation, because of the pump and dump movement that made it similar to Verge. However, if I wanted to bet on an altcoin surviving the bear market other than Bitcoin, I would bet on Tron. You may insult Tron because of its "shit coin" reputation, but what other coin sold coins for 2 billion during the peak like Tron did? They have cash, and they are going to survive, unlike some other obvious targets I could name.
There may be bias here, but this looks like a better buy than some of the other coins out there with very dead looking charts.
Lots of people already left crypto, but now is the time to be buying some to hold for the long term. I expect most of my holdings to go to zero, but a few may run pretty nicely. I think Tron has one of the most bullish charts despite the bull market. I don't know if Tron will be here after 3 years, but I am betting it on having another cycle.
This is just a longer term buy. I don't think you should buy at these levels since you could get in cheaper.


My Mid 2019 Prediction for TRX TRONIve been a long term Investor in Tron really since I did research on the company. Road the 1st major spike to 30 cents...…. Where are we now..... Full complete perfect ABC Correction. I believe we are already impulsive and we will explode with BTC. I will be BUYING as much as I can over next couple months.... All the way up really. Will update once we break. We have hit 395 to 400 range 13 to 15 times failing and breaking off... Over past month or 2 we have hit the line 3 times. We are over it right now and over most timeframes looking good. Im more of a longterm holder now and will scalp once we hit on this.

TRON: TRX Short Trading Setup !!iF Broke 270 Support Level then We Can Short TRON .
Share Your Opinion in Comments.
if You Satisfied With My idea Then Dont Forgot To Hit Like.
Warning- I m Not a Financial Advisor this idea Only For Educational Purpose Only.
Thank You !!


TRXBTC Latest Technical Analysis You can See TRXBTC Chart in 1 Day Time-frame.
TRXBTC Follow Bear Flag chart pattern break down .
I have Mention Support and resistance levels on Chart
Note: This is only for Educational Purpose this is not an Investment advice.
Please support the setup with your likes, comments and by following on Trading View.
Thanks
Adil Khan


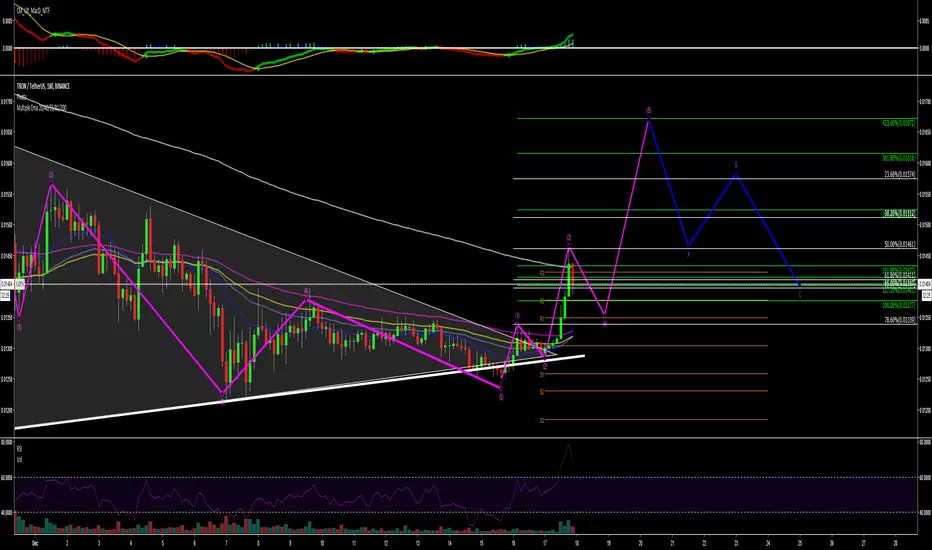
TRX to the MOONLooking at the TRX/BTC pair does not get you very far. Tough to read the big picture and especially count the Elliot Waves. The TRX/USD pair paints a much clearer picture. I want to see a strong break out of this ascending triangle and after we see that, I hope to never see the 2018 lows again. *Falling Wedge is only visible on the log scale but shows the bullish case clearer*

interesting formation on TRX/TRONCup & Handle could be in play.
Buy Green
Sell Red
//
it's mainly for swing trading, i use the 3 day / 15 day / monthly charts with it and it works perfectly,
//
it works good for stocks and cryptocurrency.
//
you will use heiken ashi chart style and turn on the EMA DOTS indicator.
once the indicator is on you will hide the heiken ashi so you only see the dots.
//
when a green dot -7.44% -7.44% appears you buy, if a green dot -7.44% -7.44% appears after that green dot -7.44% -7.44% you hold your investment.
if a red dot appears you sell your position. easy as that.
//
the standard dots setting will be set to 10 - use this for any chart above 3 days
change the dots setting to 6 for 3day charts and below
//
shorter time frames will be choppy.
//
larger time frames will be smooth.
//
*Daytrading smaller timeframes is possible but not recommended.

Trade TRON with 1 indicatorBuy Green
Sell Red
//
it's mainly for swing trading, i use the 3 day / 15 day / monthly charts with it and it works perfectly,
//
it works good for stocks and cryptocurrency.
//
you will use heiken ashi chart style and turn on the EMA DOTS indicator.
once the indicator is on you will hide the heiken ashi so you only see the dots.
//
when a green dot -7.44% appears you buy, if a green dot -7.44% appears after that green dot -7.44% you hold your investment.
if a red dot appears you sell your position. easy as that.
//
the standard dots setting will be set to 10 - use this for any chart above 3 days
change the dots setting to 6 for 3day charts and below
//
shorter time frames will be choppy.
//
larger time frames will be smooth.
//
*Daytrading smaller timeframes is possible but not recommended.

TRX TRON Long Position !!TRX Very Nice Following Trend Lines and support Resistance Next Ride may be Start from 350 Satoshi around
Entry 350
Target 380, 410 , 440
Stop Loss 320
What Will be Next Move , i hope that Price can fly from the 350 Satoshi.
Share Your Opinion in Comment Box.
if You Satisfied With My idea Then Dont Forgot To Hit Like .
Warning- I m Not a Financial Advisor this idea Only For Educational Purpose Only.
ThankYou....................!!

TRX TRON - BUY SignalTRON reaches 1 million daily transactions! Hoping for some free press ;)
- Target 1: ~384 satoshi
- Target 2: ~409 satoshi
Higher targets are also labeled...
- Stop @ ~359 satoshi
- MACD is looking interesting...
- Hoping this market shows some upward momentum
Watching this for the next couple of days - week!

TRXUSD - BUY COMING UPTRXUSD IS IN A GOOD PLACE I BELIEVE
THIS IS GEARING UP FOR A BIG PUSH UP
JOIN IN
FOLLOW, COMMENT AND LIKE
