Tron TRXBTC - Falling wedge + Impulse Elliott Wave- Impulse Elliott Wave completed on the weekly chart
- Due to rules, we should expect at least an ABC correction to the upside
- Double bottom pattern on RSI indicator
- Tron can start pump anytime soon as the price is currently undervalued
If you want more of these ideas, hit the like button and follow me, so you don't miss any update!
Also, check my signature down below ↓
TRXBTC

Tron TRXUSD - ATH SOON, Falling Wedge + Triangle- Tron is breaking out of the falling wedge on the weekly chart
- Wait for the symmetrical triangle breakout to enter a long position
- Wave 1 and 2 seem to be completed, now I am expecting huge 3rd impulse wave to the upside
- 0.21 USD is an ALL TIME HIGH resistance
- Check my analysis on TRXBTC pair in related section below
If you want to see more of these ideas, hit the like button and follow me, so you don't miss any update!
Also, check my signature down below ↓

Tron (TRX) Never Ending Bear Cycle (3+ Years) (1760%+ Potential)Tron (TRXBTC) has been in a bear market for the past 3 years... Amazing, in a bad way.
But, is it over?
Recently TRXBTC hit 72 satoshis as a new low, this is the same level that was hit as a high when this pair was introduced to Binance back in October 2017.
This is not the best of signals... But this might be it.
The RSI is ultra-low which at this point can be called "oversold"...
While prices have been dropping for years we have strong bullish divergence building up.
This bullish divergence is also present with the MACD.
When TRXBTC revives and changes course, you can expect a bull market that will last multiple years...
The market moves cycles up and down...
It's been down...
Soon, we will prices moving up.
Thanks a lot for your support.
Namaste.

TRXBTC - Long Now Or Never!TRXBTC is clearly on a reversal point. The bounce from here with ETH breakout vs BTC will only fuel things up.
Entry: 94 sats
Target 1: 150 sats
Target 2: 300 sats
Stop Loss: Hell no!

LONG TRX, inverted head and shoulders hidden bullish divergenceAs we can see, from 21dec to 3rd Jan there was a lower low, however volume is increasing. This is a strong bullish divergence. This pattern is followed up with an inverted head and shoulders with nice volume pattern confirmations, as there is a declining volume on the way down on the left shoulder, and increasing volume on the way up, with the same applying for the head as we see a declining volume on the way down and increasing volume on the way up for the head, and the same for the right shoulder. The slight hidden bullish divergence with higher lows but lower volume indicates that no one wants to sell anymore at such prices. The neckline resistance is expected to break, and we should reclaim at least the 200ma in the coming days.


💡 TRX : Buy TradeIn this altseason, every coin is rapidly pumping bt trx was not performing, finally TRX started moving and breaking upside after long accumulation.
Easily it will reach targets.


TRON against BTC 2021another chart TRX against BTC
Rank #20
Coin
TRON Price (TRX)
$0.03116
5.04%
0.0000008562 BTC
0.00002518 ETH

TRON 2021 who that buying the STEEMITTRON is quite dumped for the time being.
but if u look recently on steemit, u will see that
TRX is already integrated on its platfrom.
look like compromising.
after the btc bear run, steemit is completely like a ghost town.
let's see how tron can go and bring steemit up again.
Rank #20
Coin
On 101,596 watchlists
TRON Price (TRX)
$0.03116
5.04%
0.0000008562 BTC
0.00002518 ETH

TRXUSDT - Symmetrical triangle TRXUSDT is consolidating in a symmetrical triangle pattern.
Breakout is imminent.
Bullish ⬆️ - breakout above the symmetrical triangle's inclined resistance.
Bearish ⬇️ - breakdown below the symmetrical triangle's inclined support.
Possible price actions and targets are indicated by the arrows on the chart.

TRX - TRX USDTENTRY - STL - TP on picture
TP of me , and TP of you , i don't know
" High risk scaling consider when entering orders "

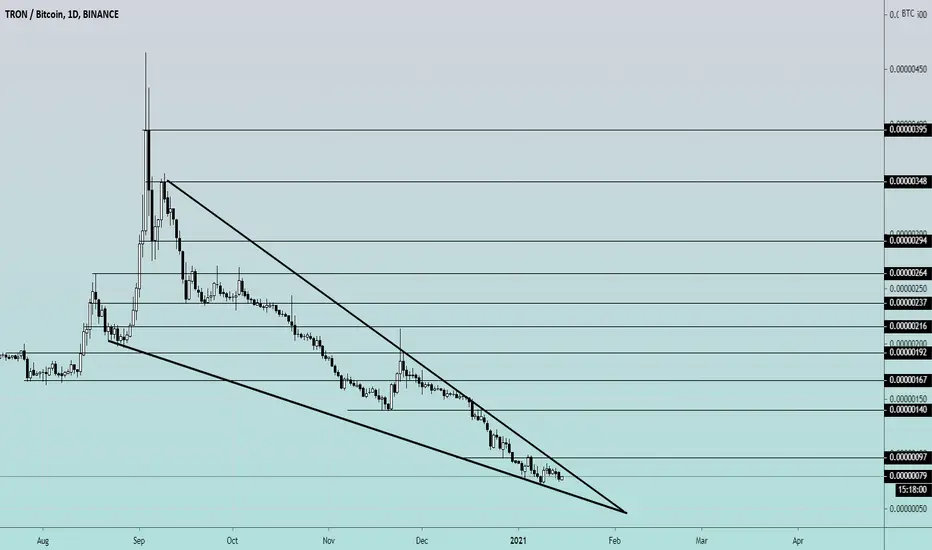
#TRX Pennant pattern, Breakout Will be Huge Long term TradeTRX forming pennant pattern in BTC pair. This is a Mid-term trade and after the breakout, we see a good rally in TRX. IOST has the same pattern and we all see how it skyrockets. TRX will do the same. 100 is the major resistance zone and we see some profit-taking there. This is a mid-term trade and all targets can be achieved. Don't miss this one.
Buy Zone: 77-79 (Add more in Dips)
Target: 88-97-109-125-140-160-175-196-216-235-260-295-345-395
Altcoins possible trend reversalWith a lot of altcoins reaching new ATLs every month, we now might be able to look for a bottom. Steem is giving us a good example of RSI and MACD bullish divergence which is also vidible on 1D timeframe. Short term the price should reach at least top of the falling channel, but it also could signal trend reversal and possible bullrun, and not only for Steem but also for a bunch of other markets.
Similiar patterns are visible on 4H and 1D timeframes for XEM, BAT, DGB, ENJ, XTZ, TRX or WAXP.
So I guess it's a good moment to put a few more coins to your watchlist.

TRX Set for takeoff Weekly 50 MA/100MA Cross. 3 recent high volume pumps are likely whale accumulation. Massive RSI Divergence on the weekly. I am Long to $.10 zone.

Safest time to buy trxHello guys, there is bullish divergence on chart, last time it happened trx went to 60% up, right now target is 135 sat, trx has also touched the price of first time it got listed on binance at 72 sat.
stop loss: 71 sat

trade ideathe bottom looks like its in, just like the others altcoins how pumped last days, its time for justin's sun shitcoin to move and made us some profits


TRXUSDT - Possible price actions TRXUSDT is testing the descending triangle inclined resistance.
Bullish ⬆️ - breakout above the descending triangle inclined resistance.
Bearish ⬇️ - breakdown below the minor ascending trendline support.
Possible price actions are indicated on the chart.


TRX/USDT No Way HomePlease, feel free to share with me your idea and subcribe for more crypto prediction!
