$TRX/#BTC [#TRON]: Resistance_Breakout◳◱ A Resistance Breakout has been identified on the $TRX / $BTC chart. The price has broken above a key resistance level, indicating a potential bullish trend. The next resistance key levels are located at 0.0000031 | 0.00000331 | 0.00000369, and the major support zones can be found at 0.00000272 | 0.00000255 | 0.00000217. Consider entering at the current price zone of 0.00000297 and targeting higher levels.
◰◲ General info :
▣ Name: TRON
▣ Rank: 17
▣ Category/Sector: Infrastructure - Smart Contract Platforms
▣ Overview: TRON is a multi-purpose smart contract platform that enables the creation and deployment of decentralized applications (dApps). It features a delegated Proof-of-Stake (DPoS) consensus mechanism, a system that offers an increase in performance while maintaining true decentralization and censorship resistance.
TRON is arguably most famous for its low cost ability to make transactions in comparison to other layer-1 solutions such as Ethereum, though still lags behind in developer adoption to be considered a serious rival yet.
◰◲ Technical Metrics :
▣ Mrkt Price: 0.00000297 ₿
▣ 24HVol: 43.464 ₿
▣ 24H Chng: 0.338%
▣ 7-Days Chng: -1.60%
▣ 1-Month Chng: 8.81%
▣ 3-Months Chng: 30.80%
◲◰ Pivot Points - Levels :
◥ Resistance: 0.0000031 | 0.00000331 | 0.00000369
◢ Support: 0.00000272 | 0.00000255 | 0.00000217
◱◳ Indicators recommendation :
▣ Oscillators: NEUTRAL
▣ Moving Averages: STRONG_BUY
◰◲ Technical Indicators Summary : BUY
◲◰ Sharpe Ratios :
▣ Last 30D: 2.48
▣ Last 90D: 2.59
▣ Last 1-Y: 0.49
▣ Last 3-Y: 1.00
◲◰ Volatility :
▣ Last 30D: 0.51
▣ Last 90D: 0.43
▣ Last 1-Y: 0.67
▣ Last 3-Y: 1.01
◳◰ Market Sentiment Index :
▣ News sentiment score is 0.57 - Bullish
▣ Twitter sentiment score is 0.49 - Bearish
▣ Reddit sentiment score is 0.64 - Bullish
▣ In-depth TRXBTC technical analysis on Tradingview TA page
▣ What do you think of this analysis? Share your insights and let's discuss in the comments below. Your like, follow and support would be greatly appreciated!
◲ Disclaimer
Please note that the information and publications provided are for informational purposes only and should not be construed as financial, investment, trading, or any other type of advice or recommendation. We encourage you to conduct your own research and consult with a qualified professional before making any financial decisions. The use of the information provided is solely at your own risk.
▣ Welcome to the home of charting big: TradingView
Benefit from a ton of financial analysis features, instruments and data. Have a look around, and if you do choose to go with an upgraded plan, you'll get up to $30.
Discover it here - affiliate link -
TRXBTC

TRX/BTC Main Trend. Linear 1 week. Rhombus 250% The main trend. Breakout. Linear chart 1 week, to show the trend more clearly without market noise. Rhombus (diamond) 250%. Breakdown of the price and fixation above the resistance of the main trend (downtrend channel), as well as the aggregate of the diamond resistance edge.
Remember, 5 05 2022 starts USDD possible prepared "stream of positive news" to accompany this reversal of the trend.
This is what the main trend (long-term) looks like on the candlestick chart on the same 1 week timeframe
Secondary trend. Rhombus zone (reversal pattern) on 3 day timeframe
Local trend. This trading situation breakdown and exit from the local accumulation channel.

TRXUSDT - Good opportunity
TRXUSDT :
It seems that the price will move up from this area.
Of course
After crossing 0.65157
You can place a stop-buy and place a stop loss below the red downtrend.
Or wait for the confirmation.

TRXUSDT Symmetric Triangle Breakout!TRXUSDT Technical analysis update
Buy zone: Below $0.071
Stop loss : $0.062
Take Profit 1 : $0.078
Take Profit 2 : $0.090
Take Profit 3 : $0.105
Take Profit 4 : $0.128
Swing trade setup
Thanks
Hexa

TRX triangle breakoutPlease 1st of all click the boost 🚀 button if you want me to post more ideas and follow me to support my work! It's absolutely for free.
Tron broke up this triangle📐 and now backtested it's upper edge. I think there is chance for run to 0.06905 and even lower. Buying here makes sense to me.
ENTRY : @ 0.06270
STOPLOSS (SL) : local high @ 0.06093
TARGET (TP) : height of the triangle projected from midpoint of the local range @ 0.06905
REWARD RISK RATIO (RRR) : 3.3
INVALIDATION : when SL level hit
Check my other stuff in related ideas.
Please boost🚀, comment🗣️, follow me✒️, enjoy📺!
⚠️Disclaimer: I'm not financial advisor. This is not a financial advice. Do your own due dilingence.

TRX inverted H&SIn the beginning of this year Tron broke up the major downtrendline☝️. Then after this👇 sucessful call...
... TRX formed Inverted Head and Shoulders 🤷 on the daily timeframe and triggered the pattern by breaking the neckline up (zoom in to see the details). Price then fell back down below the neckline and recently broke up once again. I think there is chance for run to 0.08555 and even higher. The yellow uptrendlines could act as a guide.
INVALIDATION (SL) : Right Shoulder @ 0.05879
TARGET (TP) : Inverted H&S target projection @ 0.08555
Check my other stuff in related ideas.
Please boost🚀, comment🗣️, follow me✒️, enjoy📺!
⚠️Disclaimer: I'm not financial advisor. This is not a financial advice. Do your own due dilingence.

$TRX/#BTC [#TRON]: Resistance_Breakout_ConfirmationWe've detected a Resistance Breakout and Confirmation on the $TRX / $BTC chart. The price has broken above a key resistance level and has been confirmed by a strong candle, indicating a potential bullish trend. The next resistance key levels are at 0.00000309 | 0.00000325 | 0.00000358 and the major support zones are respectively at 0.00000276 | 0.00000259 | 0.00000226. We may consider entering a trade at the current price zone at 0.00000304 and targetting higher levels.
Technical Metrics :
Current price: 0.00000304
24H Volume: 128.1084 Ƀ
24H Price change: 3.401%
- Pivot Points - Levels :
Resistance: 0.00000309 | 0.00000325 | 0.00000358
Support: 0.00000276 | 0.00000259 | 0.00000226
Indicators recommandation :
Oscillators: SELL
Moving Averages: STRONG_BUY
Technical Indicators Summary : BUY
- In-depth TRXBTC technical analysis on > Tradingview TA page
What do you think of this analysis? Share your insights and let's discuss in the comments below. Your like, follow and support would be greatly appreciated!
Welcome to the home of charting big: TradingView
Benefit from a ton of financial analysis features, instruments and data. Have a look around, and if you do choose to go with an upgraded plan, you'll get up to $30.
Discover it here

Tron's price volatility range is expected at a level of $0.060For the current week, we can expect the trend to be in the range for the current week, as long as we do not have a strong return below the $0.060 level. But if the selling pressure increases, Tron's price decline can continue to the bottom of the channel, i.e. the support range of $0.056 to $0.058. This week, the TRX price volatility range is expected at a level of $0.060.

Contracting Bollinger Bands on the 1W chartHello?
Traders, welcome.
If you "Follow", you can always get new information quickly.
Please also click "Boost".
Have a good day.
Following yesterday, today we changed the background color of the chart.
Please leave a comment on which chart is more eye-catching, yesterday's background color or today's background color.
For your information, there is a significant difference between viewing a chart in real time and sharing a chart with a picture.
Therefore, I would be grateful if those who share and use my charts leave comments.
-------------------------------------
(TRXBTC 1W Chart)
The key is whether it can rise above 0.0000 0318 in order to release the upward force.
---------------------------------------
------------------------------------------
(TRXUSDT 1W chart)
The key is whether it can be supported at 0.06427.
In particular, as the Bollinger Bands are contracting, volatility is expected in the near future.
(1D chart)
It is important to be able to rise above the 0.06427-0.06532 section and be supported.
If not, you should check for support around 0.06004.
TRX is holding the price near the M-Signal on the 1M chart, so it can be clearly seen that the long-term trend is about to turn into an uptrend.
Therefore, as mentioned in the explanation of the 1W chart, it can be seen that the current position is located in a very important section.
If the mid- to long-term wiggle starts, there is a possibility of touching around 0.05358, so you should think about how to respond now.
-------------------------------------------------- -------------------------------------------
** All descriptions are for reference only and do not guarantee profit or loss in investment.
** If you share this chart, you can use the indicators normally.
** The MRHAB-T indicator includes indicators that indicate points of support and resistance.
** Check the formulas for the MS-Signal, HA-Low, and HA-High indicators at ().
(Short-term Stop Loss can be said to be a point where profit or loss can be preserved or additional entry can be made by split trading. This is a short-term investment perspective.)
---------------------------------

$TRX/#BTC [#TRON]: Resistance_BreakoutHey traders, we've identified a Resistance Breakout on the $TRX / $BTC chart. The price has broken above a key resistance level, which can indicate a potential bullish trend. Taking in consideration the next resistance key levels are at 0.00000286 | 0.00000293 | 0.00000311 and the major support zones are respectively at 0.00000268 | 0.00000257 | 0.00000239. It is a bullish indication and we may consider entering at the current price zone at 0.0000029 and targetting higher levels.
Technical Metrics :
Current price: 0.0000029
24H Volume: 101.4721 Ƀ
24H Price change: 1.045%
- Pivot Points - Levels :
Resistance: 0.00000286 | 0.00000293 | 0.00000311
Support: 0.00000268 | 0.00000257 | 0.00000239
Indicators recommandation :
Oscillators: NEUTRAL
Moving Averages: STRONG_BUY
Technical Indicators Summary : BUY
- In-depth TRXBTC technical analysis on > Tradingview TA page
What do you think of this analysis? Share your insights and let's discuss in the comments below. Your like, follow and support would be greatly appreciated!
Welcome to the home of charting big: TradingView
Benefit from a ton of financial analysis features, instruments and data. Have a look around, and if you do choose to go with an upgraded plan, you'll get up to $30.
Discover it here

Tron TRX is breaking out! Explosive pump is likely.
As you can see, TRX is currently breaking out of the descending triangle on the daily/weekly timeframe, and an explosive pump is now likely!
The take-profit is at the top of the triangle, which is 0.18 USDT. I think it's possible to go higher, but we don't want to risk anything, because we could be in wave 5 from the Elliott Wave perspective. Triangles are typically formed as a 4th corrective wave.
This bull market that started in January is absolutely amazing, and I hope it will continue as long as it possibly can! We want to take as much profit as possible from this bull run.
Sending USDT via the TRX network (TRC20) is very popular among crypto people. Furthermore, Tron's value held up very well during the 2022 bear market. It's definitely a positive sign.
Now is the best time to buy TRX if you don't want to miss out on the upcoming pump! It will be huge!
This analysis is not a trade setup; there is no stop-loss, entry point, profit target, expected duration of the trade, risk-to-reward ratio, or timing. I post trade setups privately.
If we take a look at the previous price action from 2020 to 2021, there are no gaps that need to be filled. In other words, it's possible that we will never go back to these levels.
I'm not sure how you feel about it, but I'm already long in the futures market. 171% is a good profit, so be greedy!
Thank you, and for more ideas, hit "Like" and "Follow"!

Can bulls do it?Hello every one
Today i want to share my idea with u.
On the 3-day time frame, we notice the intersection of the upper part of the descending channel with the red horizontal resistance
This intersection (yellow zone) indicate a strong resistance for the bulls to break it
Keep your eyes on it.👀
We expect a breakout to occur soon, and if this happens, we expect a strong rise of 300%
Don't forget to support us with ur like and follow me for more updates.💙
Good luck👌

Trxusdt Getting Ready Forming Symmetrical Triangle In weekly Timeframe
Incase Of Breakout Expecting 500b to 600^ Bulish Move Keep Eyes On That
Place stoploss Below Blackline
TRX/BTCThis is weekly chart - I am not intraday scalper.
Now Iam in previous accumulation area, I believe this is about time.
First stop will be around 350, second 850.
My position at 147.

TRXUSDT Ready For Takeoff!TRXUSDT Technical analysis update
If the price breaks above the resistance line then we can expect a good up move in Tron.
Buy zone: Below $0.062
Stop loss: $0.054
Take Profit 1: $0.068
Take Profit 2: $0.077
Take Profit 3: $0.092
Take Profit 4: $0.115
Always keep stop loss
Thanks
Hexa

Tron is a low-risk investment, but better than gold and TetherI think that Tron is one of the least risky currencies in the market, which maintained its stronghold and did not experience a large drop, and now I believe that in the weekly analysis, Tron can be considered as a safe and more profitable investment than gold and gold.
For the medium term and of course the long term
Good luck

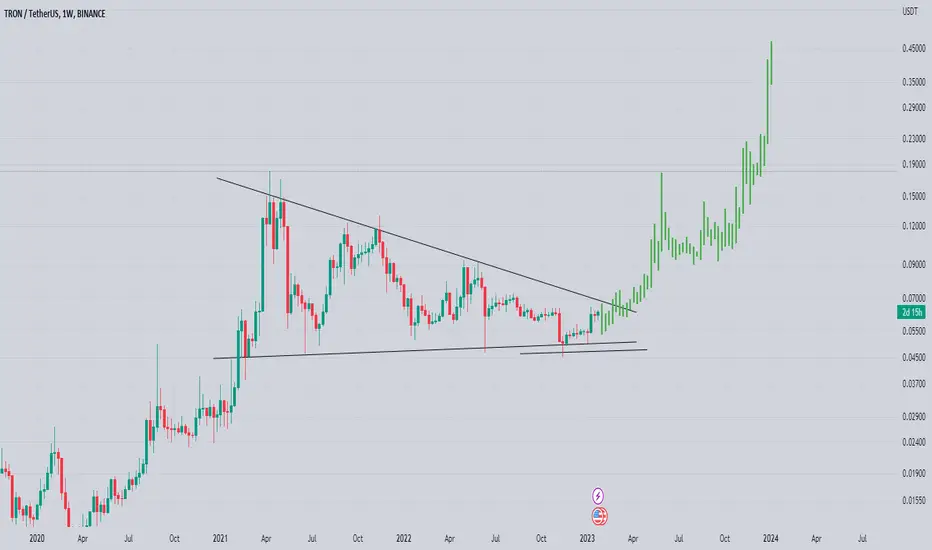
TRX - Tron is Ready to Breakout of a 2 Year Bullish Pennant!You will be hard-pressed to find a more bullish USD alt chart out there. Tron has a beautiful bullish continuation structure here on the daily that has been forming since the COVID crash in March of 2020. This massive pennant the price action has bouncing within is almost 2 years in the making. I think the breakout here could be huge. The price action is currently repeating the same exit pattern it had back in 2021. If Tron breaks out, buckle your seat belts and HODL on tight! I'm long here.

BITCOIN 1D Can break TrendLine? According to the drawn trend line and the resistance zone, we still have the resistance of the trend line and until this zone, if not broken the trend will not rise.
If the line breaks, the analysis process will be updated.
Its not Buy or Sell SIGNAL
DYOR
BY : M.TeriZ - @AtonicShark

Tron TRX chances of a sell-offTRX is a collateral in the stablecoin USDD, that keeps depegging!!!
This week I predict another selloff in the stock and crypto market after the CPI report on January 12.
My price targets for Tron TRX are:
TRX/USDT short
Entry Range: $0.052 - 0.055
Price Target 1: $0.049
Price Target 2: $0.045
Price Target 3: $0.030
Stop Loss: $0.062

TRX Tron prediction for the end of the yearUSDD, the Tron DAO reserve is depegging from the dollar.
USDD is secured by the over-collateralization of multiple mainstream digital assets (e.g. TRX, BTC, and USDT).
TRX is used as collateral. Could lose value sharply.
TRX/USDT short:
Entry Range: $0.052 - 0.055
Price Target 1: $0.049
Price Target 2: $0.045
Price Target 3: $0.040
Stop Loss: $0.061

TRX Tron the Next LUNA ? Justin Sun is the CEO of TRX, Tron, the 15th biggest cryptocurrency, with a market cap of $4.74 Billion.
Justin Sun`s TRX also controls a stablecoin, USDD, that keeps on depegging from the dollar recently.
He has also a controlling stake in Singapore-based Huobi, the fourth largest digital asset exchange.
Yesterday the amount of withdrawals from Huobi were significant, $60 Million.
There are Insolvency Rumors for Huobi.
I think TRX will ultimately reach its pandemic low of $0.0072.
Looking forward to read your opinion about it.

TRX: Showing strange trendTRX is showing since short term a strange pattern, for this reason, we will follow this coin to see if it can confirm the breakdown trend.
There is a cash-out trend on TRX, the question is to see if there is a whale trend following the same pattern.
Until now it's interesting to follow to see last trends on TRX.
A long at this moment on TRX can be risky since it's important to confirm the trend first.

TRXUSD is ready. Are you ready for this? 50 % dump (NEW)TRXUSD looks ready. The price has been in the descending triangle for a long time. Now it looks like it's ready for a breakout.
Taking into an account very bearish sentiment in the whole crypto market, we expect that it will break down.
Targets are shown on the chart.
We don't expect it to go to zero therefore targets are defined based on the historial key supports instead of traditional methodology applicable to trading descending triangle pattern.
Expect more FUD in crypto market which could be a trigger for a triangle to breakdown.
good luck
