TRON is going to the MOON? TRX Weekly forecast & Trading IdeasMidterm forecast:
While the price is above the support 0.17000, resumption of uptrend is expected.
We make sure when the resistance at 0.27260 breaks.
If the support at 0.17000 is broken, the short-term forecast -resumption of uptrend- will be invalid.
Technical analysis:
A trough is formed in daily chart at 0.20100 on 02/03/2025, so more gains to resistance(s) 0.24740, 0.25800 and maximum to Major Resistance (0.27260) is expected.
Take Profits:
0.24740
0.25800
0.27260
0.30099
0.33299
0.45000
__________________________________________________________________
❤️ If you find this helpful and want more FREE forecasts in TradingView,
. . . . . . . . Hit the 'BOOST' button 👍
. . . . . . . . . . . Drop some feedback in the comments below! (e.g., What did you find most useful? How can we improve?)
🙏 Your support is appreciated!
Now, it's your turn!
Be sure to leave a comment; let us know how you see this opportunity and forecast.
Have a successful week,
ForecastCity Support Team
Tron

TRX/USD "Tron vs US Dollar" Crypto Market Heist Plan🌟Hi! Hola! Ola! Bonjour! Hallo!🌟
Dear Money Makers & Thieves, 🤑 💰🐱👤🐱🏍
Based on 🔥Thief Trading style technical and fundamental analysis🔥, here is our master plan to heist the TRX/USD "Tron vs US Dollar" Crypto Market. Please adhere to the strategy I've outlined in the chart, which emphasizes long entry. Our aim is the high-risk Red Zone. Risky level, overbought market, consolidation, trend reversal, trap at the level where traders and bearish robbers are stronger. 🏆💸Book Profits, Be wealthy and safe trade.💪🏆🎉
Entry 📈 : "The heist is on! Wait for the MA breakout (0.25000) then make your move - Bullish profits await!"
however I advise to placing the Buy Stop Orders above the breakout MA or placing the Buy limit orders within a 15 or 30 minute timeframe. Entry from the most recent or closest low or high level should be in retest.
Stop Loss 🛑: Thief SL placed at 0.22800 (swing Trade Basis) Using the 4H period, the recent / Swing Low or High level.
SL is based on your risk of the trade, lot size and how many multiple orders you have to take.
Target 🎯: 0.30000 (or) Escape Before the Target
🧲Scalpers, take note 👀 : only scalp on the Long side. If you have a lot of money, you can go straight away; if not, you can join swing traders and carry out the robbery plan. Use trailing SL to safeguard your money 💰.
📰🗞️Fundamental, Macro, COT, Sentimental Outlook:
TRX/USD "Tron vs US Dollar" Crypto Market is currently experiencing a bullish trend,., driven by several key factors.
⭐Market Overview
Current Price: 0.24000
Daily Change: 3.5%
Weekly Change: 12.1%
⭐Fundamental Analysis
Tron Adoption: Growing adoption of Tron's blockchain technology, with increasing partnerships with major companies and organizations
DApp Ecosystem: Tron's DApp ecosystem is growing rapidly, with new DApps being launched regularly
Regulatory Environment: The regulatory environment for TRX is still uncertain, which could impact its price
⭐Macro Economics
Global Economic Trends: The ongoing global economic recovery is expected to drive up demand for cryptocurrencies, including TRX
Inflation Rate: Global inflation is expected to rise to 3.8% in 2025, potentially increasing demand for cryptocurrencies as a hedge against inflation
Interest Rates: Central banks are expected to maintain low interest rates in 2025, supporting cryptocurrency markets
⭐COT Data
Net Long Positions: Institutional traders have increased their net long positions in TRX to 58%
COT Ratio: The COT ratio has risen to 2.3, indicating a bullish trend
Open Interest: Open interest in TRX futures has increased by 18% over the past month, indicating growing investor interest
⭐Sentimental Outlook
Institutional Sentiment: 62% bullish, 38% bearish
Retail Sentiment: 58% bullish, 42% bearish
Market Mood: The overall market mood is bullish, with a sentiment score of +35
⭐Technical Analysis
Moving Averages: 50-period SMA: 0.22000, 200-period SMA: 0.20000.
Relative Strength Index (RSI): 4-hour chart: 64.21, daily chart: 60.14.
Bollinger Bands: 4-hour chart: 0.24000 (upper band), 0.22000 (lower band).
⭐Next Move Prediction
Bullish Move: Potential upside to 0.28000-0.30000.
Target: 0.28000 (primary target), 0.30000 (secondary target)
Stop Loss: 0.20000 (below the swing low)
Risk-Reward Ratio: 1:2 (potential profit of 0.06000 vs potential loss of 0.03000)
⭐Overall Outlook
The overall outlook for TRX/USD is bullish, driven by a combination of fundamental, technical, and sentimental factors. The expected increase in Tron adoption, growing DApp ecosystem, and bullish market sentiment are all supporting the bullish trend. However, investors should remain cautious of potential downside risks, including changes in global economic trends and unexpected regulatory developments.
⚠️Trading Alert : News Releases and Position Management 📰 🗞️ 🚫🚏
As a reminder, news releases can have a significant impact on market prices and volatility. To minimize potential losses and protect your running positions,
we recommend the following:
Avoid taking new trades during news releases
Use trailing stop-loss orders to protect your running positions and lock in profits
📌Please note that this is a general analysis and not personalized investment advice. It's essential to consider your own risk tolerance and market analysis before making any investment decisions.
📌Keep in mind that these factors can change rapidly, and it's essential to stay up-to-date with market developments and adjust your analysis accordingly.
💖Supporting our robbery plan will enable us to effortlessly make and steal money 💰💵 Tell your friends, Colleagues and family to follow, like, and share. Boost the strength of our robbery team. Every day in this market make money with ease by using the Thief Trading Style.🏆💪🤝❤️🎉🚀
I'll see you soon with another heist plan, so stay tuned 🤑🐱👤🤗🤩

trx next bull**TRX Next Bull: Riding the Wave of Innovation and Growth**
As one of the most dynamic cryptocurrencies in the digital asset space, **TRON (TRX)** continues to capture the attention of investors, developers, and blockchain enthusiasts worldwide. With its mission to decentralize the web and empower content creators, TRX is poised for its next bull run—a surge driven by technological advancements, strategic partnerships, and an ever-expanding ecosystem.
### Why TRX Could Be the Next Big Winner:
1. **Scalability and Speed**: TRON's high throughput and low transaction fees make it a preferred platform for decentralized applications (dApps), DeFi projects, and NFT marketplaces. Its ability to process thousands of transactions per second positions it as a leader in scalability.
2. **Growing Ecosystem**: From gaming and entertainment to finance and social media, TRX powers a diverse range of use cases. The rise of TRON-based dApps like BitTorrent, Sun Network, and JustLend showcases its versatility and adoption potential.
3. **Strategic Partnerships**: TRON has consistently forged alliances with global brands and institutions, enhancing its reach and credibility. These collaborations are instrumental in driving mainstream adoption and utility for TRX.
4. **Community Support**: Backed by a passionate and engaged community, TRX benefits from grassroots support that fuels innovation and adoption. This strong network effect amplifies its influence in the crypto sphere.
5. **Regulatory Clarity**: As regulatory frameworks around cryptocurrencies evolve, TRON's compliance-focused approach ensures it remains at the forefront of legitimacy and trust.
6. **Bullish Market Sentiment**: With increasing interest in blockchain technology and cryptocurrencies, TRX stands ready to capitalize on favorable market trends. Analysts predict renewed investor confidence could propel TRX to new heights.
### What to Watch For:
- **Upcoming Upgrades**: Keep an eye on TRON’s roadmap for enhancements such as improved consensus mechanisms or Layer-2 solutions.
- **Adoption Metrics**: Monitor user growth, transaction volumes, and dApp activity to gauge momentum.
- **Market Catalysts**: Major announcements, institutional investments, or integrations into real-world industries could ignite the next bullish phase.
The future looks bright for TRX as it cements its role in shaping the decentralized internet. Whether you're a seasoned investor or a newcomer exploring opportunities, TRX’s next bull run might just be the perfect time to join the revolution. Stay informed, stay agile, and get ready to ride the wave of innovation with TRON! 🚀

Buy time: When supported around 0.2209
Hello, traders.
If you "Follow", you can always get new information quickly.
Please click "Boost".
Have a nice day today.
-------------------------------------
(TRXUSDT 1D chart)
The chart was broken due to the surge on December 3rd.
-
The Fibonacci ratio 1.902 (0.2135) ~ 2 (0.2217), where the surge began, is an important support and resistance area.
Also, the M-Signal indicator on the 1W chart is passing around 0.2209, showing the role of important support and resistance.
If the price is maintained around the 5EMA+StErr indicator and rises above the MS-Signal indicator, there is a high possibility that it will turn into a short-term uptrend.
However, since a high boundary zone is formed in the 0.2543-0.27 section, it is important to see whether this section can be broken upward.
Therefore, if possible, I think it would be good to buy when the MS-Signal indicator approaches 0.2209 and shows support near 0.2209.
The reason is that it plays the role of a trend reversal based on the MS-Signal (M-Signal on the 1D chart) indicator.
In other words, it plays the role of support and resistance.
-
If it falls based on the Fibonacci ratio 1.902(0.2135) ~ 2(0.2217) section,
1st: Fibonacci ratio 1.618(0.1888) ~ 0.1967
2nd: 0.1567-0.1712
You need to check whether there is support near the 1st and 2nd sections above.
-
Thank you for reading to the end.
I hope you have a successful trade.
--------------------------------------------------
- Big picture
I used TradingView's INDEX chart to check the entire section of BTC.
(BTCUSD 12M chart)
Looking at the big picture, it seems to have been maintaining an upward trend following a pattern since 2015.
In other words, it is a pattern that maintains a 3-year uptrend and faces a 1-year downtrend.
Accordingly, the upward trend is expected to continue until 2025.
-
(LOG chart)
As you can see from the LOG chart, the upward trend is decreasing.
Accordingly, the 46K-48K range is expected to be a very important support and resistance range from a long-term perspective.
Therefore, we do not expect to see prices below 44K-48K in the future.
-
The Fibonacci ratio on the left is the Fibonacci ratio of the upward trend that started in 2015.
In other words, it is the Fibonacci ratio of the first wave of the upward wave.
The Fibonacci ratio on the right is the Fibonacci ratio of the upward trend that started in 2019.
Therefore, it is expected that this Fibonacci ratio will be used until 2026.
-
No matter what anyone says, the chart has already been created and is already moving.
It is up to you to decide how to view and respond to this.
When the ATH is updated, there are no support and resistance points, so the Fibonacci ratio can be used appropriately.
However, although the Fibonacci ratio is useful for chart analysis, it is ambiguous when used as support and resistance.
This is because the user must directly select the important selection points required to create Fibonacci.
Therefore, since it is expressed differently depending on how the user specifies the selection points, it can be useful for chart analysis, but it can be seen as ambiguous when used for trading strategies.
1st : 44234.54
2nd : 61383.23
3rd : 89126.41
101875.70-106275.10 (Overshooting)
4th : 134018.28
151166.97-157451.83 (Overshooting)
5th : 178910.15
-----------------

TRX/USDT 1H: Distribution in Premium Zone – Downside to $0.2150?TRX/USDT 1H: Analysis
🚀 Follow me on TradingView if you respect our charts! 📈 Daily updates!
Market Condition:
Price consolidating at $0.2220, maintaining a bearish bias with a distribution pattern evident.
RSI at 42.17 showing hidden bearish divergence, aligning with continued selling pressure.
Market Makers actively distributing within the $0.2230-$0.2250 zone.
Key Levels:
Resistance: $0.2250 (Fair Value Gap - FVG).
Support: $0.2200 (weekly low).
Critical Support: $0.2150 (major liquidity level).
Trade Setup:
Entry Zone: $0.2230-$0.2240.
Targets:
T1: $0.2200 (near-term support).
T2: $0.2150 (critical liquidity level).
Stop Loss: Above $0.2265 (clear invalidation).
Risk Score:
8/10 – Tight range offers favorable R:R, but high risk due to volatility near key levels.
MM Behavior:
Distribution phase evident at premium levels ($0.2230-$0.2250).
Likely targeting liquidity below $0.2200, with potential sweep of lows before any meaningful reversal.
Recommendation:
Wait for entry at resistance levels between $0.2230-$0.2240. Avoid chasing current price.
Maintain tight stops at $0.2265 to limit risk.
Downside bias suggests further movement toward $0.2150 before potential reversal.
Confidence Level:
7/10 – Bearish structure supports further downside, but key levels require monitoring for reversals.
🚀 Follow me on TradingView if you respect our charts! 📈 Daily updates!

TRX/USDT 1H: Smart Money Accumulation – Breakout Incoming?!TRX/USDT 1H Chart Analysis
🚀 Follow me on TradingView if you respect our charts! 📈
Current Market Structure:
Price at $0.22875 showing equilibrium after recent selloff.
RSI recovering from oversold conditions, currently at 54.77.
Clear bearish breaker zone at $0.24000.
Premium zone identified at $0.25500.
Smart Money Concepts:
Market Makers accumulated in the discount zone ($0.20000-$0.20500).
Hidden bullish divergence forming on RSI, suggesting momentum shift.
Liquidity pools likely targeted above $0.24000.
Key Levels:
Entry Zone: $0.22800-$0.22900
Targets:
T1: $0.24000 (Breaker Zone)
T2: $0.25500 (Premium Zone)
Stop Loss: Below $0.21500 (structural invalidation).
Risk Score:
7/10 – Moderate risk with favorable risk-reward ratio.
Market Maker Intent:
Accumulation phase at discount zone nearly complete.
Expecting upward continuation toward premium zone at $0.25500.
Watch for strong reactions at $0.24000 as first liquidity target.
Recommendation:
Long positions favorable in the $0.22800-$0.22900 range.
Monitor volume confirmation above $0.24000 to strengthen bullish bias.
Maintain tight stops below structural invalidation.
Confidence Level:
8/10 for bullish continuation toward premium zones.
🚀 Follow me on TradingView if you respect our charts! 📈

TRX/USDT 1H: Discount Zone Accumulation – Ready for a Bounce?TRX/USDT 1H Chart Analysis
🚀 Follow me on TradingView if you respect our charts! 📈
Current Market Structure:
Bearish trend with strong selling pressure still dominant.
Hidden Bearish Divergence confirmed on RSI vs price action from Jan 31 to Feb 2.
Price currently sitting at $0.2285, testing key support level.
Smart Money Activity:
Market Makers engineered a move to $0.2560 (premium zone) before aggressive distribution.
Current phase suggests accumulation may be starting at discount zone.
Liquidity hunt below $0.2300 could be part of MM strategy before reversal.
Key Levels:
Entry Zone: $0.2285 - $0.2290 (support zone).
Targets:
T1: $0.2420 (previous equilibrium).
T2: $0.2540 (FVG fill).
Stop Loss: Below $0.2260 (recent swing low).
Risk Score:
7/10 (Moderate risk – favorable R:R setup).
Market Maker Intent:
MM appears to be accumulating at current levels for a potential bounce play.
Volume profile suggests liquidity building up in the discount zone.
Wait for confirmation of higher timeframe support holding before entering longs.
Recommendation:
Long positions are favorable within the $0.2285 - $0.2290 range.
Maintain tight stops below $0.2260 for risk management.
Monitor price action for confirmation of bullish structure before entering.
Confidence Level:
7/10 for potential reversal play.
🚀 Follow me on TradingView if you respect our charts! 📈

TRX/USDT 1H: Bulls Eyeing $0.2700 After Breaking Key LevelsTRX/USDT 1H Chart Analysis (SMC Principles)
🚀 Follow me on Tradingview if you respect our charts 📈
Current Price: $0.2588
Market Structure:
Bullish momentum after breaking above the POI at $0.2500.
RSI: 63, indicating moderate bullish momentum without overbought conditions.
Key Levels:
Support: $0.2500 (flipped from resistance).
Resistance:
T1: $0.2650 (Premium zone).
T2: $0.2700 (Weekly high).
Equilibrium: $0.2550.
Trade Setup (Confidence Level: 8/10):
Entry Zone: Current price ($0.2588) or pullback to $0.2550.
Targets:
T1: $0.2650
T2: $0.2700
Stop Loss: Below $0.2480 (recent POI).
Risk Score: 7/10 (moderate risk due to extended move).
Market Maker (MM) Analysis:
Heavy accumulation visible at $0.2450-$0.2500.
Current phase shows distribution with sustained buying pressure.
No significant divergences on RSI, supporting continued bullish movement.
Recommendation:
Long position recommended at current levels or on pullback to $0.2550.
Monitor consolidation near $0.2600 for breakout confirmation.
Maintain tight risk management to protect against potential pullback.
Confidence Level: 8/10 for bullish continuation.
🚀 Follow me on Tradingview if you respect our charts 📈

TRXUSD: Trapped between the 1D MA50 and MA100. Decision time.Tron is naturally neutral on its 1D technical outlook (RSI = 54.705, MACD = -0.006, ADX = 21.441) as it is on consolidation mode, ranging between the 1D MA50 and the 1D MA100. With the 1D RSI signalling a reversal, as long as the 1D MA100 holds, we expect the next bullish wave to start once the 1D MA50 breaks. Target the R1 level (TP = 0.45150).
See how our prior idea has worked out:
## If you like our free content follow our profile to get more daily ideas. ##
## Comments and likes are greatly appreciated. ##

Tron is not done yetTRX Market Marker Model bottom.
indicators and structure agree with a pump.
we had impulse going out of this consolidation and another impulse wave is forming. TRX is ready to continue the climb

World Liberty Finance Invest $109M Fuelling TRX SurgeWorld Liberty Financial (WLFI) has shaken the crypto market with a $109.1 million investment across six major cryptocurrencies, including $4.7 million in TRX. This move has propelled TRX to a 5.12% gain, igniting discussions about its potential to reach $1. Here’s a closer look at the technical and fundamental factors driving this momentum.
Institutional Confidence in TRX
World Liberty Financial’s Diversified Investment
WLFI allocated $14.1 million to TRX, AAVE, and LINK, completing transactions within 20 minutes. This strategic diversification underscores the fund’s confidence in leading blockchain networks like TRON. The acquisition of 19.3 million TRX caused an immediate price surge of 3.2%, pushing TRX to $0.244.
TRON DAO’s Growing WLFI Holdings
In parallel, TRON DAO, led by Justin Sun, increased its holdings in WLFI tokens by investing $15 million to acquire an additional 1 billion tokens. With total holdings now at 3 billion WLFI ($45 million), TRON DAO’s commitment signals strong institutional support for the TRON ecosystem. Justin Sun’s announcement of plans to raise TRON DAO’s WLFI investment to $75 million has further fueled market optimism.
Market Reactions and Trading Volume Spikes
The broader market reacted swiftly to WLFI’s investments, with significant trading volume spikes reported on Binance, Coinbase, and Kraken. Large transactions and active addresses surged on the TRON and Ethereum blockchains, reflecting heightened interest in these assets.
Technical Analysis: TRX’s Path to $1
CRYPTOCAP:TRX is currently trading within a concealed rectangular consolidation pattern, up 5.12% on the day. The Relative Strength Index (RSI) stands at 51.87, indicating that CRYPTOCAP:TRX has sufficient room to build momentum and target higher levels.
Support and Resistance Levels
- Support Zone: TRX’s support lies at its 1-month low, a critical level to monitor. A break below this could signal bearish sentiment.
- Resistance Zone: The 1-month high acts as the immediate resistance. A successful breakout above this level could pave the way for significant gains.
Volume and Momentum
The recent surge in trading volume highlights strong buying interest, providing a solid foundation for TRX’s upward trajectory. The RSI’s neutral stance suggests that the asset is neither overbought nor oversold, allowing for potential upward movement.
Comparative Market Trends
ETH, AAVE, and LINK Movements
WLFI’s investments have also impacted ETH, AAVE, and LINK. ETH’s trading volume surged 117%, contributing to a 9% price rally over the past week. Similarly, AAVE and LINK gained 6% and 2.7%, respectively. These trends indicate a broader bullish sentiment in the market, which could further benefit TRX.
Meme Coin Dynamics
Interestingly, the Trump family’s ventures into meme coins have also influenced market behavior. The MELANIA coin’s surge to $13 and a $2 billion market cap within hours highlights the high volatility in the space. CRYPTOCAP:TRX , however, remains relatively stable, reflecting its growing institutional appeal.
Conclusion: Is $1 Achievable for TRX?
With robust institutional backing from WLFI and TRON DAO, TRX is well-positioned for further growth. The combination of technical consolidation and fundamental confidence supports a bullish outlook. While challenges remain, the $1 milestone appears increasingly attainable, especially if TRX can break above its resistance levels and sustain the momentum.
Investors should keep an eye on key support and resistance zones, as well as broader market trends, to gauge TRX’s next moves. As institutional investments continue to flow, TRX’s journey to $1 could become a reality sooner than expected.

TRON Bullish Continuation (Non-Leverage Buy and Hold)TRON (TRX) price seems to exhibit signs of overall bullish momentum as the price action may form a credible Higher Low with multiple confluences of key Fibonacci and Support levels which presents us with a Non-Leverage Buy and Hold Opportunity.
Trade Plan :
Entry @ 0.224
Stop Loss @ 0
TP 1 @ 45

tron (TRX)trx usdt daily analyses
time frame 4 hours
risk riwards ratio > 3.5 (woooow)
****** ( My condolences to those who lost their lives in the California fires.) *******
there is no volume in the market yet.
RSI is in the bottom of chart
price is in the down side of triangle and sellers couldn't break the support line ( 0.225$)
I set LS on the down of another support line on 0.195$
if we hear a good news about cryptocurrency market or tron , maybe a pump happens and good benefit for traders.
be careful for stop hunters. in this situations

#TRX/USDT Ready to go higher#TRX
The price is moving in a descending channel on the 1-hour frame and sticking to it well
We have a bounce from the lower limit of the descending channel, this support is at 0.2500
We have a downtrend on the RSI indicator that is about to be broken, which supports the rise
We have a trend to stabilize above the moving average 100
Entry price 0.2530
First target 0.2572
Second target 0.2607
Third target 0.2647


TRX/USDT TRON BULLHello friends
The TRX/USDT chart has created a good opportunity for buying
Monitor the chart according to the shape and compliance with financial management and enter the purchase with confirmation.
SL: 0.23266 (Risk ~ 2%)
Gain > 44%
R/R : 22 !!!

TRXUSDT %150 DAILY VOLUME SPIKE | BE CAREFUL NO BUYERS YET1. Volume Spike Context
A 150% volume increase is significant, but without buyers stepping in, this can mean:
Absorption: Large orders are filling on the sell side, suppressing upward movement.
Liquidity Sweep: Price is testing a key zone to trigger liquidity (e.g., stop-losses or limit orders).
2. Blue Box Zones
When price approaches your predefined blue boxes:
Observe how price reacts in those zones on lower timeframes (e.g., 1-minute or 5-minute):
Is price consolidating (building a base)?
Are there sharp rejections (wicks, tight ranges)?
Is price forming higher lows (signs of buyers stepping in)?
3. Upward Breakout Triggers
To evaluate upward breakouts:
Focus on price structure:
A clear break above recent highs on lower timeframes.
Watch for a clean candle close above the range to confirm buyers have control.
Ensure the breakout is not a fakeout:
Price should not immediately drop back into the range after breaking above.
Look for a retest of the breakout level that holds as support.
4.Volume Behavior at Blue Boxes
Even without indicators, you can observe volume visually:
If large volume candles appear near the blue boxes and price holds → buyers may be absorbing supply.
If price starts moving up with minimal retracement → potential for continuation.
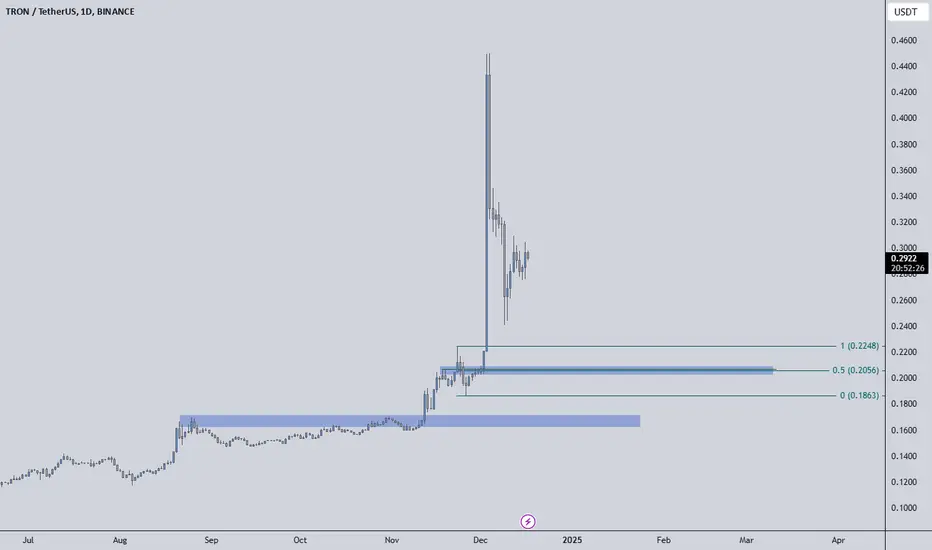
$0.268: Tron TRX Last Stand?Tron is currently trading below the resistance at $0.297, the area characterised by slow and choppy price action.
1. A bounce from the nearby support level at $0.268 could suggest renewed buying interest, setting the stage for a potential move toward $0.297 (Dashed Green Projection).
2. A break and close above this level would indicate bullish strength, opening the path toward the next resistance at $0.339, followed by $0.377, providing room for a broader recovery (Solid Green Projection).
3. Conversely, if TRX fails to hold $0.268, it would indicate increasing bearish momentum, likely triggering a decline toward the key support zone at $0.226 (Red Projection).

Tron Futures Signal / 3x-5x LeverageBINANCE:TRXUSDT
CRYPTO:TRXUSD
📈Which side you pick?
Bull or Bear
SL1 ---> Low-risk status: 1x-2x Leverage
SL2 ---> Mid-risk status: 3x-4x Leverage
(If there is just one SL on the chart, I suggest, low risk status)
Considering the price trend in its previous channel, by repeating the stabilization of the price at the bottom of the second parallel channel, it can be expected that the price will continue to move up to the top of the new channel.
The price breaking above the specified level can increase the certainty of the realization of the price target.
The price falling below the red level cancels the bullish scenario of Binance Coin.
Potential price targets for the levels will be $950 and $1,447.
👾Note: The setup is active but expect the uncertain phase as well. also movement lines drawn to predict future price reactions are relative and approximate.
➡️Entry Area:
Yellow zone
⚡️TP:
0.2919
0.2968
0.3020
🔴SL:
0.2767
🧐The Alternate scenario:
If the price stabilizes against the direction of the position, below or above the trigger zone, the setup will be canceled.

Market Outlook: Positive Trends in TRX/USDT Suggest Bullish!Hello Traders,
Just Breaked The Resistance Zone And Taking Support And There is A Potiential Chance To Go Upside!
We have one Resistance Zone, and 2 Supply Zones. The Price Breaked The Resistance Zone, And Becames The Support Zone, Take Entry While Retesting OR Pullback of The Move.
Please Note That The Only Purpose of The Information On This Page is Purely Educational.
I Would Welcome Your Participation And Support in the Form of Likes, Comments, And Follow us to Offer Some Encouragement.
Thank You.

TRON Set To EXPLODE During Next BTC ConsolidationPrice Target: .148 - .2
Wolfpack and RSI have room for upside.
Chart pattern similar to MANA and BAT. Look what happened to those cryptos this week!!!

Tron (TRX) Climbs to New Highs - What's Behind the Recent Rally?Exploring the Surge: Tron (TRX) Climbs to New Highs - What's Behind the Recent Rally?
Tron (TRX) Soars to New Heights: A Deep Dive into the Recent Rally
Tron (TRX), a decentralized platform that aims to build a worldwide free content entertainment system with the blockchain and distributed storage technology, has recently experienced a significant surge in price. This rally has caught the attention of seasoned investors and cryptocurrency market newcomers.
The 100% Rally and Beyond
In a remarkable display of bullish momentum, Tron's price surged over 100% within a 24-hour period, propelling it to a new all-time high (ATH). This extraordinary growth ignited a wave of excitement and optimism among crypto enthusiasts. The question on everyone's lips: Could Tron be poised to reach the $0.5 mark?
Technical Analysis: A Bullish Outlook
To gain a deeper understanding of Tron's recent price action, let's delve into a technical analysis of its one-hour chart.
• Reclaiming the 20 MA: One of the key indicators of renewed buyer interest is the ability of a cryptocurrency to reclaim its 20-day Moving Average (MA). When Tron successfully recaptured this crucial support level, it signaled a potential shift in market sentiment from bearish to bullish.
• Bullish Momentum: The upward trajectory of Tron's price, coupled with increasing trading volume, suggests strong underlying bullish momentum. This momentum can often drive prices higher, especially when supported by positive market sentiment and fundamental factors.
• Potential Resistance Levels: While Tron's recent rally has been impressive, it may encounter resistance at certain price levels. Identifying these potential resistance zones can help investors gauge the extent of the upcoming price movement.
Fundamental Factors Driving Tron's Rally
In addition to technical indicators, several fundamental factors have contributed to Tron's recent surge:
• Growing Ecosystem: Tron's ecosystem has been expanding rapidly, attracting a diverse range of projects and applications. This increased adoption and utility have positively impacted the demand for TRX tokens.
• Strategic Partnerships: Tron has forged strategic partnerships with various organizations, including BitTorrent, a popular file-sharing platform. These collaborations have strengthened Tron's position in the blockchain industry and boosted its visibility.
• Positive Market Sentiment: The overall bullish sentiment in the cryptocurrency market has also played a role in Tron's price appreciation. As investors become more optimistic about the future of digital assets, they are allocating more capital to promising projects like Tron.
The Road Ahead for Tron
While Tron's recent performance has been undeniably impressive, it's important to approach any investment with caution and conduct thorough research. The cryptocurrency market is highly volatile, and prices can fluctuate rapidly.
As investors look ahead, they should monitor key factors such as:
• Market Sentiment: The overall sentiment in the cryptocurrency market can significantly impact Tron's price.
• Regulatory Developments: Changes in regulations can have a profound effect on the cryptocurrency industry, including Tron.
• Technological Advancements: Continued innovation and advancements in blockchain technology can drive Tron's growth and adoption.
In conclusion, Tron's recent 100% rally and reclamation of the 20 MA on the one-hour chart have ignited a wave of optimism among investors. However, it's crucial to approach this bullish momentum with a balanced perspective and consider the potential rewards and risks of investing in cryptocurrencies. Investors can make informed decisions about their Tron investments by staying informed and conducting thorough research.
