TRX/USDTtrx/usdt is currently trading at HTF resistance. if we break this neckline with good volume and a retest ; looking for a long position for trx/usdt.
Trxusdt


TRXUSDTPERPAfter the downward extension that we see in this currency, the price faced a correction and the recent candles show the price of this currency falling, so it is suitable for short position.

🔥 TRX: possible false breakout abd riseTRX price is creating the rising wedge. This is a bearish pattern but after the BTC fall for the 75% the continuation of the downtrend is less possible then consolidation or growth.
The price should return to rising wedge for continuation of it growth. It shown sign of bulls. Additionally, we see how TRX was growing after the fall. A lot of buyers were at the bottom what is shows us the strength of this alt. Even when BTC fall it continue it`s uptrend.
Also, the growth is possible because of the short traders which are open their possition after the Luna crasg and wait for the crash of USDD (Tron`s stablecoin) but situation normalized.
The volumes after the false brakout don`t show that a lot of traders were trapped. Even after break of the lower boundary volume doesn`t change so we have to wait for our trading setup.
The target is value area of $0.78-0.86.
Additional scenario is the retest of lower boundary of rising wedge as the resistance and continuation of fall. It`s possible if BTC continue it`s fall to 17-17,5k to make a relow and collect liquidity.
In this case the target will be the area of $0.5-0.55.
💻Friends, press the "like"👍 button, write comments and share with your friends - it will be the best THANK YOU.
P.S. Personally, I open an entry if the price shows it according to my strategy.
Always do your analysis before making a trade.

TRON (TRX) - July 12Hello?
Traders, welcome.
By "following", you can always get new information quickly.
Please also click "Like".
Have a good day.
-------------------------------------
(TRXUSDT 1M Chart)
The 0.04736-0.06034 interval is the interval that determines the trend.
Therefore, if the price is maintained above this range, it is expected to rise.
(1W chart)
Primary resistance: 0.07679-0.08631
Secondary resistance: 0.10176-0.11228
1st support: 0.06034-0.06461
Second support: 0.04736
(1D chart)
On July 9th, the RSI marked an overbought zone and is declining.
It is necessary to check whether it can be supported in the first support section.
In particular, you need to make sure it is supported at 0.06532.
The volatility period is around July 20.
------------------------------------------------------------ -----------------------------------------------------
** All indicators are lagging indicators.
Therefore, it is important to be aware that the indicator will move accordingly as price and volume move.
However, for the sake of convenience, we are talking in reverse for the interpretation of the indicator.
** The MRHAB-T indicator used in the chart is an indicator of our channel that has not been released yet.
** The OBV indicator was re-created by applying a formula to the DepthHouse Trading indicator, an indicator disclosed by oh92. (Thanks for this.)
** Support or resistance is based on the closing price of the 1D chart.
** All descriptions are for reference only and do not guarantee a profit or loss in investment.
(Short-term Stop Loss can be said to be a point where profit and loss can be preserved or additional entry can be made through split trading. It is a short-term investment perspective.)
---------------------------------

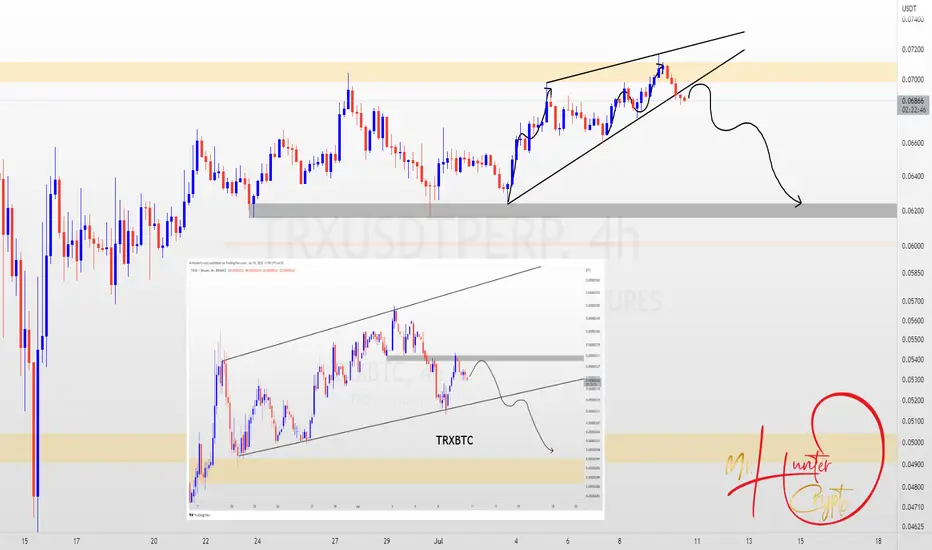
TRXUSDTPERPAfter the upward rally of this currency compared to the market as a whole, we are currently experiencing weakness in the upward trend and the double lag of the recent upward step and the increase in the length of the corrective step, and as can be seen in the chart of this currency with the Bitcoin pair, the price cannot reach the midline of the channel and the range of Break price action resistance.
According to the descending pattern of the rising wedge formed in the chart with the Tether pair, expect a further drop or a pullback to the 0.07 area and the formation of a lower ceiling and a further price drop.
TRX Short in poor marketConsidering BTC position and this gentle climb on no fundamentals or volume builds a solid picture.
Reaching previous resistance.
Long term downtrend resistance approaching
Entered short long term, expecting 0.65
Eventually down to 0.5 with
bad market conditions.

#Tron Stabilize as TRX Bulls Expect to Retest $0.076Past Performance of Tron
Tron prices are stable at spot rates, reading from the performance in the daily chart. Even though the uptrend is labored, TRX buyers are still in control from an effort versus result perspective. As such, Tron prices may still edge higher in a bull continuation pattern. The upthrust would be in confirmation of the June 15 bull bar and may see TRX race towards June 13 highs of $0.076.
#Tron Technical Analysis
TRX buyers are still in control, and the recovery is on course. From the daily chart, the gains of June 15 are yet to be fully confirmed in a move that may see TRX reverse the losses of June 13 and 14. The two bearish bars still define the short and medium-term trends of TRX, and buyers must reverse those losses for a clear trajectory to emerge. Therefore, with the upside momentum still strong and market conditions shifting, TRX traders may find entries above $0.062 with immediate targets at June 13 highs of $0.076. Further gains may see TRX race towards May 2022 highs of $0.090.
What to Expect from #TRX?
Traders are upbeat. Tron will have more headroom in the medium term if the losses of June 13 and 14 are fully reversed. However, TRX will be in a bullish course only if prices are above $0.062.
Resistance level to watch out for: $0.070
Support level to watch out for: $0.062
Disclaimer: Opinions expressed are not investment advice. Do your research.

TRXUSDTPERPWith the continuation of the upward trend in this currency, the movement steps have become weaker and against the higher ceilings, and with the failure of the zone in the lower time frame, we can expect the price to fall.

Tron TRXBTC - HUGE Breakout! Channel + 200MA + Elliott Wave!- Tron is currently one of the strongest altcoin on the crypto market!
- On the weekly chart we can spot a descending channel , that has been destroyed by the bulls.
- Also we can see a broken ymmetrical triangle, which is definitely a great sign too!
- 200 weekly MA is considered as a massive support by huge institutions and the price is currently above the level!
- We are currently in the Impulse Wave (1-2-3-4-5), so it is the best time to buy right now.
- Next resistance is the previous all time high from 2018.
- Look at my ideas about another interesting altcoins in the related section down below ↓
- For more ideas please hit "Like" & "Follow"!

TRXUSDTHello Crypto Lovers,
Mars Signals team wishes you high profits.
This is a one-day-time frame analysis for TRXUSDT
According to our previous analysis on June 22, we expected a rising trend and now you see that this has happened and the price is on the rise. At the current chart, we have R2 as the resistance line and the unsuccessful attempts of the price to rise is obvious. R1 used to be support line and also S1 is a support area that includes the support of the price since the past. Now the price is fluctuating below R1 and we believe it will rise to R1 and then at this point we will activate our short position and even it may rise over this line and fixes itself for more increase. Or the price might be rejected at R1 and face a decline toward S1.
Warning: This is just a suggestion and we do not guarantee profits. We advise you to analyze the chart before opening any positions.
Wish you luck

Tron Long-Term Higher Low Leads To Higher HighWe have here the long-term chart for Tron (TRXUSDT).
We will focus on the higher low.
Look back to June 2021;
The marked support level was hit followed by a 175%+ bullish wave.
June 2022 we hit a higher low:
A new bullish wave can follow of similar magnitude.
We mapped for you multiple targets on the chart.
I hope you find this information useful.
Feel free to follow, share, comment & like if you enjoy the content.
Namaste.

TRXUSDT Consolidation more than 1y and its possible consequencesBefore you is the global chart of TRXUSDT on a 3-day time frame.
At a time when most altcoins show a stable downward trend for more than a year, the price of TRXUSD is consolidating in the upper half of the all-time price range.
If at the beginning of the consolidation, the price movement in the consolidation was 300%, now the possible price movement within the consolidation triangle is 50%.
Further, in the consolidation, "the spring will be compressing" , and this may drag on until the fall, or even until the end of the year. But when it shoots, the impulse will be very strong and long-lasting.
The chart shows a strong liquidity zone $0.046-0.052. F or the first time, sellers and buyers actively competed in this zone in May - July 2021.
During the May fall in 2022. - the TRX price confidently growing from $0.07 to $0.09, when parallels 90% of alts were mercilessly falling.
However, already in June 2022, the TRXUSDT price caught up with the general fall of the crypto market, but a large aggressive buyer did not allow the price to update the minimum from May 2021. (FUD around the stablecoin Usdd)
Summarizing :
If in the coming days-weeks the TRXUSDT price will not be allowed to fall below $0.06, then know - it is being accumulated by large buyers.
The minimum goal for growth is $0.09, and if it breaks higher, the Tron price will be able to fly up to $0.135-0.14
If you see the TRXUSD price fixing below $0.52, you will most likely have to flee from the Tron, because there will be a threat that the fall will accelerate to $0.25-0.35
_______________________________
Since 2016 , we have been analyzing and trading the cryptocurrency market.
We transform our knowledge, trading moods and experience into ideas. Each "like under the idea" boosts the level of our happiness by 0.05%. If we help you to be calmer and richer — help us to be happier :)

TRXUSDT will be in down trendTRXUSDT trade will be in down trend channel ultimately it will touch -161.8% level then you can get good price to open buy position.
Don't forget to share and subscribe.
We publish precise and compact information after careful consideration which give you quick glimpse for comparative analysis. Our aim is to deliver simple and compact information which can be used by beginner to give them brief understanding of trades without any complexity. if you have any question or want to ask about analysis of other pairs or you have any confusion about analysis then feel free to ask us. Don't forget to support us by sharing our ideas and hit like and subscribe button. You can support us through coins donation for more frequent signals.

TRX/USDT - Readying to hit new lowsAs mentioned in my previous analysis, its playing out perfectly. As I also mentioned I am swing trading this from top of the green arrow I showed in my previous TA.
Now for me its confirmed we will create newer lows, that's why I'm stacking shorts at every bounce. Also I am always prepared for scam pumps, I try to catch scam pumps as opportunities instead being getting surprised by a scam pump. Since I have stacked enough shorts, I will close 75% at 0,045. 25% iIwill keep until we bottom which is probably around ca 0,032 - 0,035.

TRX/USDT - Readying to hit new lows200 ema support broke at 4H chart. Clear retest as res before nuke. We are at a range of trapping bulls, However I'm also prepared for scam pumps, which this coin is very at.
Been successfully trading TRX over 3 months. This will play out 100%. Its a swing short.

TRX: hottest🔥 alt make a pullback. Here is an enrty point!📊TRX grow higher than any other altcoins. It`s pump even if BTC fall sometimes. It has strong support from the buyers and in this idea i`ll show you where the big player open it`s longs.
1. First of all, the huge support is the $0,62-0,63 value area. The liquidity collection and the liquidation of the lavarage position confirm the volume indicator. The volume bars should grow. It`s shows us also the presence of buyer. We need to follow the smart and big money, don`t we?
2. After the small consolidation and trendline squeeze the price have to brake the trendline. Here will be our entry point.
3. The local manipulations are not required but it will be good to see false breakout or liquidity collection before the breakout of the trendline. The trapped short traders gives to TRX additional fuel to grow!
The targets:
1️⃣ $0,7 - the closest key level
2️⃣ $0,75-0,79 - the liquidity gap.
This target will be easy to reach for TRX if BTC show some strength. The price of this alt grow even if BTC just consolidate. Image what happen if BTC starts to rise.
✅Traders, if you have a question about how to trade the trendline breakout or other trading tips write down in the comment or to DM!
💻Friends, press the "like"👍 button, write comments and share with your friends - it will be the best THANK YOU.
P.S. Personally, I open an entry if the price shows it according to my strategy.
Always do your analysis before making a trade.

[b][/b]TRXUSDT : ARE WE STILL GOING DOWN ?[b][/b]On the 15th of June , TRXUSDT exhibited a climatic price action which has been followed by an increasing price with low volume.
For clarity : Climatic price action ( buy climax or sell climax) is a period in the market when the dominant trend usually seems to be over powered . This is shown by sudden volume spike with low effect . This occurs because the dominant trend exited their positions ( in this case sellers became buyers ) hence taking the opposite side of their initial position.
Since trading is a zero sum activity, these sell orders automatically become buy orders in order to exit the position aiding the short term rallies that follow climatic action seen as buys . This at times is called bull traps .
Support and resistance alternation is a common term and knowledge in technical analysis .
With the 61.8% Fibonacci level coinciding with the support turned resistance zone around 0.075 price level, this is a great confluence for a sell continuation on TRXUSDT.
In addition, we have a bearish flag pattern also calling for sells.
With these, I do be on the lookout for a sell opportunity around the highlighted resistance zone which should be confirmed by any of the reversal candlestick patterns , indicator divergence or any of the reversal signals .
Feel free to share your thoughts in the comment section

GRIDCOM - SECOND IDEASomeone should learn me the drawings, I can only handle a hammer of thor.
Listen, TRX the spoiled child has enough money from ali papa. Ali wants to share his profits with us via TRON. I will tell you the story of thunder, WHICH will result in colossal GAIN !
BUY between 0,11 $ and 0,123
SELL on 0,18 $
USE LEVERAGE 25x or 20x
-GRIDCOM-
The brokers grid & command !

TRONX Price action is in Motion, what is next?Hello all,
That being said, neither I am a crypto expert, nor a fundamental researcher, I like to trade based on purely technical and price action analysis. Show me the chart then I would tell you the news.
I do not care also about the technology, I only care about what I see on the chart and try to share it with you.
Market structure:
1. Downtrend is confirmed. Be careful when People or "YouTuber," say the market now is in the bottom process. It also means that the market will go deeper and lower, then it will create the Divergence or retest the double or triple time the EMA, etc. Of course, I don't exclude the V Shape recovery.
2.
Major flow: From point 1,2,3,4,5 >> bearish.
Minor flow: From 6,7,8,9,10 >> bullish, however, notice that the resistance line is still holding the price action from the Supply sellers! This means buyers are not that stronger than sellers at the moment I am writing this post.
3. Less is more, I think that you could see there is a "highly probable" short trade set up with a 1 to 5 or even 8 risk/reward ratio. From my own "stupid" experience, please do not leverage more than x20, and please do not overtrade, because I expect that Tron price actions could be highly volatile, as long as there is no body of candles in 4H or 8H closing above the washing lines. The market will continue its first motion, Major flow >>> towards the Ultimate target!!!
Cheers, and thank you.

TRXUSDT 1D TA : Bull or Bear ?As you can see, the price has returned from a significant support range
It is likely to grow close to theBearish Trend line
Follow us for more analysis & Feel free to ask any questions you have, we are here to help.
⚠️ This Analysis will be updated ...
👤 Arman Shaban : @ArmanShabanTrading
📅 06.20.2022
⚠️(DYOR)
❤️ If you apperciate my work , Please like and comment , It Keeps me motivated to do better ❤️

TRX long$TRX broke through the resistance level. Bullish movement is expected to continue up to resistance at 0,078$.

TRX/USD - Tron pumping to 7 cents! 🚀Tron is on a clear path to 7 cents. The chart is bullish and so are the indicators.
If it breaks the 7 cents resistance and moves above 8 cents, then TRX could leave this massive descending triangle visible on the weekly timeframe.
Both the MACD and RSI are making higher highs, so this is good and continuation is likely unless BTC pulls the market lower.
To me, the price will continue up until it faces the resistance level.
Volume is not great on this last pump, but there are reasons to be optimistic right now.
Longs have a better r/r right now and my bias is bullish.
Like and follow if you liked my idea!
