Trxusdt

TRONTron still in bullish scenario until now. Correction on support EMA 50 TF 1D, Support Trendline and Classic Support.
Correction happen after price touch fibonacci 0.618 on price 0.12867 (swing high to swing low).
Based on fibonacci -0.272 and -0.618 target price around 0.14329 and 0.16780 (swing low to swing high). Wait for confirmation before take position.

Setup for $TRX we can see falling wedge pattern at TF1H, if you want to put long position you can put at last fibo price and don't forget to set SL if this setup invalid. DYOR thank me later

best place for profit TRXUSDTbest place for profit . TRX is looking ready to break from the channel.

TRXUSDT , Its ready to jumpHello everybody
According to our analysis the price is impact to the resistance zone for the 2nd time and now we have support the trendline and we think it can be ready to jump to the 1st target that we shown on cahrt , the point of this analysis is until the price will not break the resistance zone more target is not in our way , we need to break the resistance zone then we can be ready to reach to the target that we shown on chart .
If you have any question or need any help just send us message in private
Dont forget stop loss and attention to money management
Good Luck
Abtin

TRX ANALYSIS 15/11/21Green: bullish
Blue: healthy
Red: btc moves down
Comment if you feel like it
Thanks

TRXBTC bottom is in, the future is heredid you know that TRX is better than ETH ? that is why tether/USDT were swapping their USDT token from ETH chain to TRX chain.
dont believe me ? try to withdraw your usdt via TRX chain from your binance and compared it with via ETH chain. and check the fees.
disclaimer: not fincancial advice, always D.Y.O.R.

trxusdtIf supported at the bottom of the canal, there is room for growth. If it is not supported, it will leave the channel and may fall.
Due to the volume of the candlesticks, it may be more likely to fall. Be careful.

Update TRXHy Traders,
There is an Update for my last idea about TRX, its clear on the chart ;;)
share your ideas in comments ;)
Have fun

TRX/UST : Ain't looking too good
TRX/USDT
Starting a potential mini Downtrend . Staying below 0.113 is not bullish for TRX in the immediate short term and essentially a breakdown below 0.10785 with 4hr-6hr candle closure gonna pull this thing back to 0.1-0.092

trx is a good choice for peace of assets tron is completing a complex correction and it will explode soon. I suggest it to you but with yourself analysis. Goodluck my friends 🙃😉😍✌

TRXUSDT Prediction 1D TRON can complete the pullback and move in the direction of the specified goals ...
what is your opinion?

#TRX reached to it's support and start mowing If #TRX break out the resistance in 0.11260(MA 50) next targets are 0.11700 - 0.11900 - 0.12200

Don't miss it ... Tron about a huge pump
since 15 august till now 15 November, we can see Tron is struggling to break out n close above 12 cents.
after the dip in the market we can see clearly that Tron has slowed up, I think perfect time to have some right now.
I think a break out is coming we didn't get a complete rejection till now.
prices still above EMA 50 , EMA 100
Maybe u think u should buy on green box, but it is hard to fell there again as price is respecting the EMAs well.
✅ buy: 0.10 - 0.115✅
🎯TARGETS:
1- 0.1300
2- 0.1470
3- 0.1620
4- 0.1850
5- 0.2220 (worth wait)
6- 0.2600 (worth wait)
💵 Trade Size: 5-7% of Portfolio
🚫Invalidation(SL): daily close below 0.0760

TRX : Can we see Pending Rally to 0.17$In the last few days TRX has started gaining momentum and hit resistance at 0.13 , but together with the rest of the market it took a correction . The 0.10 area looks good support as it confluences with the 50 EMA and also our present point of Control.

TRXUSDT SETUPTRXUSDT current drop reached at support zone where fib level 61.8% and trendline support also lies 0.11300. Now we can target 0.12 level followed by 0.122.

Bullish
Hello friends,
A Possible scenario is shown in the chart.
If you've been waiting to invest, now might be a smart buying opportunity
CCI:
RSI:

trxusdt has a good potential for increasing your assets trx can repeat his behavior before X wave and orgnizes another 3: (zigzag probably) . let's see it

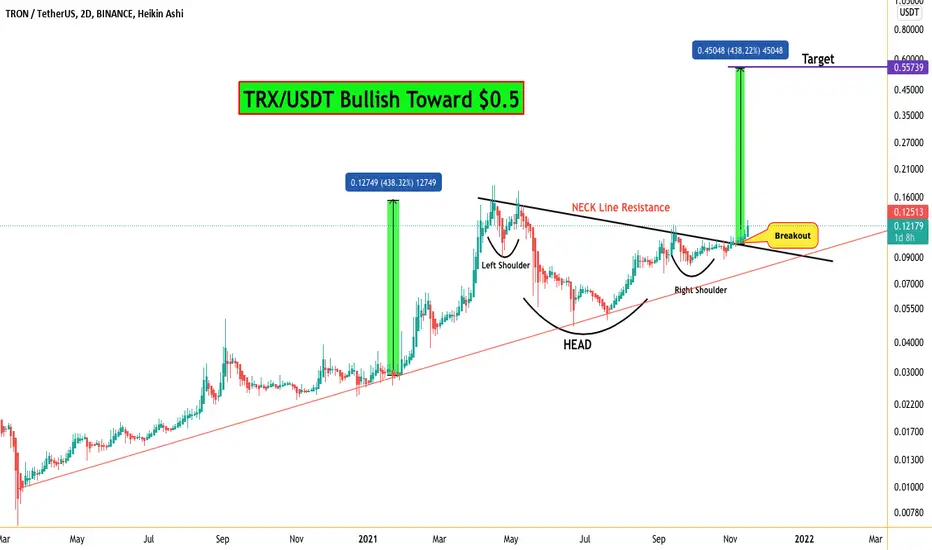
TRX/USDT ( TRON ) Ready toward $0.5 As per Recent Breakout#TRX/USDT supper Bullish chart:-
$TRX currently trading at $0.124
And 30% Pumped after Breakout.
So Huge Volume coming in $TRX
Now..?
Now Breakout 206 Day resistance level.
This is very good For Bullish Sign.
Best Entry:- $$0.10-$0.120 ( Accumulate)
Target:- $0.5
Stop loss:- Above $0.09 Is bullish.
$TRX /USD, Flipped ~0.1$ into support and trying to go for a HH$TRX /USD
Flipped ~0.1$ into support and trying to go for a HH, aiming at September highs (~.12$)
Volume at levels not seeing since May and UCTS bullish across all HTFs
#TRX


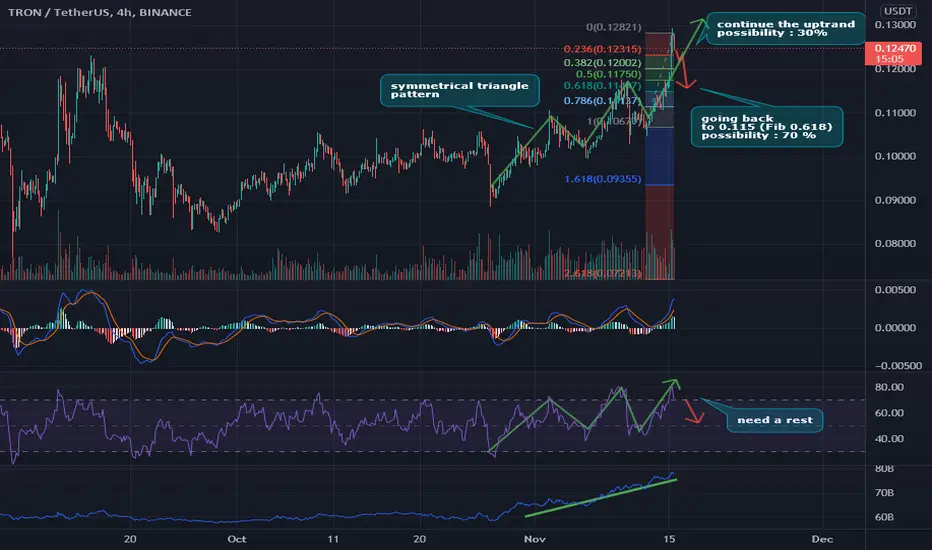
TRX is now Gonna Reach 0.15$Hi every one
TRON/USDT
Last Time We talked about TRX, It was in a Symmetrical Triangle. Now The Bullish Break out has happened & we can be sure that the Price is gonna Increase to 0.15$! a Pullback Might happen before ascending further.
Summery:
-TRX has Done a Bullish Break out From Symmetrical Triangle.
-Price is gonna Reach 0.15$.
-a Pullback might happen.
Previous Analysis:
💎Traders, if you liked this idea or have your opinion on it, write in the comments, We will be glad.
Things can change...
The markets are always changing and even with all these signals, the market changes tend to be strong and fast!!
Thank you for seeing idea .
Have a nice day and Good luck
