TRY (Turkish Lira)
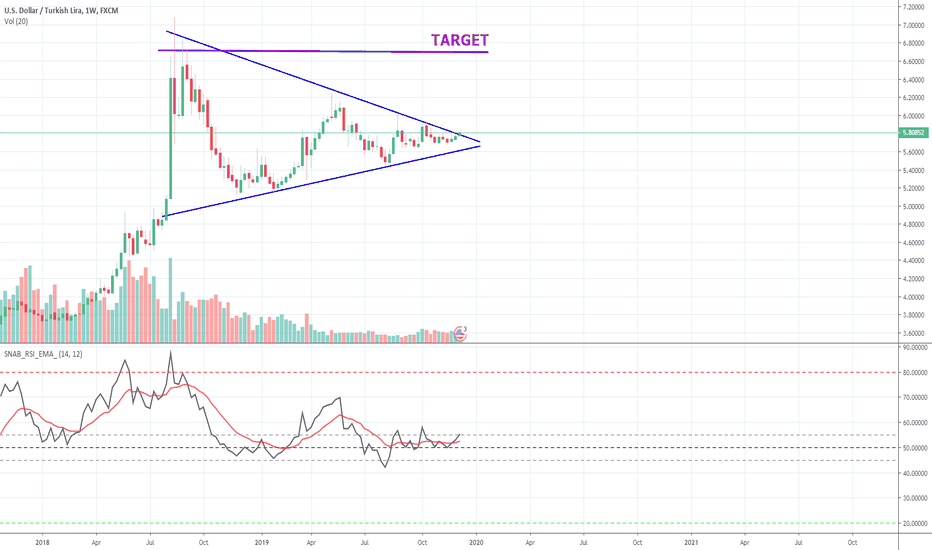
USDTRY - LONG (Gradual)Our risk / reward ratio is 0.28 in the first field and 0.09 in the second field.
There was a close above 5.84.
Long positions can be tried in small lots.
However, losses can be a bit high since the bar cannot be sure without closing, so stoploss should be placed directly at 5.81 or 5.84.
Our sales level for the first area is 6.095.
If the first area breaks down, our sales level is 6.56.
Market News and Charts for August 12, 2019USD/TRY
The pair was seen trading at the tip of the “Falling Wedge” pattern and was expected to continue going down in the following days. The 2016 failed Turkish coup attempt started the end of the relationship between the United States and Turkey. The coup was led by U.S.-based preacher Fethullah Gulen within the Turkish military. Three (3) years after the failed coup, Turkey had its first delivery of the Russian S-400 missile defense system, which the U.S. allies said will compromise the defense sharing agreement of the NATO (North Atlantic Treaty Organization) Alliance. The second batch of delivery was expected to be finish this August. Aside from this, Turkey is mulling to purchase Russian SU-35 fighter jets after the U.S. expelled Turkey from the F-35 fighter jet program in response to its acquisition of Russia’s S-400. However, the Turkey-U.S. relationship might enter into a new low after Turkey loaned $1 billion from China.
TOPSY-TURVY TURKEY? $TURInteresting to note that despite the nice gains Turkish equities saw in January 2019 (+15.7%) to make up for December 2018 (-6.87%), the asset class has experienced some nasty losses in February (-3.63%) and March (-4.36% so far) - all of which are quickly eroding all YTD gains.
Its the only EM market to have suffered such losses so far (rivaling that of South Africa). To add insult to injury, it appears that Turkish equities have had great difficult trying to break through its 50-Day EMA as well, indicating global equity investors are loosing faith in Turkish equities.
To complicate matters even further, the Turkisk Lira (USD/TRY) has been down 3.46% against the US Dollar so far in 2019, putting further stress on the currency.
In continuation from last year, it may mean that markets are trying to tell us something about the health of the Turkish economy for 2019. As global investors continue to shed Turkish assets throughout 2019, this is one space investors should be very wary of investing in over the next little while.
We recommend caution against Turkish assets.
TOPSY-TURVY TURKEY? $TUR $TRYUSDInteresting to note that despite the nice gains Turkish equities saw in January 2019 (+15.7%) to make up for December 2018 (-6.87%), the asset class has experienced some nasty losses in February (-3.63%) and March (-4.36% so far) - all of which are quickly eroding all YTD gains.
Its the only EM market to have suffered such losses so far (rivaling that of South Africa). To add insult to injury, it appears that Turkish equities have had great difficult trying to break through its 50-Day EMA as well, indicating global equity investors are loosing faith in Turkish equities.
To complicate matters even further, the Turkisk Lira (USD/TRY) has been down 3.46% against the US Dollar so far in 2019, putting further stress on the currency.
In continuation from last year, it may mean that markets are trying to tell us something about the health of the Turkish economy for 2019. As global investors continue to shed Turkish assets throughout 2019, this is one space investors should be very wary of investing in over the next little while.
We recommend caution against Turkish assets.
TRY/JPY - Incoming DropTRY/JPY is currently weak and could potentially break it's bullish support and fall further down.
Place your SL above the high of the current consolidation zone.
To play it safe, one can simply place a Stop Sell order right below the 50 EMA on the 6H chart or simply the current support line to catch the move as it breaks its current support.
I would personally not risk more than 1% on this trade.
Trade safe.


