TSLA Bullish Price Movement. Price has broken a long term trendline and came to retest and then advanced higher. Expecting price to continue advancing higher.
Tesla Motors (TSLA)

$TSLA – Base Breakout Setup with Dual Entry StrategyTesla ( NASDAQ:TSLA ) is coiling up, forming a classic base breakout setup with a dual approach for traders who want precision:
🔹 Support Zone Entry (280-285)
Shaded area = the zone between the 9 EMA (blue) and 20 EMA (yellow) — a key dynamic support area.
I'm taking a starter position here with a stop just below yesterday's low for tight risk control.
🔹 Breakout Confirmation (Above 295)
Full size only if we see a clean breakout above $295, confirming momentum.
This is where I’ll add size, looking for a strong continuation.
🔹 Execution Plan
Starter position: Shares and options at support zone ($280-$285).
Full position: Add at breakout ($295) with a mix of shares and options.
Risk: Tight stop below yesterday's low for the starter position.
⚠️ Risk Management: Always respect your stops — discipline over hope.

Tesla Shares (TSLA) Hit Two-Month HighTesla Shares (TSLA) Hit Two-Month High
During Friday’s trading session, Tesla shares briefly rose above the $300 mark — the first time in over two months. Although the daily candle closed below this key psychological level, TSLA still outperformed the broader stock market.
This move was supported by:
→ Investor approval of Elon Musk’s late-April pledge to spend less time on the Department of Government Efficiency (DOGE) and focus more on his role at the company.
→ A recent announcement from the Trump administration regarding a trade deal with the UK, alongside hints that more agreements may follow — potentially alluding to US-China negotiations.
Technical Analysis of TSLA Shares
In our previous analysis of TSLA’s stock price, we:
→ Highlighted the key support level around $220, which prevented deeper declines in early April even as broader indices saw more bearish trends;
→ Identified a descending channel (marked in red).
This channel remains relevant for now, but the price has already approached its upper boundary. It’s reasonable to assume that this level could act as resistance — similar to the midline of the channel (as indicated by arrows) — especially when reinforced by the psychological $300 level.
However, bulls may find strong support from any further details on a US-China trade deal (as discussed earlier today). A bullish breakout of the red channel in the coming days cannot be ruled out, potentially confirming the relative strength of TSLA stock and extending the trajectory marked by the blue lines.
This article represents the opinion of the Companies operating under the FXOpen brand only. It is not to be construed as an offer, solicitation, or recommendation with respect to products and services provided by the Companies operating under the FXOpen brand, nor is it to be considered financial advice.

OptionsMastery: Looking for an immediate buy on TSLA! 📣Make sure to watch fullscreen!📣
Thank you as always for watching my videos. I hope that you learned something very educational! Please feel free to like, share, and comment on this post. Remember only risk what you are willing to lose. Trading is very risky but it can change your life!

SPY WEEKLY 12 MAY 2025Welcome to Spy weekly. I have tried my best to explain the price action here. If you have any doubts, feel free to leave a comment or DM me.
NOTESTAY AWAY FROM OPTIONS

Tesla Euphoria to Capitulation and Back AgainOver the past 12 months, Tesla’s price action reads like a three-act drama:
Euphoria (Nov ’24 – Dec ’24)
Rampant Breakout: After a multi-month range, TSLA erupted from low-20s to a peak near $42, driven by record deliveries and renewed growth optimism.
Blue Zone Strength: The blue-shaded sessions on the right highlight a powerful institutional bid, lifting price steadily with few pullbacks.
Capitulation (Jan ’25 – Mar ’25)
Profit Taking & Macro Headwinds: Q4 earnings misses, rising rates, and softer comps triggered a swift retreat. TSLA plunged from $40 to sub-$10 in roughly ten weeks—an 80% drawdown that shook even the most ardent bulls.
Failed Bounce Attempts: Multiple red “S” markers at lower highs underscored sellers’ resolve, hammering out a vicious downtrend.
Accumulation & Base Building (Mar ’25 – May ’25)
Triple Bottom Formation: Notice the three “bottom” labels around $6.13 (the P0 pivot and prior yearly low). Each test showed shrinking volatility and thinner red candles, classic signs of selling exhaustion.
Dynamic Support Holds: The turquoise dots hugging the lows trace TSLA’s dynamic falling-wedge support. By early April, price chopped sideways in a $6–$10 band, consolidating losses.
2. Technical Set-Up: A Coiled Spring
As of today, TSLA has climbed back to $11.34, probing critical pivots:
Near-term Resistance:
Monday’s High (~$11.85) – the first hurdle for bulls. A decisive break above would flip short-term supply into demand.
Dynamic Fib Resistance (~$10.35 & $9.96) – these falling-wedge levels have already been cleared, validating the nascent turn.
Support Floors:
Monday’s Low (~$10.35) – now a springboard for buyers.
Base of the Wedge (~$6.13) – every retest here was met with bids, marking a reliable long-entry zone on deep pullbacks.
Volume & Momentum:
Recent green candles have come on elevated volume relative to March lows, suggesting fresh participation.
The slope of higher lows in the turquoise dynamic support dots indicates improving momentum across daily and 5 m timeframes.
3. Market Sentiment & Catalysts
Earnings & Guidance: With Tesla’s Q1 numbers due in the next two weeks, earnings season could be the spark that sends TSLA either flying through $12 or knocking it back to the wedge.
Macro Backdrop:
Rate Outlook: Any dovish pivot from the Fed could flood liquidity back into “growth-at-a-reasonable-price” names like TSLA.
EV Adoption Narrative: New model announcements or manufacturing milestones (e.g., Cybertruck ramp) would reinforce the long thesis.
4. Strategic Takeaways
Aggressive Players: A break and close above $11.85–$12.00 on daily charts could be used as a fresh long trigger, targeting $14 (year-open pivot) and then $18–$20 as institutional accumulation zones.
Risk-Managed Entries:
Pullback Buyers: A retrace to the former Monday low (~$10.35) is a lower-risk entry with a stop just under $9.95 (the next dynamic fib level).
Option Plays: For defined risk, out-of-the-money calls near $12 expiring in 4–6 weeks may capture an earnings-driven surge.
Defensive Stance: If price fails at $11.85 and closes back below $10.35, the pattern risks returning to the base at $8–$9, so profits should be booked or stops widened accordingly.
5. Conclusion: Coiled for a Move
After the brutal drawdown earlier this year, Tesla’s chart now portrays a textbook falling-wedge resolution into a higher-low base, punctuated by multiple “bottom” labels and dynamic support tests. Approaching the $12 threshold, the stock is coiled like a spring: either it unleashes into a new leg up toward $14+ on strong participation, or it reverses into a tighter range, offering fresh long entries nearer $10.
In short: TSLA’s journey from euphoria to despair and through disciplined accumulation has set the stage for its next directional verdict. Watch $11.85–$12.00—and manage risk around the former week’s pivots—to navigate what could be a decisive inflection in Tesla’s 2025 saga.

$SPX Urgent! My <3 & My Soul: Slow Bleed Crash to 3k by Q4 26' Do be warned. Very important post here. I put my heart and soul into this. I made a video earlier and then it got deleted by accident, so I made a less happy one right after. I've got news for all the bulls and investors out there that feel they will be able to continue buying every single dip out there. Get ready for the dip that keeps dipping. Big names already cracking heavy. NASDAQ:META NASDAQ:TSLA NASDAQ:AMD NASDAQ:NVDA to name a few. Big tech is getting cleaned out and layoffs are on the rise. Tariffs create huge amounts of uncertainty. I don't feel like this is rocket science. Buffet is all cash. 89% of Hedge Fund managers believe the US market is the most expensive its ever been and Tutes have been selling at the highest rate ever before. I think it's time the US finally gets a shake down. Bullish conditioning has been running rampant, and I've seen Social Media Accounts discourage charting and only paying attention to price action? Price action involves the entire collective, not just one Timeframe. Anyways, here's an overlay from 01' ... the only one I could find that matches. Says short 560 around May 7th and then take profits around 500 again. Let's make this a nice one. Calls till 560 into May then flip to Puts into June. From then short 530 every time you can. $450 is My first target after we break previous lows. I will update as we go. Have a good one yall.

Trade Idea: $MSFT Short to $418 and beyond into JuneTriple bearish divergence is evident on Volume, RSI, and Momentum. The 9-count sell signal on the daily chart further supports the likelihood of a sell-off at this point. If the price falls below $425, a swift decline to $418 is anticipated, where the true test of the Fair Value Gap (FVG) below will occur. The Fair Value Gap open is at $392.45. Stop would be above yesterday's high at $439.50 ...

TESLA Set To Fall! SELL!
My dear subscribers,
This is my opinion on the TESLA next move:
The instrument tests an important psychological level 298.27
Bias - Bearish
Technical Indicators: Supper Trend gives a precise Bearish signal, while Pivot Point HL predicts price changes and potential reversals in the market.
Target - 288.52
About Used Indicators:
On the subsequent day, trading above the pivot point is thought to indicate ongoing bullish sentiment, while trading below the pivot point indicates bearish sentiment.
Disclosure: I am part of Trade Nation's Influencer program and receive a monthly fee for using their TradingView charts in my analysis.
———————————
WISH YOU ALL LUCK

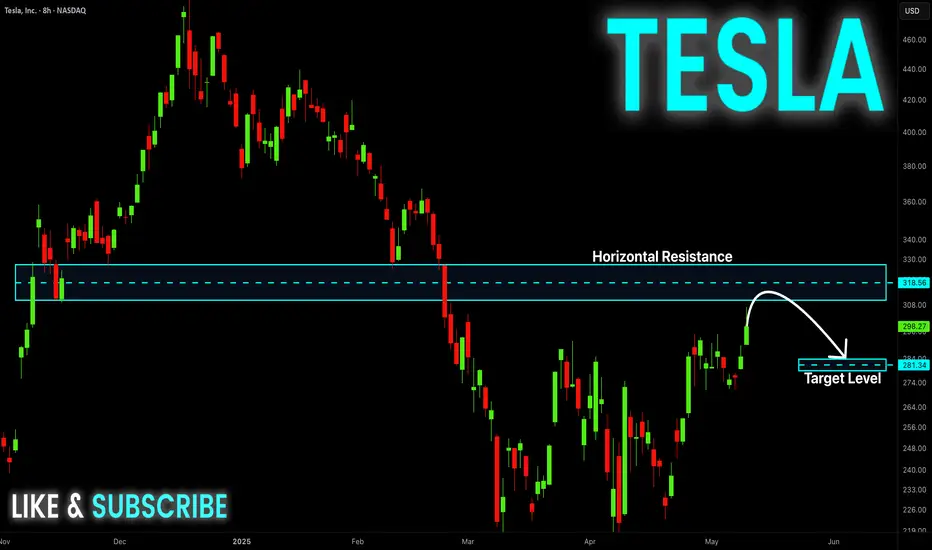
TESLA Resistance Ahead! Sell!
Hello,Traders!
TESLA stock is growing
And we are bullish biased
Mid-term but the price is
About to hit a horizontal
Resistance of 322.00$
So after the retest we
Will be expecting a local
Bearish correction
Sell!
Comment and subscribe to help us grow!
Check out other forecasts below too!
Disclosure: I am part of Trade Nation's Influencer program and receive a monthly fee for using their TradingView charts in my analysis.
Stock Market Forecast | TSLA NVDA AAPL AMZN META MSFTStock Market Forecast | CME_MINI:NQ1! NASDAQ:QQQ AMEX:SPY CME_MINI:ES1!
Mag 7 Forecast | NASDAQ:TSLA NASDAQ:NVDA AAPL AMZN META MSFT GOOG

TESLA: Short Trade with Entry/SL/TP
TESLA
- Classic bearish formation
- Our team expects fall
SUGGESTED TRADE:
Swing Trade
Sell TESLA
Entry Level - 298.27
Sl - 310.31
Tp - 265.48
Our Risk - 1%
Start protection of your profits from lower levels
Disclosure: I am part of Trade Nation's Influencer program and receive a monthly fee for using their TradingView charts in my analysis.
❤️ Please, support our work with like & comment! ❤️

HUGE +1,522% in 2 days from $0.61 to $9.90 $ASSTIt was clear from the very start this one will go insane because of the volume. It traded 315 million shares on first day when I posted about it. I sent out a message premarket at the very beginning of the move and it already had tens of millions of shares volume at that time.
Then the next day it got to 241 million shares, you just don't see stuff like that in regular stocks.
Awesome profits made along the way, can't wait for a new catch like that!
NASDAQ:ASST

The Illusion of Value: How the U.S. Market Became a Fantasy EconThe Illusion of Value: How the U.S. Market Became a Fantasy Economy
For decades, the American economy has been celebrated as the epicenter of innovation, wealth creation, and corporate success. But beneath the surface, an unsettling reality has emerged: The U.S. financial markets are increasingly driven by speculation, hype, and a distorted sense of value.
"Buy Now, Pay Later"—A Culture of Delusion
One of the most glaring symptoms of this detachment from reality is the widespread adoption of "Buy Now, Pay Later" (BNPL) services. A staggering number of American consumers have embraced debt-financed spending as a normal part of life. Credit cards are no longer the primary vehicle for financial mismanagement—BNPL systems have convinced people they can afford luxuries they fundamentally cannot.
This mentality, in turn, feeds into the stock market’s obsession with future promises over actual output. Investors have become infatuated with narratives rather than numbers, driving valuations to unrealistic highs for companies that either underdeliver or simply do nothing at all.
The MicroStrategy Paradox: Borrowing Money to Buy Bitcoin
Take MicroStrategy, for example—a company whose sole business model seems to be leveraging borrowed capital to buy Bitcoin. By traditional metrics, MicroStrategy offers no tangible product, no innovative service, no groundbreaking technology—just speculative accumulation. Yet, thanks to Bitcoin hype, its stock price is valued as if it’s a revolutionary player in the corporate world.
This irrational valuation mirrors the broader issue with American markets: Companies are being rewarded not for what they actually do, but for the financial games they play.
The Myth of Overvalued Titans: Tesla & Meta
Tesla and Meta serve as the poster children of speculative overvaluation.
- Tesla: Once hailed as an automotive disruptor, Tesla’s stock price often reflects what Elon Musk promises rather than what Tesla delivers. From self-driving software that never fully materialized to mass production goals that fell flat, Tesla’s ability to sustain its valuation relies more on Musk’s cult-like following than automotive success. Meanwhile, the gutting of regulatory oversight has allowed Tesla to push unfinished, potentially hazardous products into the market.
- Meta: Meta’s valuation has ballooned largely on the promise of virtual reality dominance. Yet, billions poured into the Metaverse have yielded little beyond overpriced VR headsets and gimmicky social spaces.
Elon Musk: The Master of Market Manipulation
Elon Musk’s influence on financial markets cannot be overstated. Through cryptic tweets, grand promises, and regulatory maneuvering, Musk has become a force powerful enough to shift markets with mere words. Whether it’s pumping Dogecoin, slashing Tesla’s safety oversight, or influencing government policy for personal gain, Musk operates in a reality where market value is dictated by his persona rather than corporate fundamentals.
The Rise of True Value Markets
While the U.S. economy indulges in financial fantasy, other global markets have started to present compelling opportunities:
- Europe: A more realistic, fundamentals-based approach to valuation is emerging. Traditional industries remain resilient, and companies must show actual profitability to attract investment.
- China: Despite regulatory challenges, China’s focus on industrial production, technological advancement, and infrastructure development gives its economy a sense of tangible progress.
- UK & Australia: Unlike the speculative U.S. markets, these economies remain grounded in earnings, productivity, and rational valuations.
Conclusion
The American financial landscape has become a speculative playground detached from reality. Companies are valued not for what they produce, but for what they promise, what they borrow, and what narratives they spin. Figures like Musk exploit market sentiment, while deregulation enables corporations to operate recklessly. As Europe, China, the UK, and Australia foster economies built on real value, the U.S. is at risk of crashing under the weight of its illusions.
SP:SPX TVC:DXY INDEX:BTCUSD TVC:GOLD NASDAQ:MSTR NASDAQ:TSLA NYSE:BLK NASDAQ:META XETR:DAX FTSE:UKX TVC:HSI SET:SQ NASDAQ:PYPL NASDAQ:AFRM NASDAQ:AAPL NASDAQ:AMZN NASDAQ:NVDA NASDAQ:COIN NASDAQ:HOOD

$SPY Its time according to my chart.. Lower high is the trigger I posted two charts for reference to the current situation. With a historic rally right into resistance and a fractal analog that matches, I have no choice but to remain bearish. These are my studies. Sometimes Impatience leads to things like Impulsive Entries and Exits, Revenge Trading, and at times, even Blown Accounts. Times like those should be followed by a regroup and a reset.
The 9 Count Sell Signal Triggered with a Reset is on Technical Inidators for a move lower. I do believe we are going to consolidate for several days but nothing further than the second week of May. Today Bulls got extremely bullish and still were not able to hold the highs into the close. The test of the 200 day SMA was rejected and several days near these leveles whether above or below, would prove the downside move more possible. The monthly on SPX is my biggest indicator, personally. If it follows the pattern I'm following then after a test of the 10WMA, we will roll back over on the next 10 day candle. The market ran through a death cross without stopping, which if anyone were to study for several minutes, they would be able to see any first attempt at a death cross to the upsde is almost immediately met with a selloff back to the lows of the breakout move. Good luck everybody.

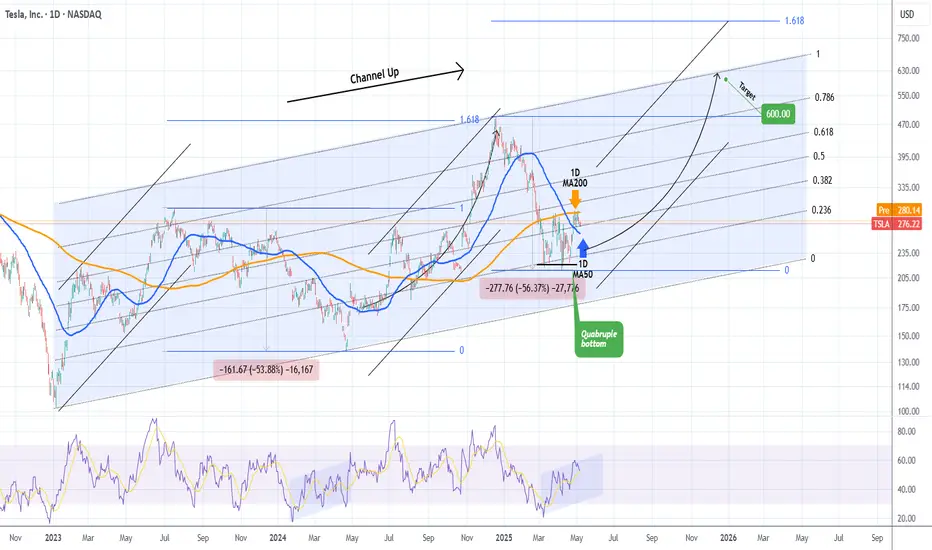
TESLA Is a $600 price tag a pipe dream?Tesla (TSLA) is seeing a steady recovery from the April 21 2025 Low, which has been a Quadruple Bottom, and has found itself consolidating the last 10 days within the 1D MA200 (orange trend-line) and the 1D MA50 (blue trend-line).
The 2.5 year pattern is a Channel Up and this Quadruple Bottom took place exactly on its 0.236 Fibonacci level, with a 1D RSI sequence that resembles the Bullish Divergence of its previous bottom on April 22 2024. The similarities don't stop there as the Bearish Legs that led to those bottoms have almost been identical (-53.88% and -56.37% respectively).
As a result we can technically assume that the current Bullish Leg that will be confirmed with a break above the 1D MA200, will be symmetrical to the previous one, which made a Higher High on the 1.618 Fibonacci extension from the bottom. That is now at $823 but falls outside of the 2.5-year Channel Up, so our long-term Target for the end of the year is $600, which is right at the top of the pattern.
-------------------------------------------------------------------------------
** Please LIKE 👍, FOLLOW ✅, SHARE 🙌 and COMMENT ✍ if you enjoy this idea! Also share your ideas and charts in the comments section below! This is best way to keep it relevant, support us, keep the content here free and allow the idea to reach as many people as possible. **
-------------------------------------------------------------------------------
💸💸💸💸💸💸
👇 👇 👇 👇 👇 👇
Tesla - TSLA - moving to $328 Step on up, buy your July Tesla $330 calls! Right here folks, step on up!
Tesla about to surge, what will the NPC News say is the reason? Tariff Deal?
GO Murrey
GO Elliott
GO Gann
GO Kumar

Tesla Target: $1500Tesla Mega Setup Alert
NASDAQ:TSLA is forming a rare double cup & handle on monthly chart
Accumulation phase ending
Entry zone: $270–280
Target: $1500–$2000 in 2 years
10x potential if structure plays out!
Don't blink 👀
#Tesla #TSLA #ElonMusk #StockMarket #Investing

BMW: Stability, Innovation, and Opportunity in a Changing WorldIn times of market turbulence, great opportunities often lie hidden beneath temporary setbacks. Recent tariff-related ripples may have rattled BMW’s price, but for those looking to invest for the long haul, this dip is a golden opportunity to buy into one of the world’s most reliable automakers.
www.youtube.com
Resilient Amid Tariff Turbulence
Global trade frictions and tariff uncertainties have impacted many companies, and BMW is no exception. Yet, unlike many peers that retreat during such times, BMW remains steadfast—confident in its strategy and outlook. With industry insiders predicting that these tariffs are only temporary, BMW’s fundamentals remain ironclad. Its robust global presence and proactive planning have positioned it to weather these short-term shocks and bounce back stronger.
A Diverse, Future-Ready Product Lineup
While some high-profile names in the auto space chase trends with empty promises, BMW consistently delivers. Rather than focusing solely on electric vehicles like Tesla, BMW offers a balanced portfolio:
- Low-Emission Fossil Fuel Cars: Advanced, efficient engines that still serve a significant market segment.
- Hybrid and Electric Vehicles: Designed for the evolving demand for cleaner mobility, these models blend performance with environmental responsibility.
- Pioneering Hydrogen Technology: In collaboration with strategic partners, BMW is blazing a trail in hydrogen-powered vehicles—a potential game changer that ensures adaptability as the energy landscape shifts.
This diverse lineup not only meets current market needs but also positions BMW at the forefront of future mobility, delivering real, tangible products that work.
World-Class Manufacturing and Advanced Robotics
BMW’s reputation for engineering excellence isn’t just about beautiful design—it’s rooted in its state-of-the-art manufacturing. The company has embraced advanced robotics and automation, ensuring precision, efficiency, and consistent quality. With production facilities spanning the globe—including significant plants in the United States—BMW solidifies its stature as a truly international enterprise.
A Stable, Dividend-Paying Investment
In a market that often rewards volatile “meme” stocks and empty promises, BMW stands apart as a beacon of stability. Unlike Tesla, which currently pays no dividends, BMW offers a juicy dividend yield of over 5%, providing investors with regular, attractive returns. This dividend, coupled with its solid operational fundamentals, makes BMW a safe bet—one that rewards shareholders consistently even during turbulent times.
The Time to Invest Is Now
BMW is more than just a carmaker—it’s a symbol of resilience, innovation, and pragmatic progress. While market chatter may cast doubt amid temporary tariff-induced lows, the company’s diversified product mix, global manufacturing footprint, and commitment to delivering real, advanced technology create a compelling investment thesis.
For investors seeking stability, reliability, and the promise of long-term growth, BMW offers an opportunity to ride out the storm and benefit from a future where the company’s innovations in hybrids, electrics, and hydrogen continue to shape mobility worldwide. Now is the time to look beyond short-term market jitters and invest in a legacy built on quality, performance, and consistent returns.
Embrace the opportunity—BMW’s bright future is not just a promise; it’s already in motion.
XETR:BMW SIX:BMW NASDAQ:TSLA NYSE:GM NYSE:F

AMD BULLISH MAY6TH 2025AMD has its earnings today & I am bullish as per the price action. I have managed my risk, and I am long irrespective of any news. I have discussed in depth analysis of AMD. If you have any questions, feel free to leave a comment below.
NOTE: I AM LONG ONLY WITH STOCKS

Tesla Grabbing Liquidity Market Context 🚩
1-Month Move: +7.3% (from $261.30)
1-Year Move: +45.6% (from $192.50)
Technicals
RSI: ~68.4 (nearing overbought )
Moving Averages: Above 20-day, 50-day, and 200-day MAs (uptrend, but showing signs of exhaustion )
MACD: Bearish crossover forming (momentum fading, potential pullback )
Trade Setup
Instrument: TSLA ❌
Direction: PUT
Entry Price: $280.21
Take Profit 1 (TP1): $270.00 (~3.6% gain ) 🟢
Take Profit 2 (TP2): $260.00 (~7.2% gain ) 🟢
Expected Move: ~8–10% downward
Best AI Signals on the market.

TSLA Eiffel Tower Not CompleteEiffel tower patterns are rare but very powerful TA structures when they develop.
They are very hard patterns to short since we can never know when the wave up ends. However, there is so much information we can extract from them during and after the collapse.
When they are rising and going vertical, and you happen to be in it. The benefits will be great! As the price action sucks in everyone all at once with virtually no sellers.
So, what info can we learn?
On the way up, when this is happening, you should have the ability to recognize it at some point without worrying if you got the top. Take your money and RUN!
Never try to get back in and try to chase it up!
Never try to short it, thinking it is too high, this is the top!
When it tops out, never buy the dip! Bc you know how this structure will end.
Never buy based on some silly FIB or bc it's down too much!
Never buy the base thinking it will go back to new all-time highs, and it is now safe to get back in bc it will only keep going lower, more through time, frustrating you until you puke it up.
So remember this gimmicky sound bite.
"If they don't scare you out, they will wear you out!"
Ain't nobody got time for that! Your money has a much better place to be allocated to make you money instead of being fixated on a chart like this.
The reason people get stuck is bc the move provoked emotion! Then, when they get involved thinking they will be Buffett tomorrow from this one trade, they will experience Euphoria, sadness, anger etc., further provoking even more emotions to the point they become obsessed! Guessing, waiting, hoping, doubling down on and on...
Ask me how I know! hahaha!
While I made a lot of money shorting GME, here is an example of an Eiffel tower with many, many people that have this trading disease I just spoke about.
In conclusion, anyone who believes that TSLA will hit $1,000 blah blah blah and suckered into buying it. You now know you are being honey dicked by a bunch of armatures and bots on X. Beyond TSLA there are many such charts out there tight now that have formed the beginnings of ET. As such, you should know how to recognize it quickly and avoid the pitfalls out there.FYI I called the Top on TSLA ))
Click Like, Follow, Subscribe to learn much more about real macroeconomics and technical analysis. Let me help you navigate these crazy markets.

$MSFT BEST TRADE EVER? SUB $400 incoming by Mid JuneHey everybody, I hope that rally didn't kick your arses the way it did mine. You know, it's like I'm allergic to taking upside atm due to how bearish the MACRO is. Of course, with time, I'm going to assume I get most of my downside Price Targets in the next several years.
If you refer to the previous 23% Run to the 200DMA from the 50day in 2023 , NASDAQ:MSFT produced a 9 COUNT SELL SIGNAL , RALLIED for a week, and then dropped to new lows. That is what I am expecting here.
NASDAQ:MSFT looks absolutely ripe for the taking. We just rallied 17% and got the 9 COUNT SELL SIGNAL . Mind you, Gaps galore below. The Monthly and the Weekly both have Gaps . Charts do not like that, let me tell ya. I'm excited if you can't tell. NASDAQ:META and NASDAQ:AVGO look great as well. I'm still cautious about a spike out but I figure if we continue higher, i will have opportunity to grab more for cheaper as I am very confident in this move. The price moved above the DEATH CROSS and above the 200DMA . Not ever a healthy move if it moves Vertically from the 50 day and Crosses above both MA's without a stop. Mid June NASDAQ:MSFT should be at new lows.
