TSLA Day Trade Plan for 04/29/2025TSLA Day Trade Plan for 04/29/2025
📈 299 305
📉 274.50 268.50
Thanks to all my followers! Truly appreciate the support!
Please like and share for more ES/NQ levels Tues & Thurs 🤓📈📉🎯💰
*These levels are derived from comprehensive backtesting and research and a quantitative system demonstrating high accuracy. This statistical foundation suggests that price movements are likely to exceed initial estimates.*
Tesla Motors (TSLA)

If you think the 2025 bottom is in you couldn't be more wrongIf you think the bottom for 2025 is in and it's only up from here let me have what you're smoking.
Just a puff, please!
About 80% of social media retail traders are confidently calling a bottom, that's a major contrarian signal.
Herding equals danger!
If everyone is bullish, most are already positioned long leaving a few buyers to push prices higher.
It's known as "pain trade" where markets often move in the direction that causes the most discomfort.
Many of loudest voices are retail traders influencers chasing engagement, not portfolio managers or data driven strategists.
AMEX:SPY SP:SPX NASDAQ:QQQ AMEX:DIA NASDAQ:META NASDAQ:NVDA NASDAQ:MSFT NASDAQ:GOOG NASDAQ:AAPL NASDAQ:AMZN

REJECTION OF $292Tesla's stock ( NASDAQ:TSLA ) has faced multiple rejections at key resistance levels. To establish a strong upward trend, it may require forming a triple bottom pattern. This would indicate a solid foundation for potential growth. It is anticipated that the stock will retest the $270 and $250 levels before making a decisive move.

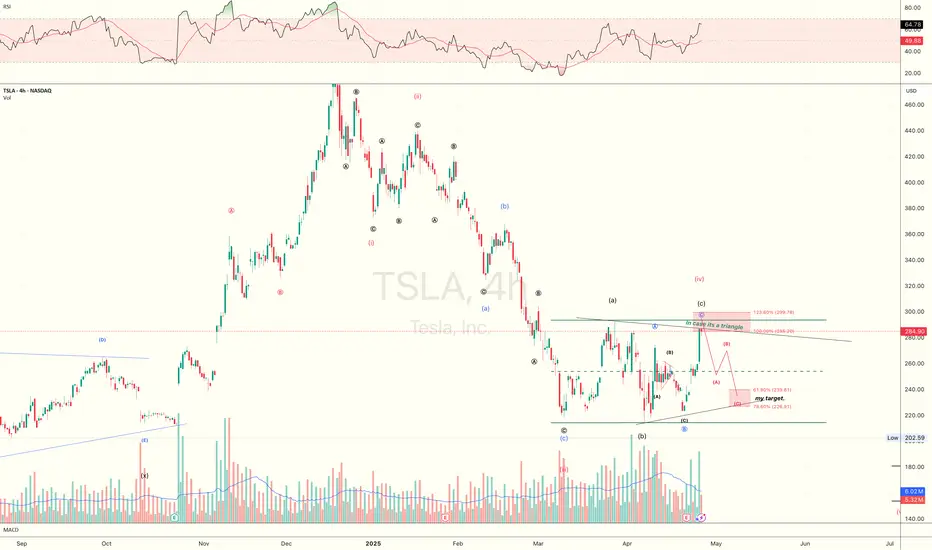
Tesla: More Room in Wave 4With the recent increases, TSLA approached the more significant local high from early April. Although we locate the price in a turquoise downtrend impulse, the internal corrective upward move of wave 4 still has some more room. With the following wave 5, the stock should then fall below the support at $215.01 to complete the magenta wave (3), which is also part of a downtrend impulse. Meanwhile, our alternative scenario suggests a much faster progression. We consider it 27% likely that with the low on April 7, the blue wave alt.(II) and thus the major corrective movement have already ended. In this case, the path would be clear for a new uptrend of the blue wave alt.(III), which would lead to increases above the resistance at $488.50. Primarily, however, we expect the corrective movement to conclude at a later time and at lower levels.

Is a Tesla Stock Rebound Imminent?Tesla's stock has recently faced volatility, partly due to first-quarter 2025 delivery figures that did not meet some market expectations. Despite this, several significant factors suggest a potential for upward movement in the share price. As the stock hovers around $292 in late April 2025, market observers are closely watching for catalysts that could shift sentiment and drive value appreciation for the electric vehicle and energy company.
Key indicators pointing towards a potential rebound include notable insider activity and the highly anticipated launch of a dedicated robotaxi service. A Tesla board member and Airbnb co-founder recently purchased over $1 million in TSLA stock, marking the first insider buy of this magnitude in approximately five years. This action signals strong internal confidence. Furthermore, the planned June launch of a robotaxi service in Austin, Texas, using autonomous Model Y vehicles, is viewed as a transformative step that could open substantial new revenue streams and redefine Tesla's market position.
Adding to the bullish sentiment is unusual activity in the options market, where a significant investor placed a large bet on a substantial price increase in the near term through out-of-the-money call options. While recent delivery misses and concerns regarding external factors have contributed to past stock pressure, the combination of insider conviction, a looming disruptive service launch, and aggressive bullish options trading suggests that the market may be poised for a significant reaction to upcoming positive developments. Investors are keenly focused on the successful execution of the robotaxi strategy as a critical determinant of future stock performance.

TSLA Potential Post Tariff Resolution Bullish RallyDespite uncertainty still looming over the current global tariff based environment, TSLA price still seems to exhibit signs of a potential Bullish breakout as the price action may form a prominent Higher Low on the longer timeframes with multiple confluences through key Fibonacci and Support levels which presents us with a potential Non-Leverage hold opportunity.
Entry: CMP 292
Stop Loss: 90 or 0 (depends on trading style as Non-Leverage Buy & Hold is recommended)
Potential Range for Targets: 470 - 550

Daily Price Action: TSLA Tuesday 4/29/2025In this video, we will be looking into the potential price action TSLA.

Tesla Faces Key Technical Hurdle Near $288Tesla shares have rebounded sharply from April’s low, but the rally is now stalling near a confluence of resistance:
🔴 $288.20 = February swing high
🔵 Price testing the 200-day SMA (~$291) from below
📈 MACD remains positive but momentum is flattening
📊 RSI at 58 – bullish but not yet overbought
A clean breakout above $288–291 would likely confirm a medium-term trend reversal, exposing upside toward $310 and possibly $340. Failure to break could see Tesla consolidate or fade back toward the 50-day SMA (~$268).
Keep an eye on volume and follow-through in the next couple of sessions.
-MW

Another leg up? TSLA loaded wedgeLooking like it’s consolidating. Looking for another leg up if we get momentum.
Entry is my green ray. We have robotaxi info from last ER, I think it’s ready to move again. Not FA! But let me know what you think!

TESLA Will Collapse! SELL!
My dear subscribers,
TESLA looks like it will make a good move, and here are the details:
The market is trading on 284.90 pivot level.
Bias - Bearish
My Stop Loss - 295.68
Technical Indicators: Both Super Trend & Pivot HL indicate a highly probable Bearish continuation.
Target - 265.94
About Used Indicators:
The average true range (ATR) plays an important role in 'Supertrend' as the indicator uses ATR to calculate its value. The ATR indicator signals the degree of price volatility.
Disclosure: I am part of Trade Nation's Influencer program and receive a monthly fee for using their TradingView charts in my analysis.
———————————
WISH YOU ALL LUCK

$TSLA back to $148-155 before correction is overDespite the bounce over the last few days, TSLA's price action is still bearish overall.
I think it's likely that we find resistance here or at $290, and then work our way back down to the lower support levels at $148-155.
I think once we get down to those levels, it'll be a good long term buy and we can see price go back to $700+.

Did Redditors make any money on TSLA?I thought I read that NASDAQ:TSLA was going down and Elon was going broke. Earnings were going to assure it. Looks like it came and went and instead went bullish. Oh well, you can't rely on narratives: Only Technicals!
The 218.65 Volume Profile Level has been holding TSLA up for weeks now. Great long by the way. And as long as it holds the next major VP level would be 183.63.
Now though TSLA is caught in a range and this does seem to be the top. If haters had just waited for a signal instead of trading on emotions they could have played this short from a higher price and with Earnings IV crush already over.

TSLA: Low Is In , Rally IncomingTSLA is showing signs of strong accumulation, with buyers consistently stepping in and volume expanding on up-moves. Price structure is improving, breakouts further confirm strength, increasing the likelihood that bears have been left behind. Based on the price action and volume alone, TSLA looks ready for a potential sustained move higher.

Tesla is Going to 303 + Looks like Tesla is going to 303 or possibly higher
Kris/Mindbloome Exchange
Trade Smarter Live Better

$SPX Sell in May, Go Away, $5k, Dead Cat to $5.3k, $4.8k by EOMAlrighty. My forecast is as follows. I made a video explaining just a quick thought and here's the video in a written version for the most part. Basically, I'm a pattern chart trader and I spend the majority of my days looking for specific candlestick patterns that match candle for candle. I cannot find anything remotely close to today's Price Action besides October 2001. I have been and will continue to be doubted and that's okay. I am not here for anyone except myself and anyone that wants to gain a fresh unbiased perspective. People have called me a Permabear but that only pertains to my personality, which is that of a realist. I do not believe investing for the next 20-50 Years will work for everyone. You'd have to do it well and continuously contribute even during the down days. Either way. This is the analog I will be following. Fib is Extended way beyond Blow Off Top measurements imo. The market gained 50% in One Year and Three Months. I'd like to think that the uncertainty being priced in will cause these Deeper Fib Retracements. We already crashed down to the 1.61 GOLDEN POCKET from above and now bounce back to Secon Golden Pocket at 2.61. Based on the past behavior, now we move back to 2.0 for a move to the original extension of the 1.00 Fib. If we lose this, we start moving back to the 1.27 near $4.74k on SPX where I will then be looking for one final dead cat to $5300 by mid August, Every July dip being grabbed up ... Final Sell in August for an End of Year Crash to Mark 2025 as one of the worst years ever in Life as far as the Market goes. Good Luck everyone. Tips always welcome.

TESLA: Short Trade Explained
TESLA
- Classic bearish formation
- Our team expects pullback
SUGGESTED TRADE:
Swing Trade
Short TESLA
Entry - 284.90
Sl - 298.09
Tp - 256.85
Our Risk - 1%
Start protection of your profits from lower levels
Disclosure: I am part of Trade Nation's Influencer program and receive a monthly fee for using their TradingView charts in my analysis.
❤️ Please, support our work with like & comment! ❤️

Was this the best buying opportunity since 2011?Sure, here's a rewritten version of your text in an engaging tone:
"Have you ever heard of the Zweig Breadth Thrust? Well, let me tell you, it’s an incredible metric that can really shed some light on the current market situation!
So, what would it take for me to believe that this bounce isn't just another bear market rally? My first step would be to dive into the breadth indicators and look for signs of that elusive breadth thrust.
Think of a breadth thrust like a rocket taking off. You need a strong initial boost to break free of gravity's grip. If the thrust is weak, the rocket can’t escape, and the same applies to stock market reversals. When we see a robust breadth thrust, that's a signal that a significant reversal is underway. Without it, we could be facing another false bounce.
Now, let’s talk numbers! As of Friday, April 25th, the SPX has surged an impressive 14.2% from its recent lows, and while that’s quite a leap, it’s essential to keep it in perspective. Just think back—this index was down 21.35% from its all-time high earlier in February during the panic sell-off. Now, with the recent strength, it’s only 10.75% off its peak.
The Zweig Breadth Thrust is calculated based on the 10-day EMA of NYSE Advances divided by the sum of Advances and Declines. A bullish signal pops up when the ZBT shifts from below 0.40 to above 0.615 within just ten days or less. Keep an eye on that—it might just help us navigate these choppy waters!"
On the monthly chart, it’s clear that what we’ve been seeing in the broader economy (you know, Main Street) is actually showing us some bearish divergence—a concept I've mentioned in my previous ideas.
Since 2009, we've had four notable instances on the Monthly chart where the ZBT dipped below 0.40, only to bounce back up past the 0.6 mark. Remember back in November 2011? That was when we got a significant signal with a low reading of 0.31, which climbed back to 0.62 by February 2013. That surge sparked a bull run that peaked in February 2020!
So, the takeaway here is that this breadth thrust is generating the positive momentum we need to reach new stock market highs this year. Exciting times ahead!

Either a triangle start forming or a flat just completed. $TSLAThe Friday bounce was huge and expected, but be really cautious as its very a typical Tesla move.
At this point, i believe the triangle to be complete in next 2-3weeks(likely), or a flat just complete(also acceptable though i'm leaning less toward this scenario).
And, I bought puts yesterday, let's see what this plays out.
Just sharing my honest thought here, feel free to challenge my view and post opposing counts, always willing to learn new knowledge.
𝗧𝗲𝘀𝗹𝗮 𝗕𝗿𝗲𝗮𝗱𝗸𝗼𝘄𝗻: Priced for perfectionPriced for perfection in an imperfect market
NASDAQ:TSLA nearly hit its 200dma and key resistance area (~288–292) after a roughly 20% post-earnings squeeze, and as long as it stays below that level, it risks retesting the long-term uptrend line that has marked major lows twice since COVID.
𝘛𝘢𝘳𝘪𝘧𝘧 𝘢𝘯𝘥 𝘴𝘶𝘱𝘱𝘭𝘺-𝘤𝘩𝘢𝘪𝘯 𝘳𝘪𝘴𝘬: Tesla depends heavily on Chinese-made battery and electronic components now hit by reciprocal U.S. tariffs, while over 60% of global neodymium and dysprosium—vital for its EV motors—are mined and processed only in China, creating a critical bottleneck that could sharply elevate its input costs.
𝘔𝘢𝘳𝘨𝘪𝘯 𝘱𝘳𝘦𝘴𝘴𝘶𝘳𝘦 𝘷𝘴. 𝘭𝘰𝘧𝘵𝘺 𝘷𝘢𝘭𝘶𝘢𝘵𝘪𝘰𝘯: Q1 price cuts of up to 20% on core models drove Tesla’s auto gross margin to its lowest since 2020, calling into question the sustainability of its >70× forward P/E multiple, which assumes exceptionally high profits from future ventures like robotics and autonomous fleets.
$NQ_F NASDAQ:NDX NASDAQ:QQQ NASDAQ:AMZN NASDAQ:META NASDAQ:NVDA NASDAQ:SOX $ES_F AMEX:SPY SP:SPX TVC:DXY NASDAQ:TLT TVC:TNX TVC:VIX #Stocks #TrumpTariffs 🇺🇸 #ChinaTariffs 🇨🇳

TSLA, the king of all meme stocksYesterday, Q1 earnings call. Stock misses earnings by 30% on already reduced expectations of 0.38. Had it been earnings expectations from a week before (which was 0.434), it would've missed by around 45%.
Still, the stock manages to rebound from mid 220s up to 257 in a single day (around 10%). It's impressive, but still looms a ceiling just up ahead (258-260) which I think is the perfect opportunity to short. Will be invalid if it manages to push up above 267.6 which is the local resistance line and a major historic resistance also.
That said. I think the odds are good in shorting around 258-260. Expecting a fall towards low 200s and even towards high 170s.

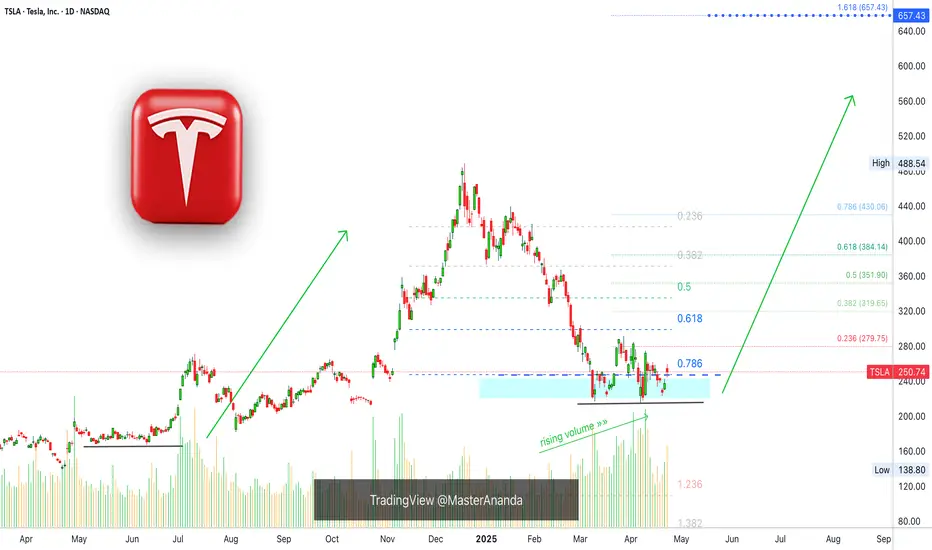
Tesla Finds Support, 657 Next Easy High & All-Time HighTesla is looking pretty good right now, support has been found. The correction amounted to -55.5%. It started in mid December 2024 and the first low was hit in March 2025.
Since March TSLA has been in the process of forming a bottom.
The action moved below 0.786 Fib. retracement level in relation to the last bullish wave. The action is back above this level now and this is pretty good. As long as the action happens above the magic blue dashed line, Tesla is good and set to grow.
This signal, perfect symmetry, is supported by rising volume.
Buy volume is rising massively as TSLA moves into a long-term support zone.
(Smart people, smart money and smart traders buy when prices are low —this volume signal reveals the highest buying in years as TSLA hits support.)
The most revealing fact from a logical standpoint is the size of the correction, a 55% correction is a lot by any standard. When a market goes through such a strong correction, it tends to reverse and produce next a new move. It moves in waves. It goes up and down, up and down. We are seeing the end of the down-move and this will automatically lead to an up-wave.
When the bottom was hit, last month, the action goes flat. Tesla was clearly moving lower but as support was found the bottom stays flat. This is another revealing signal for the logical mind. No longer a downtrend but a consolidation phase, which is part of a transition period.
» So the market was bullish and from bullish turned bearish, from bearish it went sideways and from sideways it will grow.
This is an easy buy.
Thanks a lot for your comment and continued support.
Namaste.
Tesla: At a Crossroads – Accumulation or Breakdown?One of the most talked-about stocks right now — Tesla NASDAQ:TSLA . And for good reason. Between the constant media buzz around Elon Musk and the recent surge in vandalism against Tesla vehicles, it’s been getting plenty of attention. But I’m not here to talk politics or headlines — I’m here for the chart.
And honestly? It’s looking better than you’d think. Despite all the noise, price has held steady in the $225 to $270 range, showing signs of a sideways accumulation phase — right at the Point of Control (POC) since 2021. That’s a pretty strong area, technically speaking.
Over the next few weeks, we’re likely to get clarity:
Either we break above $350, which opens up serious upside potential,
Or we break down toward the Volume Area Low — specifically the 2024 VAL at $161.18.
The real danger zone? Below $138. If price breaks that level, we have to assume that Wave 2 isn’t done yet — even though it was originally considered complete in 2023.
Until then, the structure actually looks constructive: we’ve been putting in higher lows and higher highs since 2023, which signals a potential uptrend.
How far that uptrend goes is hard to call. But if we break and hold above $325, then a pullback toward $300–$270 could offer a clean entry opportunity.
On the flip side, yes — if the market collapses and Wave II is still unfolding, we could be staring at $175, $125, or even as low as $75–$50 in an extreme scenario. And that would be wild for a stock that once touched $485.
But that’s why it’s crucial to zoom out. Ask yourself:
What do I want from Tesla — long-term conviction or short-term plays?
Then build your view. If the macro fits, dial into the lower time frames to find your edge. The setup is building — and it’s looking like Tesla is prepping for a big move.
Question is: which direction are you positioned for?

Tesla - This Is Actually Not Gambling!Tesla ( NASDAQ:TSLA ) still looks quite bullish:
Click chart above to see the detailed analysis👆🏻
Just a couple of weeks ago I published a bunch of analysis, explaining all the reasons for a potential -40% drop on Tesla. However on the higher timeframe, Tesla still looks quite strong and with the bullish break and retest playing out so far, we could even see new all time highs soon.
Levels to watch: $260, $400
Keep your long term vision,
Philip (BasicTrading)
