Tesla Motors (TSLA)

Tesla's Tipping Point: The $662 Bet That Could Return $12K TSLA bearish play thesis focused on buying 2 contracts of the $190 PUT (May 2, 2025) at $3.31 each. This version scales up all profit/loss values and ROI calculations to reflect a 2-contract position (i.e., 200 shares total).
🧠 TSLA Bearish Earnings Thesis – 2 Contract Play
Earnings Date: April 28, 2025
Option Expiration: May 2, 2025
Strategy: Buy 2x TSLA $190 PUTs @ $3.31
Total Cost (Premium Paid): $662 ($3.31 × 100 × 2)
Breakeven: $186.69
Thesis: Multiple Converging Catalysts Suggest Sharp Downside Risk
Tesla is facing a perfect storm of fundamental, technical, and sentiment-driven challenges. These create a highly asymmetric opportunity for short-dated PUT buyers heading into earnings.
⚠️ 1. Earnings Risk – Underperformance Expected
Delivery Misses: Q1 delivery numbers fell short of analyst expectations. Slower ramp in key markets like China and Europe due to economic slowdowns.
Margin Compression: Aggressive price cuts to maintain volume are eating into margins. Expectations for gross margin contraction YoY are high.
Disrupted Guidance: Potential downside revision to full-year forecasts as competition heats up (BYD, Ford, Rivian, etc.).
❝ Street is pricing in perfection. Any earnings or margin disappointment could send shares sharply lower. ❞
🧨 2. Brand Boycotts & Political Fallout
Public Backlash: Tesla faces intensifying boycott pressure in parts of Europe and the U.S. due to Elon Musk's political affiliations and controversial stances.
Brand Dilution: Musk’s polarizing presence has damaged Tesla's once-premium EV image. High-income, eco-conscious buyers are switching brands.
Retail Sentiment Shift: Reddit, X (formerly Twitter), and retail forums show sharp decline in "diamond hand" loyalty.
❝ Tesla’s brand equity is eroding. Negative sentiment is now a structural overhang. ❞
🔺 3. Headline Volatility – The “Musk Premium” Now a Liability
SEC & DOJ Scrutiny: Multiple ongoing investigations. Any bad headline can crash the stock.
X (Twitter) Overhang: Distraction and capital risk tied to Musk’s ownership of X are ongoing market concerns.
AI Pivot Uncertainty: Musk’s recent AI pushes have created confusion about Tesla’s core vision, with no clear monetization path.
❝ Musk headlines, once a tailwind, are now a systemic volatility trigger. ❞
📊 Modeled P&L for 2 Contracts
TSLA Price on May 2 % Drop Option Value per Contract Total Value (x2) Net Profit ROI (%)
$220 -16.5% $30.00 $6,000 $5,338 806%
$210 -20.3% $40.00 $8,000 $7,338 1,108%
$200 -24.1% $50.00 $10,000 $9,338 1,410%
$190 -27.9% $60.00 $12,000 $11,338 1,712%
$186.69 (Breakeven) -29.2% $63.31 $12,662 $12,000 1,812%
$263.55 (No drop) 0% $0.00 $0 - $662 -100%
💡 Strategy Recap – 2 Contract Position
Metric Value
Strike $190 PUT
Contracts 2
Premium $3.31 × 100 × 2 = $662
Breakeven $186.69
Max Risk $662
Max Reward $12,662
Reward/Risk Ratio ~19:1
✅ Final Thesis (2 Contracts)
"With $662 risked, a move to $200–$210 can yield ~$8,000. A move to $190 or below offers potential returns of over $11,000, making this a powerful short-term asymmetric play post-earnings. While risky, it’s tightly capped with a clearly defined thesis."

Is Stock Market Going to Crash?Stock Market Analysis | NASDAQ:QQQ AMEX:SPY
Mag 7 Price Forecast | NASDAQ:TSLA NASDAQ:NVDA AAPL AMZN META MSFT GOOGL

Tesla Stock Continues to Trade Within a Bearish ChannelThe monthly movements of Tesla's stock continue to reflect persistent downward pressure, with a decline of just over 10% since the beginning of March, showing steady selling interest. The bearish sentiment has remained in place as growing discontent over Elon Musk's political positioning has damaged the brand's image, while concerns over a potential trade war have raised fears that Tesla’s international sales may be negatively affected.
Bearish Channel:
Currently, the most important formation on the chart is a strong bearish channel that has remained intact since the final days of December 2024. So far, recent bullish attempts have failed to break out of this structure, reinforcing the broader bearish bias in the long-term outlook.
MACD Indicator:
The latest movements in the MACD histogram have started to show a notable decline, indicating that momentum in the moving average trend may be fading in the short term. This is likely due to the price reaching the upper boundary of the bearish channel, where resistance remains strong.
ADX Indicator:
The ADX line is currently trending downward, hovering just above the neutral 20 level. As this pattern continues, it reflects a lack of strength in recent price movements, pointing to growing indecision, which in turn reinforces the current resistance zone where the price is consolidating.
Key Levels to Watch:
$290: A significant resistance zone, aligning with the top of the bearish channel and the 200-period moving average. Sustained buying above this level could threaten the current bearish structure and signal the start of stronger bullish pressure.
$220: A key support level, representing the recent lows in the stock. A clean break below this zone could confirm a stronger bearish trend, opening the door for more aggressive selling in the sessions ahead.
By Julian Pineda, CFA – Market Analyst

Tesla - There Is Hope For Bulls!Tesla ( NASDAQ:TSLA ) is just crashing recently:
Click chart above to see the detailed analysis👆🏻
After Tesla perfectly retested the previous all time high just a couple of weeks ago, we now witnessed a quite expected rejection of about -50%. However market structure remains still bullish and if we see some bullish confirmation, a substantial move higher will follow soon.
Levels to watch: $260, $400
Keep your long term vision!
Philip (BasicTrading)

$TSLA - Lower against 290NASDAQ:TSLA has completed an ideal double zigzag rally from the lows. Breaking below 271.28 will open the path for a larger down move; however, lower lows will be confirmed upon a breach of the 233 handle.

Tesla (TSLA) - The Big Short?Can Tesla save itself from the Big Short? With earnings coming up on April 29, the anticipated sales and earnings may be dismal. If hedge funds and retirement managers decide to lighten their exposure, this could lead to abrupt moves in the price of Tesla. Basically, if people want to sell and no one wants to buy at this price, then price has to go down. Also if Tesla hits a certain price on the way down, then all the loans like those used to purchase Twitter may margin call due to risk, more selling. This would not be good for Tesla or the market in general. Also keep in mind that April may be a pullback month for the S&P500 and Nasdaq anyway. So, what does Tesla need to do to combat this? 1. Deliver new products or announce the delivery of new product. 2. Deliver on full self driving along with the Robo Taxi service 3. Deliver on a new cheaper Tesla Model that can be used by individual owners to participate in the Robo Taxi network (Income for the buyer). 4. Deliver on a redesigned Cyber Truck. The current design in getting banned in European countries. Therefore, missing out on sells. 5. Deliver on mass productoin of humanoid robots and AI agents (someone has to be first). This will create excitement but can be tricky since it will unleash AI on the world which can be great but also introduce risk that have not been vetted. Such as, who controls the AI? Who is the AI 'loyal' to? What can people or Tesla ask AI to do? Are there morality rules? Is AI subject to the law? Who's laws based on the Country, State, or county/city it resides or where it was manufactured? 6. Advertise all the positive things about Tesla as a company and the cars as a product. Explain why someone should buy a Tesla over a BYD brand electric car in markets around the world.
These are just a few suggestions for Tesla to avoid The Big Short. What are some of your ideas?

$KRE REGIONAL BANK Crash? Identical Setup to March 23'Identical Setup to 23' Regional Bank Crash. As always, not sure what the trigger will be, but I will do my best to keep everyone updated as usual. Target of $58 from $60s reached. I'll be expecting a bit more come June. Watch for the sideways movement and rally until then.

TSLA the companyReviewing my charts out loud. I like the month and week view best. Watch the zones. Above 250 TSLA is above water. Will take a look at how week and month close to see if anything pops out at me. Tootles!
*I watch for setups
*BYD is gaining market share in China
*Europe may not want to affiliate right now
*Dubai for funding?... I happened to read years ago that Dubai investors put their money behind Lucid (LCID). Their earnings Q1 2025 was stellar.
*Currently, TSLA sales are in a slump

TESLA formed the new bottom and is going for $600.Tesla / TSLA is on the 2nd straight green 1week candle, crossing above the 1week MA50.
With the 1week RSI bouncing on the 2 year Rising Support, the Channel Up has technically formed its new bottom.
Both the current and the previous one were formed on the 0.618 Fibonacci retracement level after a -55% decline.
If the bullish wave is also as similar as the bearish waves have been, the price should reach as high as the -0.382 Fib extension.
Buy and target the top of the Channel Up at $600.
Follow us, like the idea and leave a comment below!!

Tesla stock has completed 5 downward waves.Tesla stock has completed 5 downward waves
Currently, market sentiment is highly negative. A correction to the $296-$326 area, which corresponds to 38.20 and 50% Fibonacci levels, seems likely. They have also covered the gap from below.
After Tesla stock's correction, I expect a global collapse of the SP500, the US stock market, and the cryptocurrency market.
You can review ideas for Bitcoin, Ethereum, Solana, SPY/SP500:
-----
SP500/SPY:
Today:
-----
Bitcoin:
-----
Ethereum:
-----
Solana:

Eyes Off the Road, But On the Prize?While Tesla often dominates the autonomous driving narrative, the reality is far more nuanced. This article posits that Mobileye, with its recent significant collaboration with Volkswagen, stands as the only true competitor in this high-stakes technological race. Volkswagen's decision to integrate Mobileye's advanced camera, radar, and mapping technologies into its high-volume models underscores a growing industry trend: established automakers are increasingly relying on specialized technology providers to navigate the complexities of assisted and autonomous driving. This partnership not only validates Mobileye's technological prowess but also signals a potential shift in the autonomous driving landscape, moving beyond Tesla's proprietary approach.
Mobileye's strategic advantage lies in its comprehensive suite of technologies, notably the Surround ADAS platform powered by the EyeQ™6 High processor. This vertically integrated solution delivers sophisticated Level 2+ capabilities, including hands-free driving in specific conditions, and is designed for scalability across mass-market vehicles. Complementing this is Mobileye's innovative Road Experience Management™ (REM™) technology, a crowdsourced mapping system that leverages data from millions of vehicles to create and maintain high-definition maps globally. This approach offers near real-time updates and superior local accuracy, providing a critical foundation for future autonomous capabilities and contrasting with Tesla's reliance on its fleet data.
The fundamental difference in business models further distinguishes the two companies. Mobileye operates as a technology supplier, forging partnerships with over 50 automakers and integrating its solutions into numerous vehicle models. This strategy allows for a diverse and expansive collection of real-world driving data. In contrast, Tesla's vertically integrated model confines its autonomous driving technology primarily to its vehicles, potentially limiting its market reach and the breadth of its data acquisition. While Tesla champions an in-house approach, Mobileye's collaborative strategy positions it as a key enabler for the wider automotive industry's autonomous transition.
Ultimately, Mobileye's current focus on delivering robust and scalable Level 2+ systems, exemplified by the Volkswagen partnership, reflects a pragmatic evolution towards full autonomy. Coupled with positive analyst outlooks and a solid financial foundation, Mobileye is not just a contender but the most significant challenger to Tesla's autonomous driving ambitions, offering a compelling alternative path in the pursuit of a driverless future.

TESLA Market Outlook: Strong Reversal Expected at $200 SupportNASDAQ:TSLA is currently trading within a well-defined ascending channel , a structure that has guided price action since 2020. This channel reflects the broader bullish trend, with higher highs and higher lows consistently forming over the years. The recent sharp decline from the upper boundary of the channel is best interpreted as a temporary retracement rather than a structural shift. Such pullbacks have presented strong buying opportunities before, particularly when price approaches key support levels within the channel. The key area to watch is the $200 demand zone. This level coincides with the lower boundary of the ascending channel and has before drawn significant buying interest.
Given the broader bullish structure, a reversal from this zone could reestablish the uptrend and lead to a retest of higher levels. If a bounce occurs at the $200 demand zone, the immediate target is $263, which aligns with a key resistance level where prior rejection occurred. This area represents a logical point to watch for, but a successful breakout above $263 could lead to further move toward the upper boundary of the channel.
Fundamental Outlook:
From a fundamental perspective, the recent decline could be due to Tesla facing a unique set of challenges stemming from Elon Musk’s increasing involvement in the U.S. government. His role in the Department of Government Efficiency (DOGE) under the Trump administration has triggered mixed reactions across the financial landscape. The DOGE program, aimed at cutting bureaucratic waste and enhancing operational efficiency, has led to concerns about Musk’s ability to maintain focus on Tesla. Some investors do worry that his attention, divided among a few ventures such as Tesla, SpaceX, and also the federal program, might slow the company’s innovation pipeline in addition to running efficiency.
People are quite divided in their opinions. While some view Musk’s governmental involvement as a strategic advantage, believing his influence could drive favorable policy outcomes, others see it as a distraction that threatens Tesla’s future success. Additionally, if the DOGE program prompts budgetary austerity measures, there could be cuts to clean energy incentives, an outcome that would directly impact Tesla’s profits directly.
Despite these concerns, the market’s long-term outlook for Tesla remains bullish. Many investors view any significant retracement as a buying opportunity, particularly near major technical support zones like $200. This area is widely recognized as a strong accumulation zone where institutional buyers are likely to step in. Furthermore, the electric vehicle market continues to expand globally, and Tesla’s brand strength and technological lead remain intact, reinforcing the long-term growth narrative.
Market View & Predictions
While short-term volatility is expected due to ongoing uncertainties surrounding Musk’s government involvement, the broader technical structure suggests that the uptrend is still intact.
The recent pullback from the upper channel boundary appears to be a healthy correction rather than a trend reversal. If the price tests the $200 support zone, it could trigger a new wave of buying pressure, potentially driving the stock back toward the $263 resistance and beyond. As long as the price remains within the ascending channel, the bullish case for Tesla remains valid, with the potential for further upside as market confidence stabilizes.

TSLA volume profile tells a storyTesla is heading to 320 to be shorted again
During its climb to 485 TSLA had hardly any volume bove 285, but on the fall side it had significant volume, indicating short sellers were the net cause of volume. The same are taking profits now causing sharp rise. There is volume imbalance at around 320, also the middle line of hilo ema (200 days) which is powerful attracter of prices

SeekingPips sees TSLS Tesla GAIN $60 ! What's Next?It's hard for many traders to do. 🤔
⭐️ I still see it today with traders and investors alike. Even with some who have been at it for many years...
BUT some of the BEST ENTRIES & EXITS for me have been when the OPEN CANDLE IS COMPLETELY AGAINST ME.
The LAST WEEKLY TESLA chart that I shared is another prime example of this.
🟢SeekingPips🟢 shared a BULLISH BIAS when the WEEKLY CHART was looking as BEARISH as hell. 🔥
ℹ️ Now it really is not a method that works for everyone.
Trading against momentum always looks SCARY BUT the SECRET is MULTI TIMEFRAME ANALYSIS and also being able to...
VISUALISE DIFFERENT OBSCURE TIMEFRAMES IN REAL-TIME USING THE CURRENT OPEN CHART.
⚠️I plan on going DEEPER INTO this rabbit hole with some information and examples in the TUTORIAL SECTIONS soon.⚠️
🚥 In it's simplest terms an example would be beaing able to note where price is on a 20 or 10 min chart just only by having a 5 minute chart in front of you.
By being able to do so in REAL-TIME KEY LEVELS POP OUT that you may not have noticed from the 5 minute chart perspective only.💡💡💡
Now 🟢SeekingPips🟢 has to wait for a TRIGGER for a NEW ENTRY & SO SHOULD YOU.👍👌👍

Tesla on the Path to New Highs: Correction Before a Major high?hello guys.
let's have a comprehensive analysis of Tesla
__________________________
Technical Analysis
Price Structure & Trend:
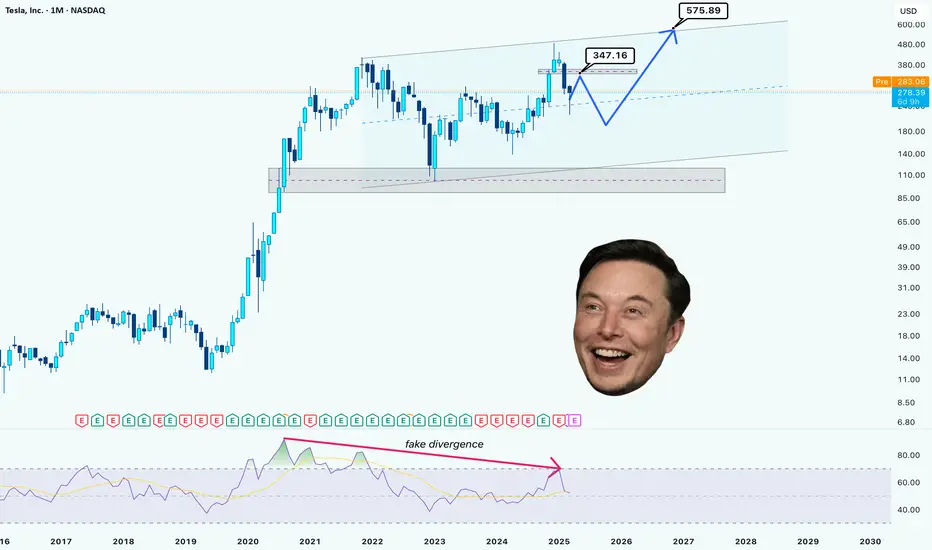
The monthly chart indicates a long-term uptrend within a broad ascending channel.
Tesla has recently faced resistance around $300 and is now in a corrective phase.
The expected correction may bring the price down to around $220-$250, where it could find strong support before continuing its bullish move. or it is possible to start an upward movement and form an ATH!
RSI & Divergence:
The RSI indicator previously showed a fake bearish divergence, meaning the price action remains strong despite earlier weakness signals.
Potential Higher Levels
If Tesla successfully follows the projected movement, a break above $575 could open the door to $700-$750, based on the channel extension and historical breakout patterns.
__________________________
Fundamental Analysis
Earnings & Growth:
Tesla's revenue growth remains strong despite market headwinds.
New factory expansions (Giga Texas, Giga Berlin) and production efficiency improvements contribute to long-term profitability.
The Cybertruck ramp-up and expansion in AI-driven automation could drive future stock value.
EV Market Outlook:
Tesla maintains a dominant position, but increasing competition from Chinese EV manufacturers and legacy automakers remains a challenge.
Recent price cuts have impacted margins but helped sustain high sales volume.
Macroeconomic Factors:
Interest rate decisions by the Federal Reserve could impact growth stocks like Tesla.
If rates stabilize or decrease in 2025, Tesla could see renewed investor interest, pushing the stock to new highs.
_________________________
Conclusion
The mid-term bearish retracement toward $250 aligns with healthy correction levels.
If Tesla holds above support and breaks $350, your $575 target is highly probable.
A break above $575 could lead to $700+ in the longer term, assuming positive earnings growth and stable macroeconomic conditions.
OH NO GUESS WHAT I FOUND $TSLA HEAD AND SHOULDERThe head and shoulders pattern is a chart formation in technical analysis that signals possible trend reversals, often suggesting a change from a bullish to a bearish trend. It features three peaks: a central "head" that is the highest, flanked by two "shoulders," with a neckline connecting the troughs between these peaks.
Tesla's stock is often viewed as a risky investment for several reasons:
High Valuation: NASDAQ:TSLA stock price is considered very high compared to traditional car manufacturers, with a much higher price-to-earnings ratio.
Market Volatility: The NASDAQ:TLSA price is highly volatile, influenced by factors like CEO Elon Musk's public comments, regulatory changes, and overall market sentiment.
Intense Competition: The electric vehicle market is becoming more competitive, with many established and new companies investing heavily in EV technology.
Production Issues: Tesla has experienced production and supply chain challenges, which can affect its ability to meet demand and maintain profitability.
Regulatory Risks: Changes in government policies and regulations, especially those related to environmental standards and EV incentives, can significantly impact Tesla's business.
While these points highlight potential risks, Tesla also has strengths such as strong brand recognition, technological innovation, and leadership in the EV market. It's important to consider both the risks and potential rewards when evaluating Tesla as an investment.
SELLL NOW!!!!!

$TSLA The rollercoaster ride The ride continues.... It can go up or it can go down 400 - 200 is the current range, while I think and hope that next quarters numbers are going to come in low. It's all going to come down to what happens when FSD launches middle of this year. Will this be a world changing moment? Or a somewhat disappointing take rate with crappy numbers...

EASY $280Hey, I'm back with $TSLA.
Buy now! It will reach $283 soon.
+ Let's see if NASDAQ:TSLA breaks $283.
I don't need to explain why it will rise again cause the selloff has been too intense (oversold), and all the bad news is already factored in.
We buy in fear and sell in greed

Tesla entering key $275 area.Tesla's stock price is currently at a critical juncture, entering the significant resistance zone around $270. The chart highlights this level as a pivotal threshold separating bearish and bullish market sentiments. Tesla's behavior around this region will likely determine its next major trend.
### Analysis of the Scenarios:
1. **Below $270: Bearish Outlook**
If Tesla's stock fails to effectively break above the $270 resistance zone and instead gets rejected, the bears will remain in control. Previous price actions indicate this level as a significant area of selling pressure, with multiple failed breakout attempts in the past. A rejection here could set the stage for a continuation of the downtrend, with potential declines back to lower support levels.
2. **Above $270: Bullish Resurgence**
A clear breakout above $270, confirmed by successive daily or weekly closes, would signal a bullish shift in Tesla's technical structure. This would suggest that buying momentum has overcome prior resistance, paving the way for further upward price movements. Breaking through this level could reignite investor enthusiasm and potentially initiate a new rally.
### Key Observations from the Chart:
- The $270 level has acted as both support and resistance in the past, underscoring its importance as a psychological and technical barrier.
- Tesla has recently bounced back after a sharp decline, suggesting a potential recovery attempt. However, the current price action faces a stiff challenge at this resistance level.
- A failure or success at $270 could trigger broader directional movement, with implications for both short-term traders and long-term investors.
### Conclusion:
Tesla's stock is at a decisive crossroads as it entered the $270 resistance zone. A rejection would signify continued bearish dominance, while a sustained breakout would indicate a bullish reversal. Investors will be closely watching the price action around this critical level to gauge the next directional move. As the market exhibits uncertainty, patience and prudent risk management will be key for traders looking to navigate Tesla's current trajectory.

$TSLL – Major Reversal in Play? Is tesla finally back???
TSLL has been in a prolonged downtrend but is now showing signs of a potential bottoming pattern. Price recently tested a key support zone between $6.26 and $7.18, holding firmly after multiple attempts to break lower.
Current price action is forming a strong base, and the first green candle breaking out of this range suggests momentum may be shifting.
The upside target is set near $20, which lines up with a previous consolidation zone and psychological resistance. A break and hold above current levels could trigger a strong move higher.
Risk is defined below support, making this a favorable risk-to-reward setup. Watching closely for follow-through confirmation.

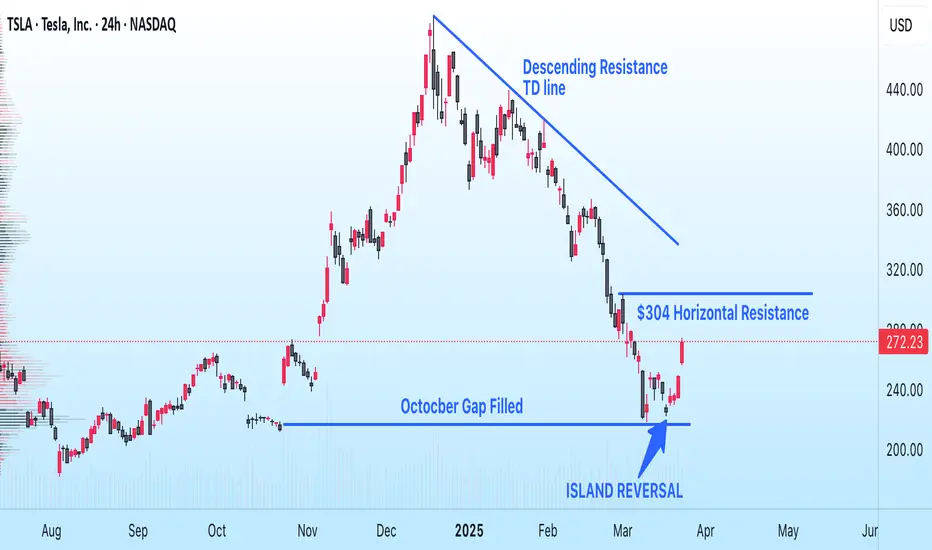
$TSLA Strong Rebound Eyeing $304—Can It Break Key Resistance?
On March 11th, NASDAQ:TSLA filled the gap at $219, which was left on October 23rd following the "surprise" Q3 positive earnings call. Then, on March 23rd, it confirmed strength with an Island Reversal Pattern, signaling potential for further upside. The stock now appears poised to test higher levels, where it will encounter resistance from the Tom DeMark descending trendline. The exact resistance level will depend on the speed of the upward movement—the faster it rises, the higher the resistance. Key levels to watch include the $304 horizontal resistance and the point where both resistances converge in approximately 10 trading days.
My Technical Analysis for $TSLA (Tesla)📊 Technical Analysis: NASDAQ:TSLA (Tesla)
🗓️ Updated: March 24, 2025
🚨 Critical Zone Being Tested
After breaking out of a multi-year symmetrical triangle, NASDAQ:TSLA is now retesting the upper boundary of the pattern — perfectly aligned with the key ACTION ZONE (liquidity zone + long-term MAs).
🔵 ACTION ZONE ($245–265):
High-probability decision area. Holding this level could trigger a fresh bullish leg.
🟣 SWING BOX ($180–210):
If support fails, this is the next logical area for a potential bullish reaction.
🟡 FVG Daily ($75–115):
Unmitigated Fair Value Gap. Only relevant in case of a major breakdown.
📉 SMI (Stochastic Momentum Index):
Currently in negative territory, but nearing oversold — watch for a potential reversal.
🎯 Scenarios:
Bullish: Strong rejection from the Action Zone → potential move to $350–400 ✅
Bearish: Breakdown below the blue zone → eyes on Swing Box or FVG for reentry ⚠️
📌 Reminder: This is not financial advice. Always manage risk and wait for confirmation before entering a trade.
💬 What do you think? Is Tesla preparing for a bounce or heading lower?
👇 Share your thoughts in the comments!
