Tesla (TSLA) | Short-Term Compression, Long-Term ExTesla’s daily chart is coiled, with price currently trading at $316, sitting along the 200-day moving average. This looks like a consolidation phase with significant moves building up.
Price Action Snapshot
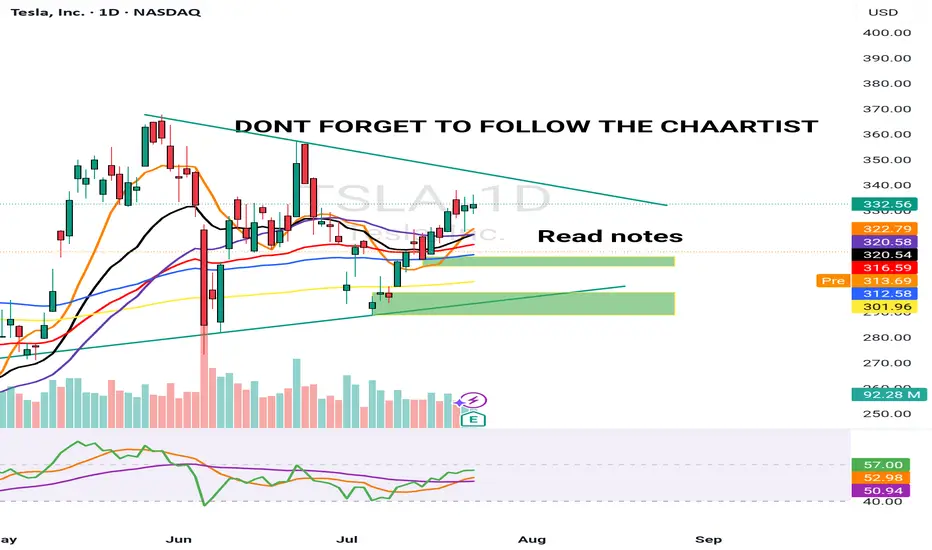
TSLA sold off last week, rejecting the $335 resistance level before finding footing around $300. The previous range of $280 and $365 is now tightening.
Immediate resistance sits at $335 with a clean breakout above that zone likely triggering momentum back toward the upper range of $365.
The recent drop does not seem like a capitulation move; it's likely institutional redistribution. Smart money is repositioning, not exiting.
Market Is Focused on the Wrong Data
Tesla’s Q2 earnings were objectively weak. Revenue fell 12%, deliveries dropped, and operating margins got clipped.
But this correction isn't all about fundamentals. It is about the market adjusting to a company evolving beyond traditional valuation models.
While most investors are trying to value Tesla like a car company, it’s spending this entire phase retooling itself into an AI and autonomy-first enterprise. That transition doesn't show up in EPS yet (but it will).
The Bigger Picture is Being Missed
The robotaxi rollout in Austin is live. Expansion into California, Phoenix, and Florida is on the roadmap.
Tesla is building a vertically integrated, owner-driven ride-hailing model that could eventually bypass both Uber and legacy OEMs entirely.
Optimus is no longer a lab prototype—it’s moving toward scalable production by 2026.
If Tesla even partially succeeds in general-purpose robotics, it will unlock a Technology Acceptance Model (TAM) that dwarfs the current EV narrative .
Daily Technical Outlook
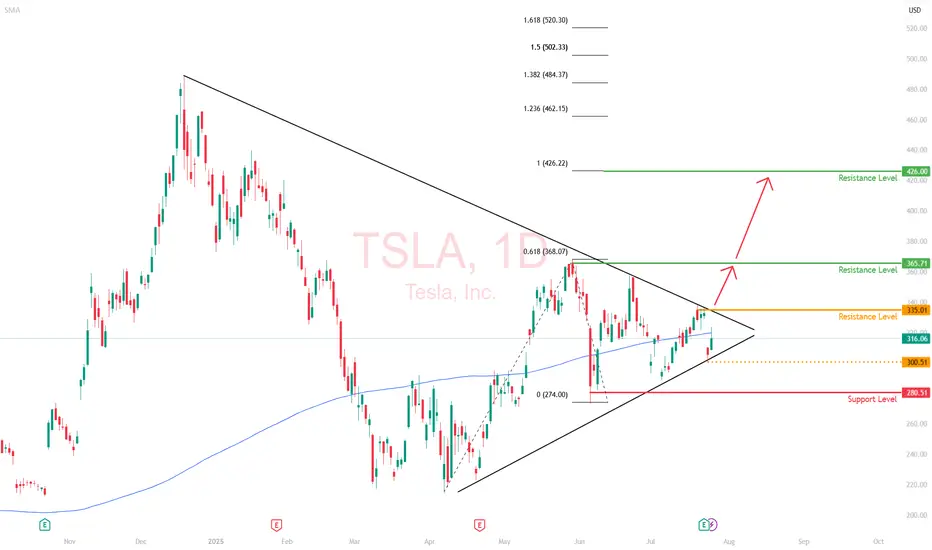
We’re currently in a bullish compression, with higher lows forming against the resistance area of $365. If $280 holds and the price continues to grind within this wedge, it sets up a volatility breakout scenario.
The breakout level to watch is $335. A daily close above that reopens $365. And beyond that, the resistance level is at $426.
My View
Tesla is compressing, both in price and narrative.
The long game is quietly coming into focus, where the risk/reward skews asymmetrically in favor of the upside.
This daily compression won’t last forever, and when it resolves, the move will likely be outsized.
Tesla Motors (TSLA)
Tesla in the waiting room as revenue slidesTesla is a global innovator that is changing the world. As a general rule, many investors have a saying: Never bet against Elon. They're not wrong. Elon delivers. But the short term is messy.
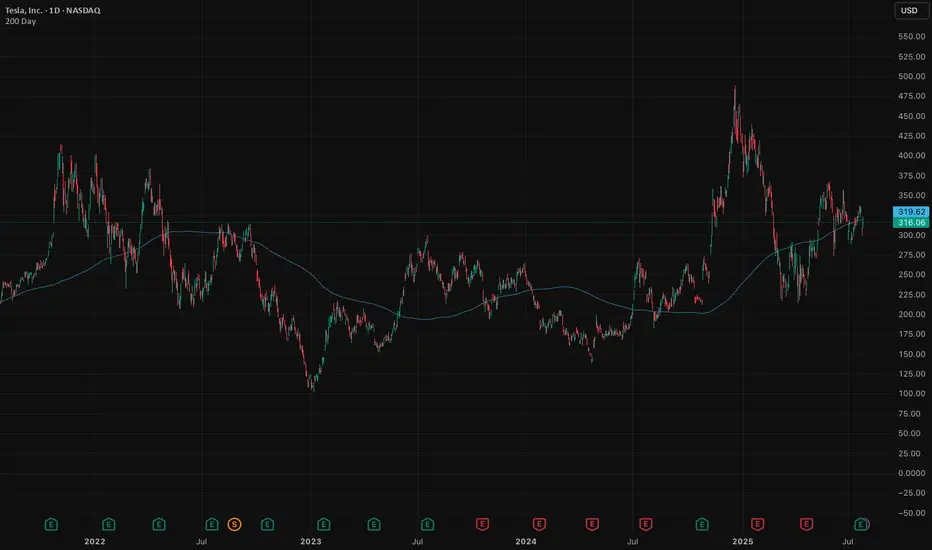
The stock is hovering around its 200-day moving average, a critical test. Break lower and we could see $290, maybe $260. That’s not panic, it's just price catching up to reality.
The auto business is deep in a downcycle. Q2 deliveries fell 14%, with revenue down 12%. Profits squeezed. Classic cyclical move. Nothing new here. But it’s weighing on momentum.
The upside isn’t about cars, it's autonomy, robotaxis, AI (Grok in cars). That’s where Tesla becomes a $2 trillion company. Musk knows it and is building for the future (100,000 GPU super cluster). He’s already shifting the story.
But that future is 6–12 months out, maybe longer.
In the meantime, we sit in the waiting room. Auto volumes need to stabilise. Robotaxi needs scale. Optimus requires proof and some definitive timeframes to get the market excited. That creates a 3–6 month narrative gap. Markets hate gaps.
Earnings last week were among the softest (though expected). EPS fell 23%. Free cash flow almost vanished. No real catalysts until next quarter. If the broader market sells off, which looks likely, Tesla takes more heat.
But let’s not lose the plot. Tesla is still Tesla. Long-term vision remains. Musk’s execution record is unmatched. Bet against him and you lose, eventually.
Short term, expect weakness. Patience required. If the stock breaks $315 with conviction, we’d expect further weakness before the real upside re-emerges.
Wait, watch, then pounce.
The forecasts provided herein are intended for informational purposes only and should not be construed as guarantees of future performance. This is an example only to enhance a consumer's understanding of the strategy being described above and is not to be taken as Blueberry Markets providing personal advice.
Stock Market Forecast | TSLA NVDA AAPL AMZN META MSFTStock Market Forecast | CME_MINI:NQ1! CME_MINI:ES1! SPY QQQ
Mag 7 forecast NASDAQ:TSLA NASDAQ:NVDA AAPL AMZN META MSFT GOOG

CUP AND HANDLE $TSLA TO $515 MINIMUMThe cup and handle is a bullish chart pattern commonly used by traders to spot potential buying opportunities. It features a rounded "cup" formation followed by a slight downward drift forming the "handle." This pattern typically signals a continuation of an upward trend once the handle completes its consolidation phase.
ROBOTAXI BOOM
BUY NOW NASDAQ:TSLL NASDAQ:TSLA

Cup & HANDLE + Mini Double Bottom: $TSLA to $610 ScenarioI maintain a bullish stance on Tesla ( NASDAQ:TSLA ), supported by a compelling combination of technical patterns and strong fundamental drivers. The current chart setup reveals a Cup and Handle formation complemented by a Mini Double Bottom, both of which are classic bullish continuation patterns. These suggest a potential breakout scenario that could drive NASDAQ:TSLA to $610 by year-end.
Technical Roadmap:
Gap Fill to $408: Anticipated earnings momentum, particularly from the Robotaxi segment, is likely to propel the stock to fill the previous gap at $408.
Consolidation at $450: Following the gap fill, I expect a consolidation phase forming a “box” around the $450 level.
Breakout to $610: A decisive breakout above $450 could trigger a strong rally toward the $610 target.
***Current Key Catalysts Supporting the Bullish Thesis:
Robotaxi Expansion: Tesla’s autonomous driving initiative is gaining traction, with Robotaxi developments expected to significantly boost revenue and margins.
India Market Entry: Tesla’s upcoming launch in India opens access to one of the world’s largest and fastest-growing EV markets.
In-House Chip Development & Dojo 2 Expansion: Continued investment in AI infrastructure and custom silicon enhances Tesla’s competitive edge in autonomy and robotics.
Tesla Diner Launch: The near-completion of Tesla’s themed diner adds to brand visibility and customer engagement.
Global EV Adoption: Tesla continues to benefit from rising EV demand across multiple international markets.
Optimus Robot Hype: Growing interest in Tesla’s humanoid robot project could unlock new revenue streams and investor enthusiasm.
Favorable Macro Trends: A declining interest rate environment supports higher valuations for growth stocks like Tesla.
Institutional Accumulation: Recent trading activity suggests that institutional investors are accumulating shares within the current range.
Grok AI Integration: The integration of Grok AI into Tesla vehicles could enhance user experience and differentiate Tesla’s infotainment ecosystem.
Investment Strategy:
I recommend initiating or increasing exposure to NASDAQ:TSLL (leveraged Tesla ETF) ahead of the upcoming earnings report. This could offer amplified returns if the bullish scenario plays out. Consider accumulating further on any dips, particularly during the consolidation phase around $450.
BUY NOW NASDAQ:TSLA NASDAQ:TSLL

Next Volatility Period: Around August 21
Hello, traders.
Please "Follow" to get the latest information quickly.
Have a nice day today.
-------------------------------------
#TSLA
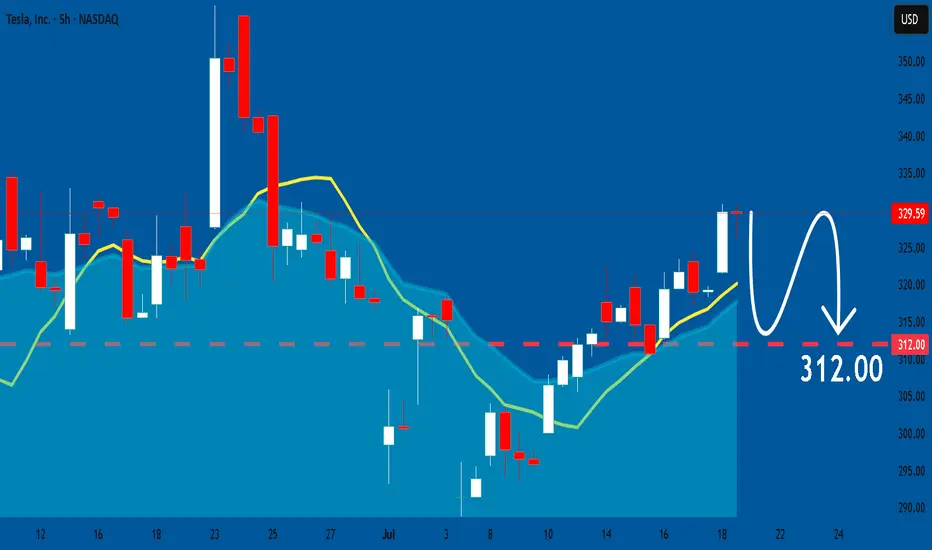
We need to see if it is rising along the rising channel.
The key is whether it can rise with support near 311.48 to break out of the downtrend line.
The key is whether it can rise along the short-term uptrend line and break through the short-term downtrend line after passing through this volatility period around July 25.
Therefore, we need to see whether it can rise above the 347.21-382.40 range with support near 311.48.
The next volatility period is expected to be around August 21.
-
The important thing is to maintain the price above the M-Signal indicator on the 1M chart.
If not, there is a possibility of a long-term downtrend.
Therefore, if it shows support in the 268.07-311.48 range, it is a time to buy.
-
Thank you for reading to the end.
I hope you have a successful trade.
--------------------------------------------------

Tesla Stock Returns to the $300 ZoneShortly after reporting earnings, Tesla stock fell more than 9% in the final hours of trading. This new bearish move is mainly due to the company’s earnings per share (EPS) of $0.40, which missed expectations of $0.43, and revenue of $22.5 billion, below the projected $22.74 billion. These figures indicate that Tesla failed to meet market expectations, triggering a sustained downward trend in the stock. This move could extend further unless new catalysts emerge to restore investor confidence.
Downtrend Remains Intact
Recent price action has been clearly bearish and continues to reinforce a downtrend that began forming in late December. So far, there has been no significant bullish correction to challenge this structure, making the bearish pattern the dominant technical setup in the short term.
Technical Indicators
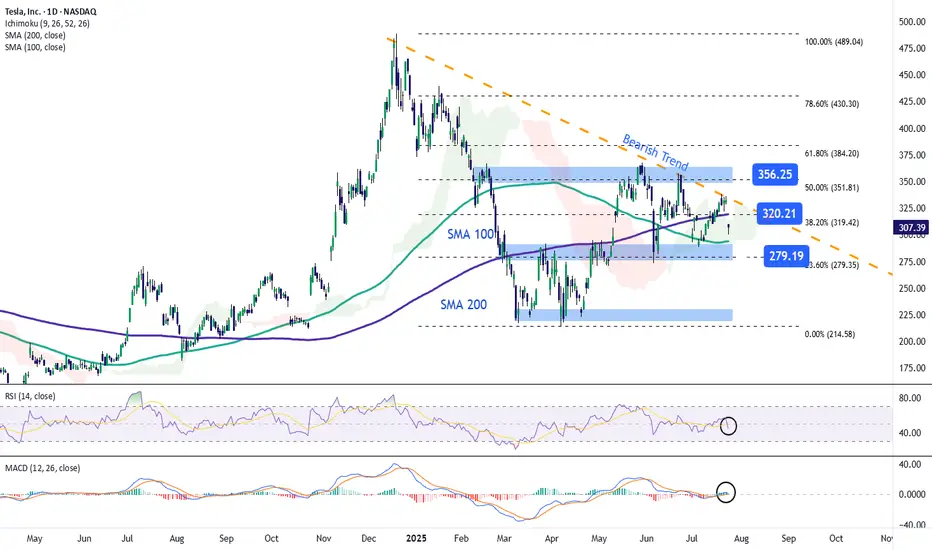
RSI: The indicator remains below the neutral 50 level, suggesting that selling momentum continues to build. If the downward path persists, bearish pressure may grow stronger in upcoming sessions.
MACD: The MACD histogram is currently hovering around the zero line, showing signs of technical indecision. However, if it crosses clearly below zero, it would confirm a more sustained bearish momentum.
Key Levels to Watch:
$356 – Major Resistance:
This level corresponds to the 50% Fibonacci retracement. A break above this zone could threaten the current downtrend.
$320 – Nearby Resistance:
Aligned with the 200-period simple moving average and the 38.2% Fibonacci level, a close above this point could reignite bullish sentiment and trigger a short-term upward move.
$280 – Key Support:
This is a critical support level, aligned with the 23.6% Fibonacci retracement. A breakdown here could extend the ongoing bearish trend.
Written by Julian Pineda, CFA – Market Analyst
TSLA Honey Ticking Bull Trap! UPDATE 1This is an updated chart, as I keep being prompted to reach "My Target" by TV.
No matter how bad things get for Elona and TSLA, there are always people who are willing to pile in and buy at any price. The problem is the chart is showing lower highs, as TSLA no longer attracts the people needed to boost price, just like TSLA the brand. As a result, people keep getting honey ticked.
Don't Get HONEY TICKED!
As I always say, never EVER!! Invest in toxic people like Elona. They always blow themselves up in the end. It's in their nature!
Click Boost, Follow, subscribe, and let's reach 5,000 followers. ;)

TESLA POST EARNING 24 JULY 2025This is Post earning analysis for Tesla . I have clearly explained all the levels. Please trade carefully & try to stick to your plan.
NOTE: FOLLOW THE LEVELS

TSLA 24 JULY 2025I have marked 2 levels in green boxes. Price is inside this box pre market and TSLA is down -8.5% from the highs of $338 post market till $310 & -7.5% down from yesterday's close
A better level is the lower demand zone but its not the best. Price has not hit any major resistance.
My job is to read the data & trade. I am still bullish & 10% up down move is normal for Tesla &
This could be a "BEAR TRAP".
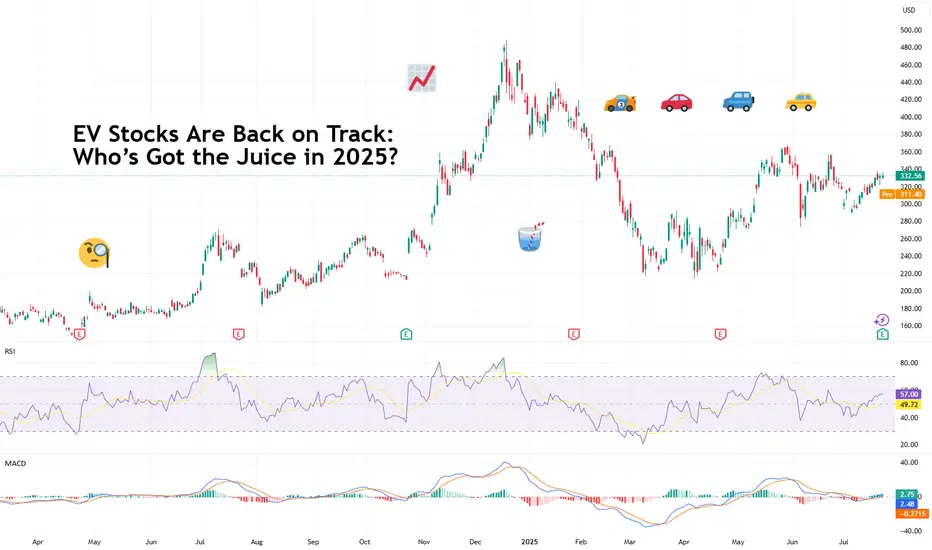
EV Stocks Are Back on Track: Who’s Got the Juice in 2025?This year is big for the EV sector so we figured let’s do a piece on it and bring you up to speed on who’s making moves and getting traction — both in the charts and on the road.
What we’ve got here is a lean, mean lineup of real contenders. Let’s go for a ride.
🚗 Tesla: Still King of the Road (for Now)
Tesla NASDAQ:TSLA isn’t just an EV company. It’s a tech firm, an AI shop, a robotaxi rollout machine, and an Elon-flavored media event every quarter. Even so, when it comes to margins, global volume, and name recognition, Tesla is still the benchmark everyone else is chasing.
In 2025, Tesla’s bounceback is fueled not just by EV hype but by its push into autonomous driving and different plays into the AI space.
The stock is down about 13% year-to-date. But investors love a narrative turnaround. Apparently, the earnings update didn't help the situation as shares slipped roughly 5%. Well, there's always another quarter — make sure to keep an eye on the Earnings Calendar .
🐉 BYD: The Dragon in the Fast Lane
BYD 1211 is calmly racking up sales, expanding across continents, and stealing global market share without breaking a sweat. The Chinese behemoth is outselling Tesla globally and doing it with less drama and more charge… literally .
Vertical integration is BYD’s secret weapon — they make their own batteries, chips, and even semiconductors. The West might not be in love with BYD’s designs, but fleet operators and emerging-market governments are. And that’s where the real growth is.
⛰️ Rivian: Built for Trails, Not Earnings (Yet)
Rivian NASDAQ:RIVN still feels like the Patagonia of EV makers — rugged, outdoorsy, aspirational. Its R1T pickup truck has cult status, but the company had to tone down its ambitions and revised its guidance for 2025 deliveries to between 40,000 and 46,000. Early 2025 projections floated around 50,000 .
The good news? Rivian is improving on cost control, production pace, and market fit. The bad news? It’s still burning cash faster than it builds trucks. But for investors betting on a post-rate-cut growth stock rally, Rivian may be the comeback kid to watch. It just needs a few solid quarters.
🛋️ Lucid: Luxury Dreams, Reality Checks
Lucid NASDAQ:LCID , the one that’ll either go under or make it big. The luxury carmaker, worth about $8 billion, came into the EV game promising to out-Tesla Tesla — with longer range, more appeal, and a price tag to match.
But here’s the rub: rich people aren’t lining up for boutique sedans, especially when Mercedes and BMW now offer their own electric gliders with badge power and a dealer network.
Lucid’s challenge in 2025 is existential. The cars are sleek, the tech is strong, but the cash runway is shrinking and demand isn’t scaling like the pitch deck promised.
Unless it nails a strategic partnership (Saudi backing only goes so far), Lucid could end up as a cautionary tale — a beautifully engineered one, but a cautionary tale nonetheless. Thankfully, Uber NYSE:UBER showed up to the rescue ?
💪 NIO : Battling to Stay in the Race
Remember when NIO NYSE:NIO was dubbed the “Tesla of China”? Fast forward, and it’s still swinging — but now the narrative is more about survival than supremacy. NIO's battery-swap stations remain a unique selling point, but delivery volumes and profitability are still trailing.
The company’s leaning into smart-tech partnerships and next-gen vehicle platforms. The stock, meanwhile, needs more than just optimism to get moving again — it’s virtually flat on the year.
✈️ XPeng: Flying Cars, Literally
XPeng’s NYSE:XPEV claim to fame used to be its semi-autonomous driving suite. Now? It's working on literal flying vehicles with its Land Aircraft Carrier. Innovation isn’t the problem — it's execution and scale.
XPeng is beloved by futurists and punished by spreadsheets. It’s still getting government love, but without a clear margin path, the stock might stay grounded.
🏁 Li Auto: The Surprise Front-Runner
Li Auto NASDAQ:LI doesn’t get the headlines, but it’s quietly killing it with its range-extended EVs — hybrids that let you plug in or gas up. A smart move in a country still building out its charging infrastructure.
Li is delivering big numbers, posting improving margins, and seems laser-focused on practicality over hype. Of all the Chinese EV stocks, this one might be the most mature.
🧠 Nvidia: The Brains of the Operation
Okay, not an EV stock per se, but Nvidia NASDAQ:NVDA deserves a spot on any EV watchlist. Its AI chips are running the show inside Tesla’s Full Self-Driving computers, powering sensor fusion in dozens of autonomous pilot programs, and quietly taking over the brains of modern mobility.
As self-driving becomes less sci-fi and more of a supply-chain item, Nvidia's value-add grows with every mile driven by data-hungry EVs.
🔋 ChargePoint & EVgo: Picks and Shovels
If you can’t sell the cars, sell the cables.
EV charging companies were once seen as the “safe bet” on electrification. Now they’re just seen as massively underperforming.
ChargePoint BOATS:CHPT : Still the leader in US charging stations but struggling with profitability and adoption pacing. Stock’s down bad from its peak in 2021 (like, 98% bad).
EVgo NASDAQ:EVGO : Focused on fast-charging and partnerships (hello, GM), but scale and margin pressures remain.
Both stocks are beaten down hard. But with billions in infrastructure funding still flowing, who knows, maybe there’s potential for a second act.
👉 Off to you : are you plugged into any of these EV plays? Share your EV investment picks in the comments!
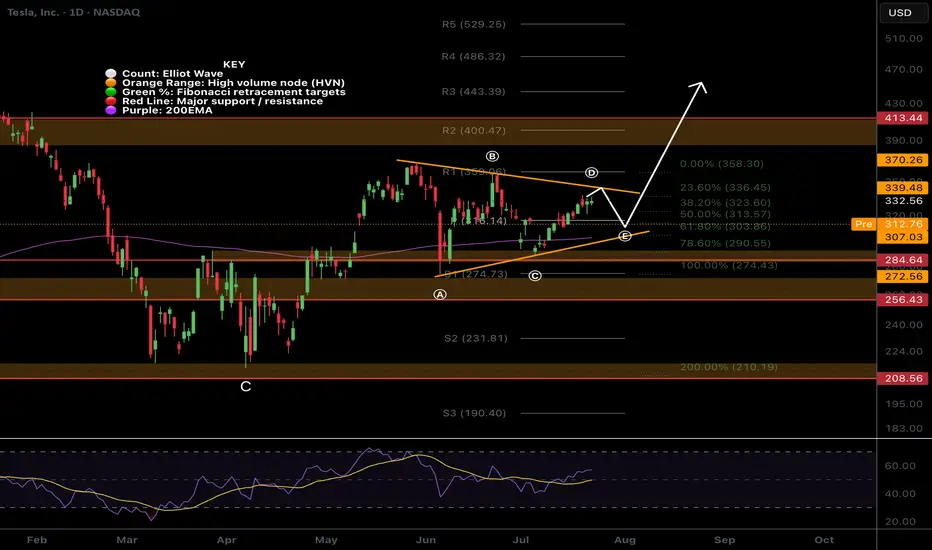
$TSLA Triangle?NASDAQ:TSLA triangle has presented itself with the recent price action. Triangle pattern target is $443 at the R3 daily pivot.
Wave e is expected to end at the daily pivot and wave d break is the signal to go long.
Analysis is invalidated below wave c.
TSLA Tesla Options Ahead of EarningsIf you haven`t bought TSLA before the recent rally:
Now analyzing the options chain and the chart patterns of TSLA Tesla prior to the earnings report this week,
I would consider purchasing the 350usd strike price Calls with
an expiration date of 2025-8-15,
for a premium of approximately $14.90.
If these options prove to be profitable prior to the earnings release, I would sell at least half of them.
Disclosure: I am part of Trade Nation's Influencer program and receive a monthly fee for using their TradingView charts in my analysis.

AAPL LIVE PRICE ACTION JULY 23 2025This is the price action for AAPL. I have discussed indicators as well. Do not blindly trade without understanding the logics. I am long here with stocks only.
NOTE: DO NOT BLINDLY BUY

TSLA to $420 - $454 areaTSLA is ready and primed to move into the $420 - $454 area over the coming quarter. This is a good options play.
We will encounter a little expected resistance at the $360 area, then an aggressive move to the $420 area.

ALK LOOKING BULLISH 22 JULY 2025ALK is looking good to go long at current price. I am going long as it looks very good. If you dont understand a trade then don't push yourself.
NOTE: LONG WITH STOCKS ONLY

TESLA PRICE ACTION 22 JULY 2025This is the price action for Tesla. i have discussed indicators as well. Do not blindly trade without understanding the logics. I am long here with stocks & calls.
NOTE: DO NOT BLINDLY BUY

TSLA squeezes into resistance ahead of earnings Tesla is set to report Q2 earnings after the closing bell on Wednesday, covering the quarter ending June 2025.
The stock has been highly volatile this year, amid concerns about tariffs, Elon Musk’s politics (and nazi salutes), and his public clashes with President Donald Trump.
Tesla bulls Wedbush think, “We are at a 'positive crossroads' in the Tesla story,” suggesting that investors will look past the current numbers and focus on Tesla’s long-term AI potential.
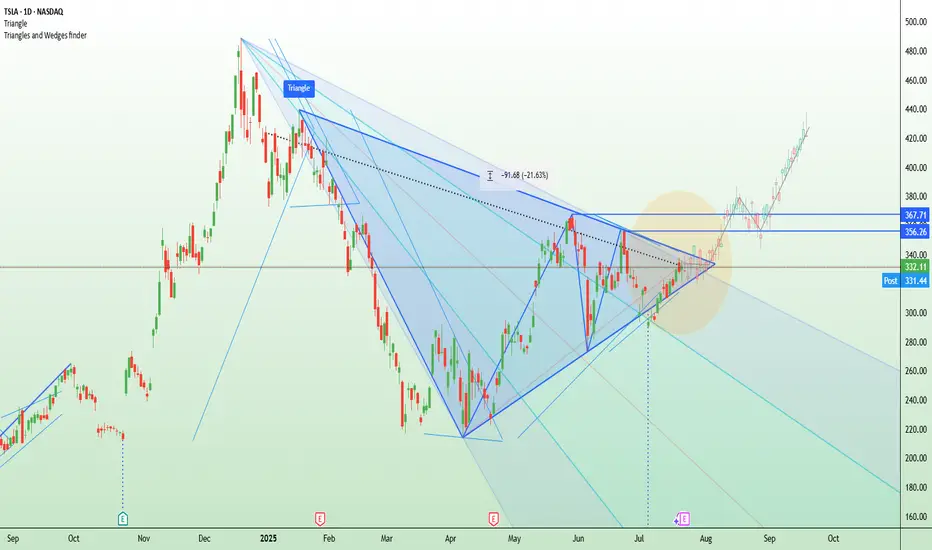
Technically, Tesla is now testing a major descending trendline that’s capped every rally since December. The current price action resembles an ascending triangle pattern — a bullish structure — with resistance around $356 and a series of higher lows from May through July. This tightening formation suggests building pressure ahead of the earnings release.
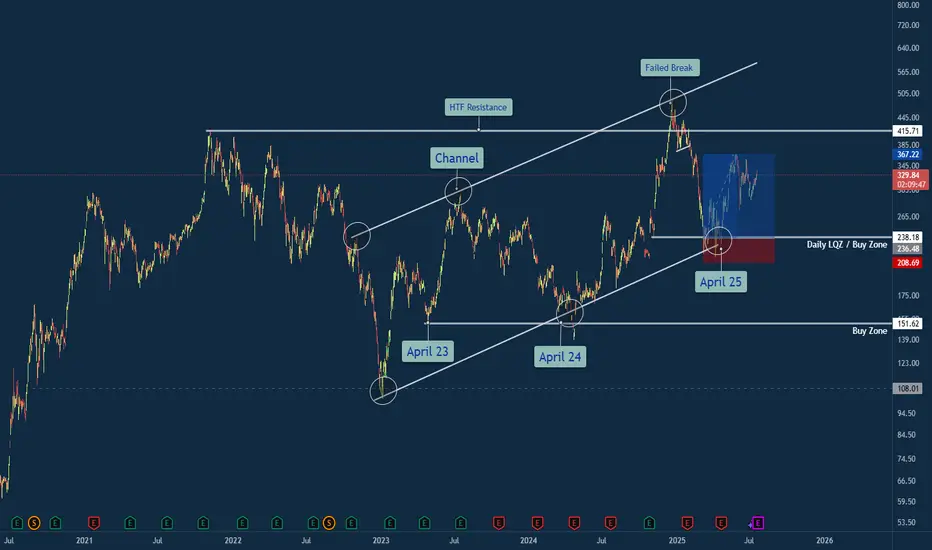
Tesla Trade Breakdown: The Power of Structure, Liquidity & ...🔍 Why This Trade Was Taken
🔹 Channel Structure + Liquidity Trap
Price rejected from a long-standing higher time frame resistance channel, making a false breakout above $500 — a classic sign of exhaustion. What followed was a sharp retracement into the lower bounds of the macro channel, aligning with my Daily LQZ (Liquidity Zone).
🔹 Buy Zone Confidence: April 25
I mapped the April 25th liquidity grab as a high-probability reversal date, especially with price landing in a confluence of:
Demand Zone
Trendline Support (from April 23 & April 24 anchor points)
Volume spike + reclaim of structure
🔹 Risk/Reward Favored Asymmetry
With a clear invalidation below $208 and targets at prior supply around $330+, the R:R on this trade was ideal (over 3:1 potential).
Lessons Reinforced
🎯 Structure Always Tells a Story: The macro channel held strong — even after a failed breakout attempt.
💧 Liquidity Zones Matter: Price gravitated toward where stops live — and then reversed sharply.
🧘♂️ Patience Beats Precision: The best trades don’t chase. They wait. This was one of them.
💬 Your Turn
How did you play TSLA this year? Were you watching the same channel? Drop your insights or charts below — let’s compare notes 👇
#TSLA #Tesla #SwingTrade #PriceAction #LiquidityZone #FailedBreakout #TechnicalAnalysis #TradingView #TradeRecap #ChannelSupport #SmartMoney
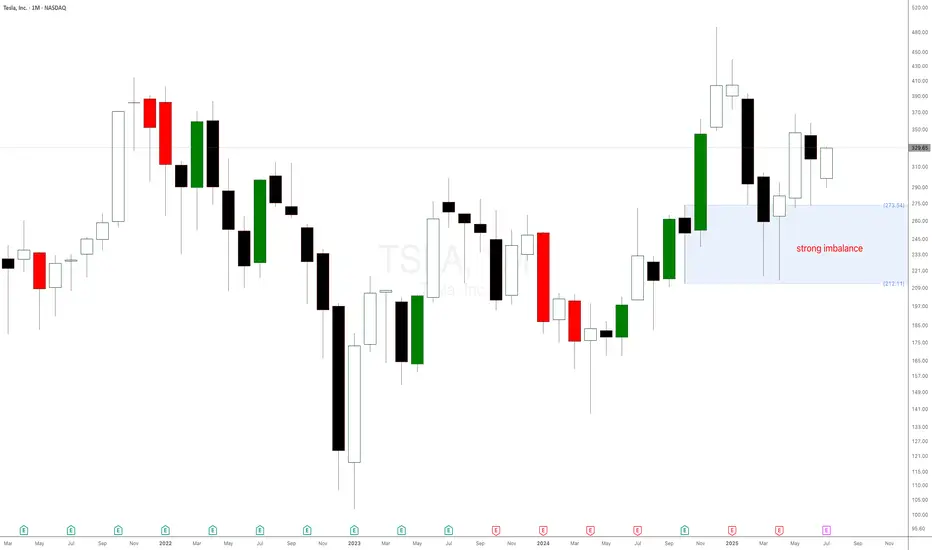
Don’t Listen to Elon Musk – Tesla Stock Chart Tells the REAL StoTesla Stock Set to Break Records: The Power of Monthly and Weekly Demand Imbalances at $273 and $298. Welcome back, traders! In today’s supply and demand breakdown, we’re diving deep into Tesla Inc. (NASDAQ: TSLA) — not from the noisy headlines or what Elon Musk just tweeted, but strictly from raw price action, demand imbalances, and the truth on the charts. Forget the fundamentals, forget the hype, because that’s already been priced in.
This is all about supply and demand, price action, and the power of patience.
The $273 Monthly Demand Imbalance: The Big Fish Made Their Move
A few weeks ago, Tesla stock pulled back to a significant monthly demand imbalance at $273. This level wasn’t just any zone—it was carved out by a strong impulsive move made of large-bodied bullish candlesticks, the kind that only institutions and whales create when they're loading up.
What happened next?
Boom. The market reacted exactly as expected, validating that monthly imbalance and setting the stage for higher prices. This is why we always trust the bigger timeframes—they hold the truth of what the smart money is doing.
TESLA 400 BY END OF YEAR !! 5 REASONS !!!
1. **Strong Earnings and Revenue Growth**
Tesla has a track record of exceeding earnings expectations. If the company reports robust financial results in Q3 and Q4—driven by higher vehicle deliveries and growth in its energy storage business—investors are likely to gain confidence. This could push the stock price upward as Tesla demonstrates its ability to scale profitably.
2. **Advancements in Autonomous Driving**
Tesla’s Full Self-Driving (FSD) technology is a game-changer in the making. If Tesla achieves significant progress toward Level 4 or 5 autonomy—where vehicles can operate with little to no human intervention—it could position the company as a leader in transportation innovation. Such a breakthrough would likely excite investors and drive the stock price higher.
3. **Battery Technology Innovation**
Tesla is working on developing cheaper, longer-lasting batteries, which could lower production costs and improve profit margins. If the company announces advancements in battery tech—such as improvements from its Battery Day initiatives or new manufacturing processes—it could signal a competitive edge, boosting the stock to $400.
4. **Global Expansion and Production Increases**
Tesla’s new Gigafactories in Texas and Berlin are ramping up production, while potential market entries like India loom on the horizon. Increased output and access to new customers signal strong growth potential. If Tesla successfully scales its operations, investors may see this as a reason to push the stock price toward $400.
5. **Favorable Market Trends and Government Policies**
The global shift toward sustainable energy and electric vehicles (EVs) is accelerating, supported by government incentives and regulations favoring clean energy. If EV adoption continues to rise and policies provide a tailwind—such as subsidies or stricter emissions standards—Tesla, as an EV leader, could see increased demand and a higher stock valuation.
While reaching $400 by year-end is ambitious, Tesla’s strong brand, innovative edge, and leadership under Elon Musk could make it achievable. That said, risks like market volatility and growing competition from other EV makers could pose challenges. If these five factors align, however, Tesla’s stock has a solid shot at hitting that target.

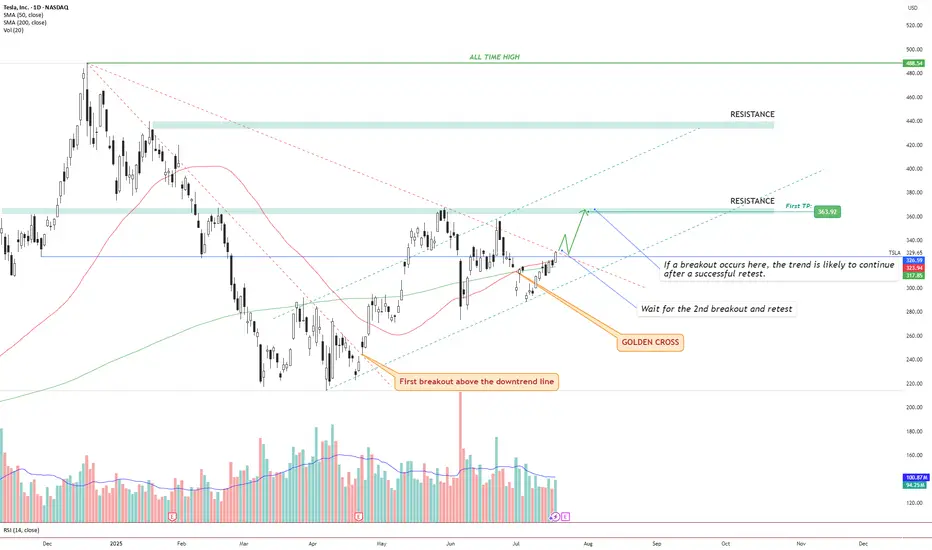
TSLA – Golden Cross + Dual Breakout Structure Targeting $363 andIdea Text:
Tesla NASDAQ:TSLA has recently printed a powerful Golden Cross , where the 50 SMA has crossed above the 200 SMA — signaling a potential long-term bullish shift in trend.
But price action shows more:
We’re observing a dual-breakout structure, where the first breakout above the long-term downtrend line has already occurred (see orange label), and the price is now approaching a critical horizontal resistance zone.
Let’s break it down step-by-step:
🔸 Step 1: Golden Cross
The 50 SMA crossed above 200 SMA — a classic signal for trend reversal. This often attracts institutional interest, especially if followed by breakout confirmation.
🔸 Step 2: First Breakout (Already Confirmed)
Price broke above the descending trendline, retested it, and maintained higher structure. This breakout initiated a shift in market sentiment from bearish to neutral-bullish.
🔸 Step 3: Second Breakout (Setup Forming)
Price is now testing horizontal resistance around $330–$335 zone. This zone also coincides with dynamic resistance from prior failed swing attempts. A successful breakout above this level, followed by a clean retest, can serve as confirmation for a bullish continuation.
🔸 Step 4: Target Setting
🎯 First TP is set at $363.92, a well-defined resistance level. If the breakout holds, next potential targets may develop around key zones such as $395 and $440, depending on price strength and continuation.
🔸 Risk Management
✅ Ideal entry after retest of breakout above ~$335.
❌ Stop-loss below the breakout level or below 50 SMA (~$315 area), depending on entry style.
🔄 Monitor volume: breakout without volume = weak move.
Conclusion:
We are watching a classic price action + moving average confluence setup. Golden Cross, breakout + retest structure, clean resistance level, and defined targets all align.
This setup is valid only with confirmation. No breakout = no trade.
⚠️ Not financial advice. DYOR.
TESLA: Bearish Continuation is Expected! Here is Why:
The charts are full of distraction, disturbance and are a graveyard of fear and greed which shall not cloud our judgement on the current state of affairs in the TESLA pair price action which suggests a high likelihood of a coming move down.
Disclosure: I am part of Trade Nation's Influencer program and receive a monthly fee for using their TradingView charts in my analysis.
❤️ Please, support our work with like & comment! ❤️