Tesla-Heading For A New ATH?NASDAQ:TSLA is looking good!
Robo-Taxi, Optimus Robots...and so more to come!
Tesla to $692 in the next years? Or months?
#stocks #tesla #stockmarket
Tesla Motors (TSLA)

TLSA Catalyst Ranking and Market Update: June 2025Here's an updated/revised outlook for TSLA including all the primary
catalyst ranking and analyst ratings and overview of latest developments
🔋 1. EV Demand Growth
Strength: 9/10 → 9/10
Global electric vehicle adoption remains the dominant pillar. Tesla faces softer comp in Europe (–40.5% drop in May) wsj.com, but overall trend remains firmly upward. 🌍
🚗 2. Affordable Entry Level Model
Strength: 8.5/10 → 8.5/10
Tesla still on track to launch a < $25K EV in first half of 2025. Any delays or execution issues could pressure sentiment.
⚡ 3. Battery Cost & Margin Improvement
Strength: 8/10 → 8/10
Margins saw slight relief Q1, driven by cost cuts f, but macro headwinds persist.
🤖 4. Autonomy & Robotaxi Rollout
Strength: 7.5/10 → 8.5/10
Robotaxi debuted in Austin in June, sparking a ~10% one-day stock surge. Benchmark raised its target to $475/buy on the rollout—strong tailwind.
🚩 5. Competition
Strength: 7/10 → 6.5/10
Rivals like Xiaomi’s new YU7 are gaining ground. Tesla must maintain differentiation.
📉 6. Trade Policies & Tariffs
Strength: 6.5/10 → 6.5/10
Still relevant due to Tesla’s global footprint, though less front-page than before.
💰 7. Incentives & Subsidies
Strength: 6/10 → 6/10
U.S. IRA tax credit policies remain supportive; evolving eligibility remains a swing factor.
🛢️ 8. Commodity Costs
Strength: 5.5/10 → 5.5/10
Raw-material swings affect margins. Inventory hedges help but not wholly mitigate.
📈 9. Fed & Interest Rates
Strength: 5/10 → 5/10
A higher-rate environment still limits valuation multiples for growth-tier companies.
🎭 10. Musk Profile & Governance
Strength: 4/10 → 5/10
Analysts (e.g., Bradley Tusk) warn of being “massively overvalued” tied to Musk’s persona. Musk’s renewed focus on Tesla vs. other ventures (DOGE, SpaceX) will be watched.
________________________________________
🚀 Refreshed Catalyst Rankings
Rank Driver Score
1 EV demand growth 9
2 Affordable model 8.5
3 Battery costs/margins 8
4 Autonomy/robotaxi execution 8.5
5 Competition 6.5
6 Trade & tariffs 6.5
7 Regulatory incentives 6
8 Commodities 5.5
9 Fed Rates 5
10 Musk reputation/governance 5
________________________________________
📊 Latest Analyst Ratings & Targets
• Benchmark / Mickey Legg: Buy, target $475 (from $350) — cites robotaxi safety-first rollout, automation upside
• Wedbush / Dan Ives: Outperform, target $500 — labels TSLA as an “embodied AI compounder”
• Morgan Stanley / Adam Jonas: Buy, target $410 — bullish on AI/self driving positioning
• Cantor Fitzgerald / Andres Sheppard: Overweight, target $355 — optimism rooted in robotaxi and FSD rollout
• UBS / multiple: Sell, target $215–225 — skeptical on demand and valuations
Consensus snapshot (FactSet):
• Mean price target ≈ $311–$312
• Mean rating between Hold–Buy (~2.7/5)
________________________________________
🗞️ Recent Headlines
• “Tesla completes first fully autonomous Model Y delivery ahead of schedule”
• “Tesla robotaxis launch in Austin” boosting momentum
• “EU Tesla sales slump” May registrations down 40.5%
• “Tesla fires longtime insider as Europe slump deepens”
________________________________________
🔍 Summary Outlook
Tesla shares are navigating a volatile interplay of strong tech promise and unfolding execution risks:
• Overweight view (Legg, Ives): Robotaxi rollout and AI thrust fuel upside. Automation transition seen as transformative.
• Bullish base (Jonas, Sheppard): AI, FSD rollout, affordable model support core thesis.
• Skeptical view (UBS, Tusk): Slumping deliveries in Europe/China, heavy valuation, Musk's external focus seen as emotional dampener.
Upcoming triggers to watch:
1. Q2 delivery and production results (mid July).
2. Robotaxi rollout execution/regulatory clearance.
3. Margin trajectory as costs evolve.
4. FSD reliability and expansion in new markets.
________________________________________
✅ What This Means for You
• Bull case: Robotaxi + AI momentum may drive TSLA back toward targets in the $475–500 range.
• Bear case: Weak deliveries, macro and competition pressures could cap shares or trigger pullback toward prior support ($330–350).
• Neutral: Watch near-term delivery and autonomy news to shape next move.

Stock Market Forecast | TSLA NVDA AAPL AMZN META MSFTStock Market Forecast | CME_MINI:NQ1! CME_MINI:ES1! QQQ SPY
Mag 7 Forecast | CBOE:MAGS NASDAQ:TSLA NVDA AAPL AMZN META MSFT

June 27th, 2025 - Morning BriefFriday, June 27, 2025. Markets are on the edge, and if you thought summer would bring calm, think again. Today’s script is pure adrenaline.
Overnight, the U.S. and China finally inked a trade deal that actually matters: tariffs are coming down, and rare earths are flowing again. Tech and manufacturing stocks are already celebrating, with SP:SPX and CME_MINI:NQ1! futures inching toward fresh record highs. NASDAQ:NVDA is still the market’s favorite lottery ticket, hitting another all-time high. Meanwhile, NYSE:NKE just spiked 10% premarket after beating earnings. Never mind the $1 billion tariff punch, they’ll “manage it.” Sure.
But the real show is the May PCE inflation data dropping this morning. The Fed’s favorite gauge is expected to tick up to 2.3% year-over-year, with core PCE at 2.6%. If the numbers surprise, brace for whiplash in rates and risk assets. GDP’s third estimate confirmed a -0.5% contraction in Q1, so the “soft landing” crowd is sweating. Jobless claims and new home sales hit at 10:00 AM ET. Expect every algo on the Street to be watching.
Trump is making noise about firing Powell before 2026, which has traders betting on earlier rate cuts. If you’re looking for stability, you’re in the wrong casino.
Here’s where things stand:
- OANDA:XAUUSD : $3,280–$3,334/oz (slipping as risk appetite returns)
- BLACKBULL:WTI : $65.64–$65.82/barrel (steady, but one headline away from chaos)
- BINANCE:BTCUSDT : $107,215–$107,477 (down, but still a six-figure fever dream)
- CME_MINI:ES1! : Hovering just below the 6,144 record
Today’s takeaway: The market’s running on hope, caffeine, and denial. Stay sharp, one bad print and the rally could turn into a stampede for the exits. Welcome to the volatility vortex.
Been building something for US swing traders — if you’re one, I’d really appreciate your feedback. Free to test, link in Bio

Tesla (TSLA) -Bullish Reaccumulation Setup | Smart Money conceptTesla shows a clean CHoCH followed by BOS structure, indicating a potential bullish continuation. The market is forming equal lows into a demand zone (green box), suggesting a possible liquidity sweep before a move higher.
Key Technical Points:
CHoCH (Change of Character) confirmed on strong bullish impulse.
BOS (Break of Structure) signals market intent to continue upward.
Ascending triangle structure with multiple support tests (marked "S").
Anticipated sweep into demand zone: $308–$312 area.
Potential upside target: $365–$375 supply zone.
Bias: Bullish on confirmation of demand reaction.
Disclaimer:
This is not financial advice. Always do your own analysis before investing.

Tesla (TSLA) 1H Chart – Wyckoff Cycle in ActionThis chart reflects a textbook Wyckoff pattern unfolding on TSLA’s 1-hour timeframe:
🔹 Accumulation Phase observed early May
🔹 Followed by Manipulation & Distribution – classic trap before markdown
🔹 Sharp selloff led to another Accumulation zone around $305
🔹 Further manipulation wicks indicate smart money involvement
🔹 Now projecting a move towards $360–$370 distribution zone
📌 Structure breakdown:
Smart Money Accumulation ➡️ Manipulation ➡️ Distribution
Bullish momentum building from $306 support
Eyes on reaction near the marked green distribution box 📦
📅 As of June 15, 2025 – chart aligns with Wyckoff theory and institutional behavior.

TSLA PRICE ACTION JUNE 25 2025This is the price action for Tesla. I have discussed all the levels. I have given a trade today & have discussed it thoroughly.
If you have any doubts, then feel free to Dm me or leave a comment below
NOTE:DO NOT BUY CALLS

Surprising ups and downs in global indicesJune brought contrasting moves across global stock markets: while the U.S. and Asia posted gains, Europe struggled under pressure. Rising tensions between Iran and Israel, political instability in the EU, and shifting rate expectations fueled volatility. In search of stability, investors turned to U.S. tech and exporters — pushing the S&P 500 (#SP500) and Nasdaq 100 (#NQ100) higher.
Key market movers in June:
• #SP500 (+0.96%), Dow Jones (#DJI30) (+0.89%), #NQ100 (+0.94%) – buoyed by dovish Fed tone and Iran’s restrained response to U.S. strikes. #Tesla surged 8.2%, with #IBM also among top gainers.
• Hong Kong 50 (#HSI) (+3%) – lifted by strong retail data and hopes of new stimulus from China.
• Australia 200 (#ASX) (+1.25%) – boosted by RBA rate cut expectations and strong tech sector performance.
• France 40 (#CAC40) (–2.76%) – weighed down by political risks and weakness in luxury stocks.
• Europe 50 (#ESTX50) (–1.8%) – hurt by soft ECB tone and weaker business activity.
• DAX 30 (#DAX30) (–3%) – pressured by weak industrial data and fading Chinese demand.
S&P 500 and Nasdaq 100 continue to rise on solid macro data, a softer Fed stance, and strong earnings from major tech players. Analysts at FreshForex believe investor confidence in the U.S. recovery supports the ongoing bullish trend.

Launch of Robotaxi Service Boosts Tesla Share Price by Over 8%Launch of Robotaxi Service Boosts Tesla (TSLA) Share Price by Over 8%
As previously announced by Elon Musk, Tesla has launched its robotaxi service in Austin, Texas. The cost of a ride is $4.20.
The service is not yet fully operational. It is more of an extended testing phase, as access is currently by invitation only, and a Tesla employee may be present in the back seat.
Nevertheless, the market responded positively — Tesla (TSLA) shares rose by more than 8% (comparing the closing prices of daily candlesticks).
Technical Analysis of TSLA Share Price Chart
In our 11 June publication, we:
→ identified an ascending channel;
→ highlighted the May support level (marked with an arrow), suggesting it could act as resistance following a bearish breakout.
Since then:
→ the channel has remained relevant;
→ the aforementioned level acted as resistance but was broken by the bulls yesterday.
As a result, the TSLA share price has reached the median of the current ascending channel, where it may find equilibrium and form a consolidation zone once the initial positive reaction to the robotaxi launch subsides.
It is also worth noting the stock’s resilience following Elon Musk’s controversy with President Trump — the price has already risen more than 28% from the June low, indicating the potential for a scenario in which resistance at $365 is tested.
This article represents the opinion of the Companies operating under the FXOpen brand only. It is not to be construed as an offer, solicitation, or recommendation with respect to products and services provided by the Companies operating under the FXOpen brand, nor is it to be considered financial advice.

SOARING 20's are you ready for the Blowoff of the century#SPX v Currency in circulation
#Cup&Handle
1929 Echo bubble
AI will increase earnings and GDP
as ASI enters the workplace and Robotics grow us out of Debt
GDP = Number of people * Productivity
Now add an autonomous workforce to this.

Tesla Rolls Out Much-Awaited Robotaxis. Buy or Sell the Stock?They’re here. After years of tweets, teasers, and timelines that aged like unrefrigerated dairy, Tesla NASDAQ:TSLA officially launched its long-awaited robotaxi service in Austin, Texas.
The self-driving revolution, we were told, would arrive like a lightning bolt. Instead, it quietly rolled up to the curb with a safety monitor riding shotgun.
On Sunday, ( as promised ) a small, highly curated fleet of Teslas — fully driverless, but not entirely unsupervised — began picking up paying passengers in an isolated section of Austin. CEO Elon Musk, as usual, led the cheer squad, declaring victory on X.
“Super congratulations to the Tesla AI software and chip design teams on a successful robotaxi launch!! Both the AI chip and software teams were built from scratch within Tesla.”
Investors, naturally, perked up. Tesla shares edged higher by more than 5% Monday morning as Wall Street tried to figure out whether this was the long-awaited catalyst for another rally… or just another “sell-the-news” moment that fizzles as quickly as the hype fades.
🔔 The Soft Launch Heard Around The Internet
Let’s not get carried away. This wasn’t a citywide revolution. Tesla’s launch was extremely limited — more of a PR exercise than a true market rollout. Only a handful of Teslas were involved, operating in a tightly controlled, geofenced area.
The riders? Carefully selected influencers, many of whom were more excited to film TikToks than analyze technical driving capability. In other words, this wasn’t exactly New York City rush-hour stress testing.
The rides cost a flat fee of $4.20, because, of course they did. And while the cars drove themselves, safety monitors sat in the front passenger seats — a very human reminder that the project is still very much in beta mode.
The bigger question for investors: Does this prove Tesla’s technology is ready for prime time? Or is it simply an appetizer served years before the main course?
📈 The Market Reaction: Buy the Rumor, Sell the Launch?
Here’s where things get tricky for traders.
The stock market, as always, is forward-looking. Tesla stock didn’t just wake up bullish on Monday because of a few rides in Austin — it’s been rallying for months because of the promise of robotaxis.
Since Tesla’s big October 10 robotaxi event — where Musk laid out plans to launch a self-driving cab service in 2025 — shares have climbed roughly 35%. Much of that gain is already baked into expectations for Tesla finally delivering on what Musk has been promising since at least 2016.
Now that the product is technically “live,” even in tiny demo form, some traders are wondering: is this the start of an even bigger rally?
The answer probably depends on how fast Tesla can scale. And that’s where reality gets stickier.
🤔 The Scaling Problem: A Long Road Ahead
As exciting as Sunday’s launch may have been for influencers and Tesla superfans, it’s not exactly proof of scalability. Deploying 10 carefully monitored cars in a tiny slice of Austin is one thing; blanketing entire metro areas, or states, or countries is another beast entirely.
Tesla’s AI software may be improving, and its in-house chip design gives it some vertical integration advantages. But scaling fully autonomous fleets will require navigating a minefield of regulatory, safety, and logistical challenges — not to mention stiff competition.
Alphabet’s Waymo is already operating robotaxi services in Phoenix, San Francisco, and Los Angeles, with years of public road testing under its belt. Cruise (General Motors) ran its own driverless service before recently pausing operations after high-profile safety incidents. The technology arms race is fierce — and far from settled.
Industry experts continue to caution that mass-market robotaxis may take years — if not decades — to fully materialize. And while Tesla loves to move fast and break things, cities, regulators, and insurance companies tend to prefer a bit more caution when thousands of driverless vehicles are involved.
📝 What’s Actually Priced Into Tesla Stock?
Here’s where this gets existential for Tesla bulls.
A huge chunk of Tesla’s market valuation — some would argue most of it — now rests on the idea that it isn’t just a car company. It’s an AI company. A software company. A robotics company. A future robotaxi empire. If those narratives start to weaken, so does the multiple.
Tesla remains dominant in EV production and it still benefits from profit margins (about half of the profits coming from selling regulatory credits to other carmakers). But even Musk himself has made clear that Tesla’s long-term valuation depends heavily on successfully delivering robotaxis and humanoid robots.
If Sunday’s soft launch is the start of something truly scalable, then maybe the valuation holds up. If it stalls — either due to regulatory hurdles, technological ceilings, or public skepticism — the market may need to reevaluate just how much of Tesla’s price reflects reality versus dreams.
👀 Bottom Line: Revolutionary or Just Another Test Ride?
So, should you buy or sell Tesla after its long-awaited robotaxi debut?
That depends on how you frame this moment. The bulls see a trillion-dollar industry being born, with Tesla perfectly positioned. The bears see a carefully staged PR event masking how far away true autonomy still is.
For now, Tesla gets credit for being bold — even if it’s bold enough to roll out a very small, very managed test.
But markets eventually ask: “What’s next?” And unless Tesla can quickly scale from 10 cars in Austin to fully functioning fleets in major cities, a victory lap here could feel a little premature.
As always with Tesla: the story is thrilling, the stock is volatile, and the future is still very much under construction.
And with its earnings just around the corner — you’re following the earnings calendar , right? — things might just be getting exciting.
Off to you : Which side are on? The bullish traders looking to add to their long positions or the bearish sellers who’ve been calling “overvalued” for years? Share your thoughts in the comments!

Stock Market Forecast | TSLA NVDA AAPL AMZN META MSFTStock Market Forecast | !nq1! !es1! SPY QQQ
Mag 7 Forecast | NASDAQ:TSLA NASDAQ:NVDA AAPL AMZN META MSFT GOOG

TESLA PRICE ACTION 20JUNE 2025This is the price action of Tesla . I have discussed everything deeply and if you have any doubts then feel free to message or leave a comment.
I am bullish on Tesla.
NOTE:DO NOT SHORT TESLA

TSLA JUNE 20 2025 READ NOTESThis is momentum based price targeting & Tesla can easily do $390 but before that 342 is a solid resistance. From there we can get a dip and then price can continue the up move further
ANY NEWS IS TO BE AVOIDED
Now price action which is way superior is clearly suggesting the same up move.
I fact RSI is saying $400++ can come but it would be super dafe to exit around $390
If you nave any doubts then you can leave a comment.

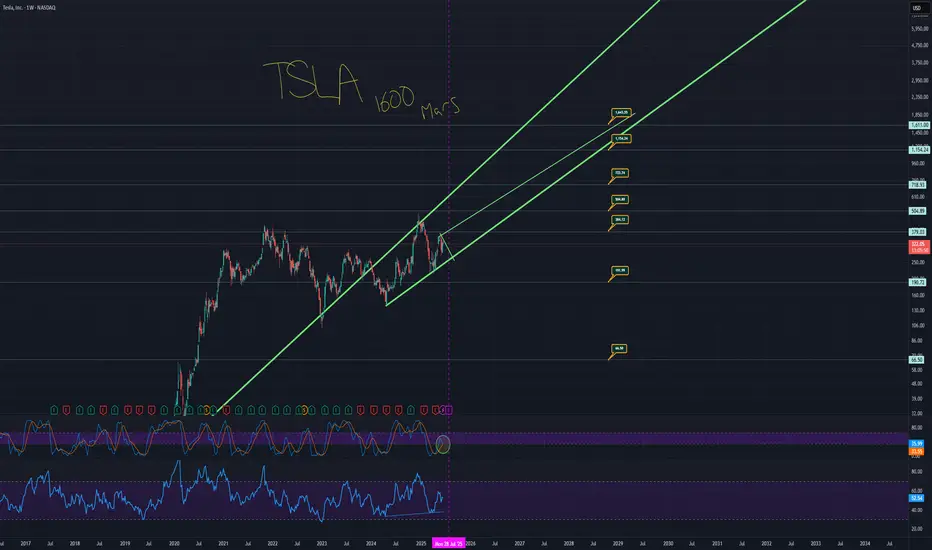
TSLA TO 1600, YOU SAW IT HERE FIRSTHere's the TA that takes Tesla legitimately to 1600.
The monthly chart has a trend that is currently acting as support.
The price has fallen under that trend.
Price action is also over a massive support trend from the weekly chart.
These are the two thickest green trends.
When you zoom back and look at TSLA as a whole, you see the bigger picture.
You have a situation where the low side takes you to around $60 to 70 dollars with a low of around $48. And then you have the high side taking you to around 1600. It sounds like a candidate for a stock reverse split.
Essentially, don't miss out on this potential solar data fast car thingy ready to really zoom.
Here is the chart with the auto fib numbers showing potential targets.
Remember, this likely doesn't occur all in one night, but the projection is really looking like it takes off from earnings. Projection line in yellow.
You have an opportunity where short term trends go to a strong long term trend which climbs to a support trend meaning price can literally take off from multiple of these trends meaning, we can price action go from 420 down to 250 and back up to 1600 in less than a year total.
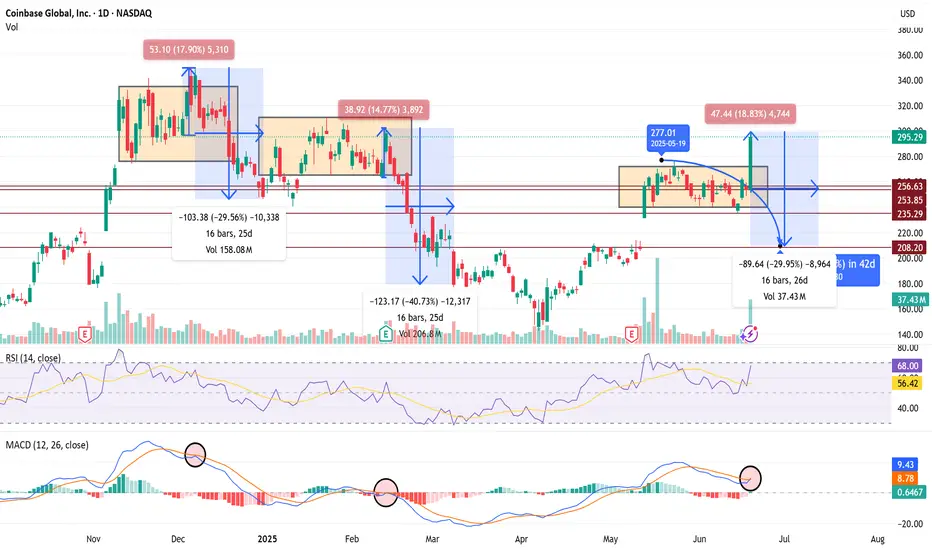
$COIN 30% Pullback Confirms if we Fakeout Recent 15%+ Rally 🧨 COIN SHORT TRADE IDEA — FAKEOUT TRAP IN PLAY
Ticker: NASDAQ:COIN
Date: June 20, 2025
Thesis: Breakout trap setup — expecting a rug pull / red reversal tomorrow to confirm.
🔍 Context
Price broke above range today with a big +18.8% candle to $295 — but...
Volume spike may signal exhaustion, not strength.
RSI = 68 → near overbought
MACD curling into a bearish cross — same signal preceded the last -30% and -40% drawdowns.
History: Same range-break setups in Dec and Feb collapsed hard (-30 to -40%) over 16–25 days.
💣 Trade Plan (Short Setup)
Entry Trigger:
🔻 Enter short if price closes below $277 tomorrow — confirms breakout trap.
Targets:
🎯 Target 1: $253 (top of old range)
🎯 Target 2: $235 (mid-range support)
🎯 Target 3: $208 (full breakdown move, matches last 2 cycles)
Stop Loss:
🛑 Above $297 (breakout highs)
Timeframe:
1–3 weeks (16–26 bars historically)
🧠 Bias
Bearish unless bulls hold $280+. If we get a big red daily candle tomorrow, fakeout confirmed — high-probability follow-through expected.
TESLA: Can double its price ($640) by the end of the year.Tesla is neutral on its 1D technical outlook (RSI = 51.064, MACD = 4.910, ADX = 24.971), consolidating for the past week, but remains over its 1D MA50 and 1D MA200 nonetheless. Since the major market bottom on January 6th 2023, it's been trading inside a Channel Up and this is its 3rd bullish wave. The 2 prior rose by +196.67% from the bottom of the pattern (despite the 2nd breaking marginally under it). Consequently, this suggests that Tesla can rise by +100% from the current $320 level, before the Channel Up tops (HH) again. We are bullish, TP = 640.
See how our prior idea has worked out:
## If you like our free content follow our profile to get more daily ideas. ##
## Comments and likes are greatly appreciated. ##

TSLA Honey Ticking Bull Trap!TSLA has a beautiful big ars bear flag! While it should have broken down to trigger a short trade, it decided to Honey Tick people right into a Trap!
It formed a perfect MEGAPHONE in wave 3 up that has now CRACKED! This is a much juicer short setup with the potential of collapsing from here and taking out the entire bear flag and MORE!!
First, we need a lower low and then a lower high and off we GO BABY!!!
Don't Get HONEY TICKED!
As I always say, never EVER!! Invest in toxic people like Elona. They always blow themselves up in the end. It's in their nature!
Click boost and follow, let's get to 5,000 followers. ;)

$TSLA | Robotaxi Launch Incoming? - Plan Rock Solid w/ 3 TradesNASDAQ:TSLA
Launch could be as soon as Sunday, June 22. However, Musk has emphasized safety as priority. There is the potential to undercut traditional taxi services at less than $0.20 per mile. Tesla’s government and military contracts are key growth drivers but further clash between Musk and President Trump could cause further volatility in price action. Long-term $271 is a critical price point. There are several ways to play Tesla:
* Range between $270 and $350
* $330 to $400 into price discovery
* Breakdown under $270 targeting $212 and $204

SPY & MegaCap strengthSPY saw a very strong gap up, negating most of the selling from last week.
despite rising tensions in the middle east - investors have shrugged off volatility and bought the initial dip.
This may be proving that "war" is good for stocks.
we observed a very close correlation between the indices and oil today.
As oil reversed higher - markets saw a bit of weakness. As oil fell markets rallied.
TSLA trying to break a 4 hour bullish pattern
META new Smart Glasses release causing a surge.
MSFT new all time high tap
NVDA firm with ripping semiconductors
GOOGL looking strong for continuation
AMZN moving nicely off support
AAPL lagging the mega's but positive

TESLATesla is in the correction right now for bigger structure. It can go up to break the recent top with small correction or it can breakdown further before a push up.
Disclosure: We are part of Trade Nation's Influencer program and receive a monthly fee for using their TradingView charts in our analysis.

TSLA June 2025 Monthly Support & Resistance Lines Valid till EOMOverview:
The purple lines serve as support and resistance levels for TSLA stock throughout the month of June. When the price approaches these lines from either the bottom or the top, I will consider taking long or short positions in TSLA stock, depending on the direction of the price movement.
Trading Timeframes
I usually use 30min candlesticks to swing trade options by holding 2-3 days max. Some can also use 3hr or 4hrs to do 2 weeks max swing trades for massive up or down movements.
I post these 1st week of every month and they are valid till the end of the month.
Extra:
I added Blue Lines which are weekly line for June 16th to 20th.

TESLA WILL GO DOWN|SHORT|
✅TESLA is going up now
But a strong resistance level is ahead at 336$
Thus I am expecting a pullback
And a move down towards the target of 320$
SHORT🔥
✅Like and subscribe to never miss a new idea!✅
Disclosure: I am part of Trade Nation's Influencer program and receive a monthly fee for using their TradingView charts in my analysis.
