Tesla (TSLA) | The best place to buy🎯Hello traders, TESLA in daily timeframe , this analysis has been prepared in daily timeframe but has been published for a better view in 2 day timeframe.
We preferred to do the wave counting logarithmically, but because the structure of the previous waves was not clear, we left it out.
Based on the count that was done and according to the channeling done, we realized that waves 1, 2, 3 and 4 are complete and now we are inside wave 5 and from this wave we are either at the beginning of wave 5 or at the end of wave 4.
Wave 4 is likely to end in a zigzag pattern, and Wave 5 will break through the channel and the red circle will rise to the specified targets.
But if the 980 support is broken, Wave 4 will be complicated and will fall at least to the previous price floor.
🙏If you have an idea that helps me provide a better analysis, I will be happy to write in the comments🙏
❤️Please, support this idea with a like and comment!❤️
Tslaanalysis

TSLA (TESLA) LONG SET UP (UPDATE)TSLA TRADE UPDATE
Our Tesla Gap fill entry has hit Take Profit 1 for 680 pips
We might get a pullback to $950 before hitting take profit 2 at $1090
I plan to add a second entry if we get a pullback to $950 before Take Profit 2
BUY TSLA at $932.00 ACTIVE ENTRY
Take Profit 1- $1000.00 (Target 1 Reached)
Take Profit 2- $1090.00
Take Profit 3- $1190.00
Take Profit 4- $1243.00
Support: $1000.00-$980.00-/ $940.50-$930.00/ $909.00/$860.00/ $830.00 / $780.00-$780.00
Resistance: $1078.00/ $1115.00/ $1196.00/ $1245.00

TSLA BREAKOUTTSLA confirmed a breakout on Friday Close
Breakout from 10 Month Long Base
Price is in strong uptrend since MAY (Lower Highs)
Strong earnings helped the breakout

TESLA BOTTOM and run into Earnings?There is a wolfe wave setup on the 4 hour time frame with extended hours ON. The projected target is calculated by extending a linear line between pivot 1 and 4 and projecting the line. This is represented as the green perforated line, as shown in the chart. The projected target is approx 1200 by Feb 2022; however, there is a 4 hr ttm squeeze which may introduce short term momentum that may drive the share price to 1032 (21 day ma) 1047. If a short squeeze develops, then the share price of tesla may run towards 1243 on the the earnings run up.

845 gap fillI suspect elon sells twice this week causing the price action to fill the gap at 845. Until he's done selling, which could happen by the end of the year, I don't see a short-term base forming

TSLAHello. Due to the negative divergence in the weekly time frame and the formation of the weekly candle, it is predicted that the correction will continue

TSLAWith last week’s dip Tesla, Inc. (NASDAQ:TSLA) filled the gap from October, while the stock clings to uptrend support and holds up just above the prior breakout spot at $900. As long as it holds this key psychological area as support, I would feel comfortable to start a short-term long position. MACD is also displaying a positive divergence indicating trend reversal. Might bounce next week.

TSLA - PUT SEATBELTS! Yo,
Seems like a bumpy ride :D
Good Luck and have a nice weekend!
T347.
NASDAQ:TSLA

TSLA (TESLA) LONG SET UP (GAP FILLED)BUY TSLA at $932.00
Take Profit 1- $1000.00
Take Profit 2- $1090.00
Take Profit 3- $1190.00
Take Profit 4- $1243.00
Support: $940.50-$930.00/ $909.00/$860.00/ $830.00 / $780.00-$780.00
Resistance: $980.00-$1000.00/$1078.00/ $1115.00/ $1196.00/ $1245.00


$TSLA Potential gap fill play further sell off?looking to see if we get a further sell off on tsla, 950.50 is a double bottom on the 4hr and 1 day, if that breaks we can might be able to get into the gap that looks like starts at 944.20

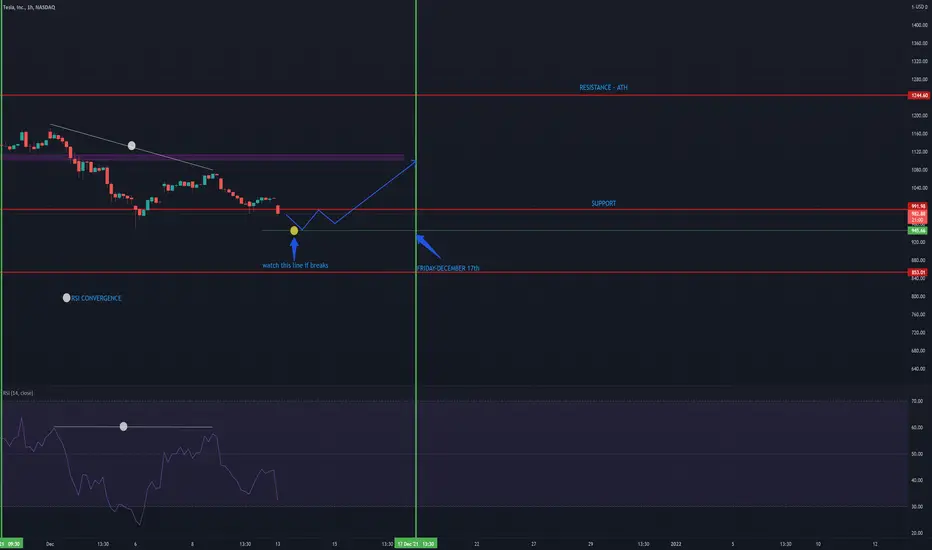
$TSLA Tesla-Simple Technical$TSLA Tesla Motors This Week Analysis
NOTES:
-There was an RSI Convergence between December 01-08
-- WHAT IS RSI CONVERGENCE?: RSI is showing an uptrend while the chart is showing down. There will be an upward price movement/change. This is opposite of RSI DIVERGENCE
-$TSLA is currently at $981/s
-Watch the line at $945 -- if it tests the line there should be upward movement -- if it breaks the line in downtrend it will move lower.
- AFTER RSI CONVERGENCE there should be an upward trend movement this week
- Price should bounce at 995 and move towards 1,100
$TSLA aiming for one last push.$TSLA forming a bullish pennant, or symmetrical triangle. buy call above $1030 sell at around $1061+
TESLA STOCK TSLA CORRECTION LEVELSTSLA stock is fighting for the price level around $1000. When we close lower, we can test the support around $880.

Elon Musk dumps another $1 Billion TSLA StockIf you haven`t sold when he got the answer "yes" on twitter for selling his shares:
Then you should know that Elon Musk sold another 934,091 TSLA shares, according to filings with the SEC published on Thursday.
The shares are worth $963.2 million.
Ark Invest also sold TSLA shares.
What is your next move?
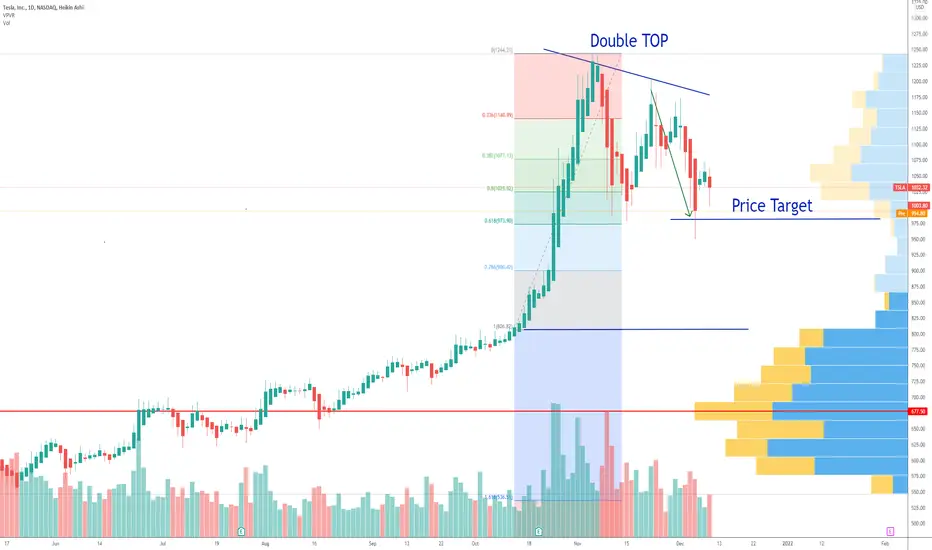
TSLA Analysis, Double Top !!Hello everyone, as we all know the market action discounts everything :)
_________________________________Make sure to Like and Follow if you like the idea_________________________________
TSLA is currently trading in the upper part of its 52-week range. The S&P500 Index is also trading in the upper part of its 52-week range, so TSLA is performing more or less in line with the market.
The long-term trend is positive and the short-term trend is neutral. The long-term trend may just continue or reversal may be around the corner!
A double top pattern has been spotted on the daily chart which could lead the TSLA stock back to the $850 levels.
Possible Scenario for the market :
The market is trading at $1014.97 and it's nearing the neckline of the double top pattern located at the $1001 range, if a breakout happens of that line we could be seeing the TSLA stock drop to the $850 level. and a lot of the indicators are showing Bearish signs that would support the double top pattern.
In case the support line held strong then we could be seeing a Bullish movement that will lead the TSLA stock price back to the resistance level located at $1112.85
Technical indicators show :
1) The market is below the 5 10 20 MA and EMA indicating a Bearish short-term trend, But still above the 50 100 and 200 MA and EMA (Bullish long-term trend)
2) The RSI is at 44.20 showing some weakness in the market.
3) The MACD is below the 0 line indicating a bearish state in the market with a negative crossover between the Signal line and the MACD line.
Support & Resistance points :
support Resistance
1) 1029.10 1) 1168.14
2) 976.28 2) 1254.36
3) 890.06 3) 1307.18
Fundamental point of view :
Tesla Inc has asked a U.S. court to affirm an arbitrator's recent decision dismissing a former engineer's claims that the automaker fired and defamed her for raising concerns about defective floormats and contracting practices.
TSLA has a Return On Assets of 6.00%. This is better than the industry average of -1.33% and The Earnings Per Share has grown by an impressive 174.51% over the past year.
Looking at the last year, TSLA shows a very strong growth in Revenue. The Revenue has grown by 66.27% and based on estimates for the next 5 years, TSLA will show a very strong growth in Revenue. The Revenue will grow by 35.52% on average per year.
This is my personal opinion done with technical analysis of the market price and research online from Fundamental Analysts and News for The Fundamental point of view, not financial advice.
If you have any questions please ask and have a great day !!
Thank you for reading.

Gap Fill?I could see price action lose support in both short term trends to eventually fill the 908 gap before heading back to 1500

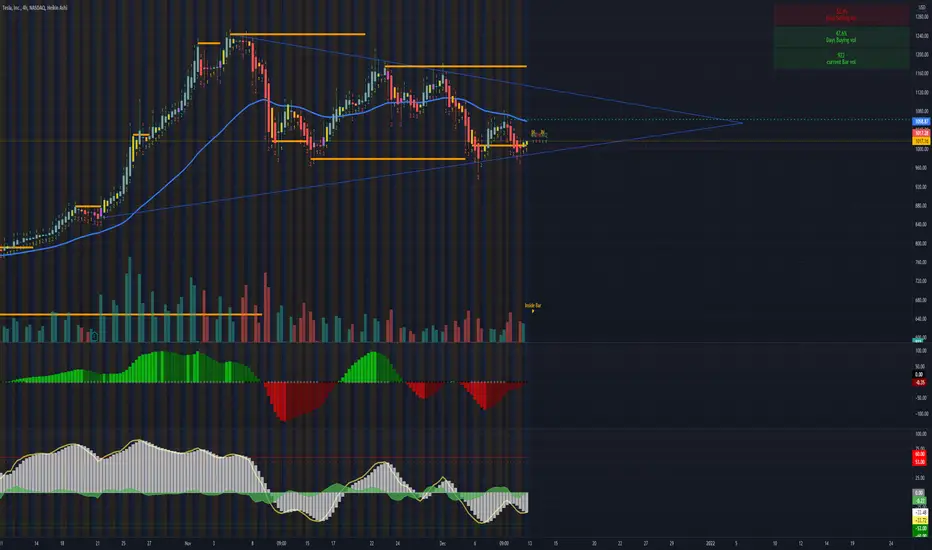
$TSLA consolidating triangle $TSLA hit $1200 for a gap filled and is now consolidating its way down, looking for it to hold support around the $1025 area. As long as price stay above previous low of $980, Tesla should stay consolidating in this triangle pattern before breaking to the upside targets of $1400+. A break below $980 can then $TSLA can possibly go down to fill the open gap at $900.

TSLA Mixed sentiment but leaning a little bearish at the momentTSLA looking still in a consolidation possibly will we visit lower for a short term standpoint ?
Need to take back the 20 SMA to catch more ask !

$TSLA - New Rising Channel with Imminent BreakoutNew wedge is forming with Bullish Pennant setting up for an imminent breakout. Great buying opportunity.
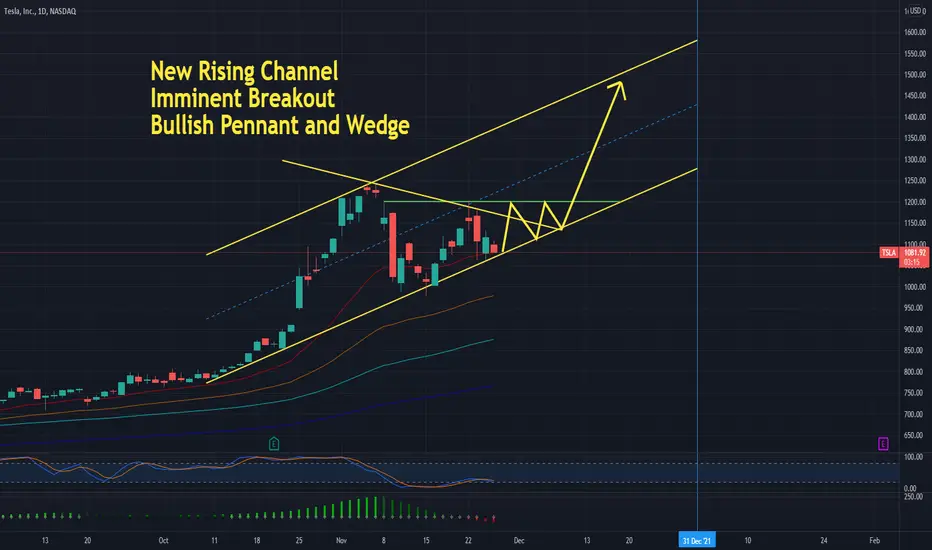
$TSLA - Bullish Penant SetupTesla Stock has formed a bullish pennant. It is currently consolidating and coiling through, looking for a imminent breakout in the near term.

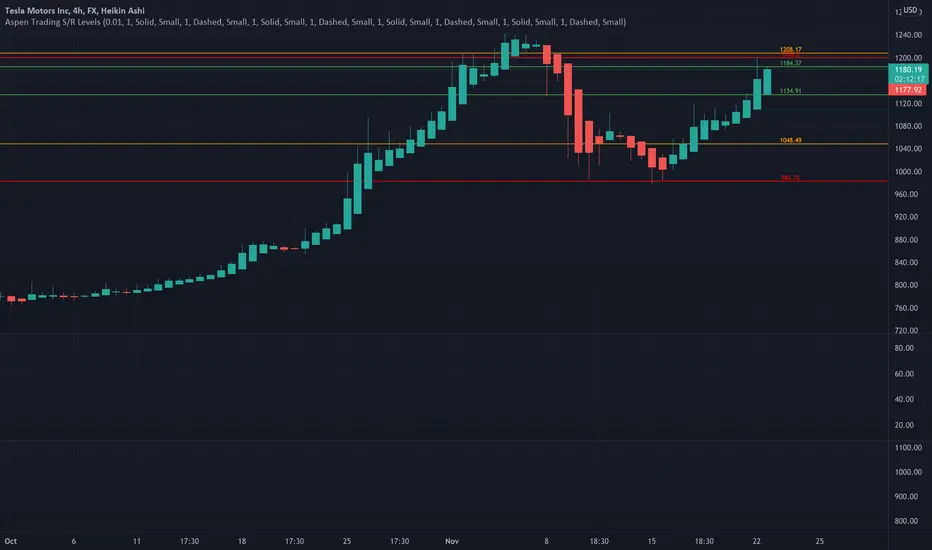
TSLA had a beautiful bounce from support Using Aspen Trading Support & Resistance Levels, TSLA has bounced from 982 support and can face the resistance at 1208.
A move above 1208 level will see further upside to TSLA.
Note - Aspen Trading S/R levels are invite only. They can be accessed through my profile information.
Disclaimer: This analysis is for information purpose only and does not constitute any investment advice.
$TSLA StocksWaiting to short this at $1200 but Bullish momentum to fill the GAP left by Elon.
TSLA extremely violatile looking for heavy rejection around 1050
