Daily TSLA forecast timing analysis by Supply-Demand strengthStock investing strategies NASDAQ:TSLA
View a Chart with Supply-Demand(S&D) strength forecast: www.pretiming.com
Investing position about Supply-Demand(S&D) strength: In Rising section of high profit & low risk
S&D strength Trend Analysis: About to begin an adjustment trend as a upward trend gradually gives way to a slowdown in rises and falling fluctuations
Today's S&D strength Flow: Supply-Demand strength has changed to a strengthening buying flow when stock market opening.
D+1 Candlestick Color forecast: RED Candlestick
%D+1 Range forecast: 0.5% (HIGH) ~ -1.0% (LOW), -0.2% (CLOSE)
%AVG in case of rising: 2.8% (HIGH) ~ -1.4% (LOW), 2.2% (CLOSE)
%AVG in case of falling: 0.6% (HIGH) ~ -3.0% (LOW), -1.8% (CLOSE)
Stock Price Forecast Timing Criteria: Stock price forecast timing is analyzed based on pretiming algorithm of Supply-Demand(S&D) strength.
Tslaanalysis

TSLA stock price forecast timing analysis. 13-JunStock investing strategies by pretiming
TSLA
Investing position about Supply-Demand(S&D) strength: Rising section of high profit & low risk
Supply-Demand(S&D) strength linkage Trend Analysis: In the midst of an adjustment trend of downward direction box pattern stock price flow marked by limited rises and downward fluctuations.
Today's Supply-Demand(S&D) strength Flow: Supply-Demand(S&D) strength flow appropriate to the current trend.
Possibility of change in forecast timing: Forecast timing has low variability conditions. because they maintain the proper flow of supply - demand in the current trend.
D+1 Candlestick Color forecast: GREEN Candlestick
%D+1 Range forecast: 0.5% (HIGH) ~ -1.4% (LOW)
%AVG in case of rising: 2.7% (HIGH) ~ -1.6% (LOW)
%AVG in case of falling: 0.7% (HIGH) ~ -3.1% (LOW)
Stock Price Forecast Timing Criteria: Stock price forecast timing is analyzed based on pretiming algorithm of Supply-Demand(S&D) strength.
Read more a detailed Forecast Analysis Reports that candlestick shape and %change, S&D strength flow in the future 7 days.
www.pretiming.com
$TSLA, TP ~ $230 The intraday uptrend is pushing the price, step-by-step to the target price at $230, it's fact. Hold and Keep Calm.
Resistance ~ $230
Support ~ $200
TP ~ $230 and higher
Find my name on Reddit for serious talks or to learn more ;)
GL.

Tesla Short ReversalHi guys its Brian here with a short opportunity for Tesla.
Tesla is currently in a downtrend ever since start of the year as seen by the downward sloping trend channel. The price has also always been consistently below the ichimoku cloud from February onwards.
Tesla reached the support level of about 175 level at the start of June and showed an upward correction but the correction is starting to end as seen by the strong red candle upon hitting the blue trend resistance channel. Volume also increased on the 2nd red candle showing there is strong bearish pressure driving prices downwards.
If shorting here, take profit could be set at about 195ish or even the previous support level at 180ish
www.brianchai.com
Free Trading Group

TSLA Count With Elliot Wave - Parabolic Movement Ahead. I noticed that every time i did trend based fib extension, of TSLA i always get a 1:1 count. You can clearly see the correction, when it bounced of the wave 3 at 252. Now it did EXACTLY the same from wave 5.
Which means 5 waves are done, and we have a huge move ahead of us.
First Target is: 350 USD

$TSLA Intraday trend is up, main trend still down.Main trend - Down
Intraday trend - Up
Resistance ~ $230
Support ~ $200
In my view, the downtrend is still dominate here, so I don't the fact of confirmation of its end.

TSLA Good entry point at $225As 78.6% Fibonacci retracement has been reached, good entry point might be between $225-$227 for the long term
Good Luck


TESLA - BEARISHTesla has broken out of the bullish channel and is now looking very bearish.
Blue triangle indicates the current range.
Green box is buy.
Red box is sell.
Blue line indicates potential support/resistance .
Red line indicates t/p.
This is a log chart.
This is not financial advice. All charts shown on my page, including this one, are just for fun.
If you enjoy my ideas please give this post a like and follow my page if you would like to see future posts! :)
This chart is made using fib channels.

TSLA HUGE UPSIDE POTENTIAL - 380 TargetBUY:245-250
SL: 240
TP: 380
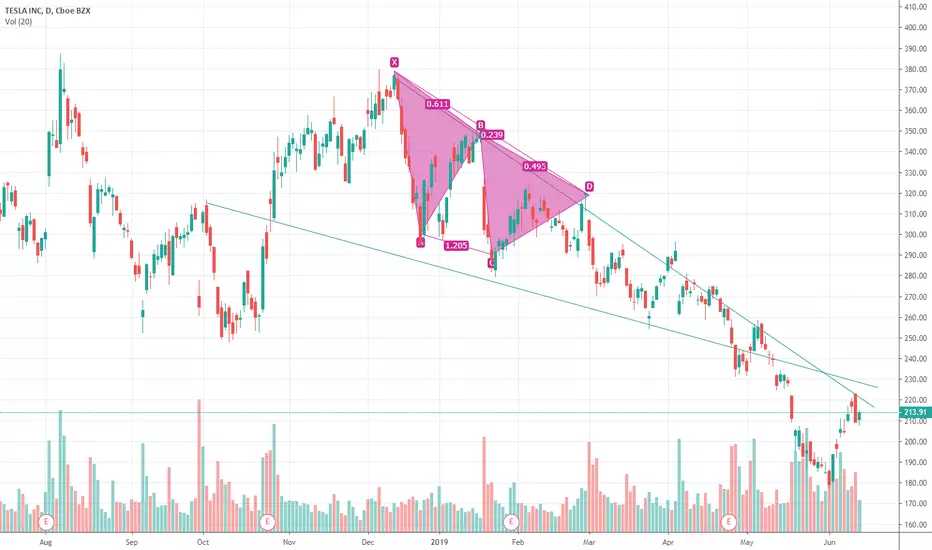
Leading diagonal down. ABCDE is about to finish. We are looking at huge upside potential. Braking the current support, will not look good for TSLA. If it breaks current support 180 target is likely.

TSLA - Short the breakdownTSLA currently making the A wave of monthly degree correction.
watch breakdown from here for a short.

Don't open any long position yet, just shortsTesla has been on a downtrend for a while. it is under the 26 SMA and under the SMA 70 (the baseline). MACD has crossed down (a long time ago) and is under the zero line. It will have a pullup, but the overall trend is down, don't take any risk yet if you are a bull.
If you are a bull, wait for at least 3 - 5 blocks to close over the SMA 70 that could signal an uptrend, but wait till that happens to make the proper analysis.
If you are a bear keep enjoying the downtrend.
Trade safely and good profits for all.

$TSLA LONG | CURRENTLY ON SUPPORT LEVELHello hello hello...
It's time for a brand new analysis, today we're breaking out $TSLA.
This chart is on 1 hour timeframe. As we can see $TSLA has hit the 250 mark for 2 times already and it has bounced back to 300-340 mark. This pattern has hit already twice in a row, now we will see if it happens for the third time.
RSI9 is pretty nice indicator in downtrends and if you look at the RSI bottoms it is lining up with other dips. After these dips it everytime does a correction. Even tho Wall Street is now skeptical about Tesla's future, I still believe in chart analysis. It will get up! :)
#LONGTESLA

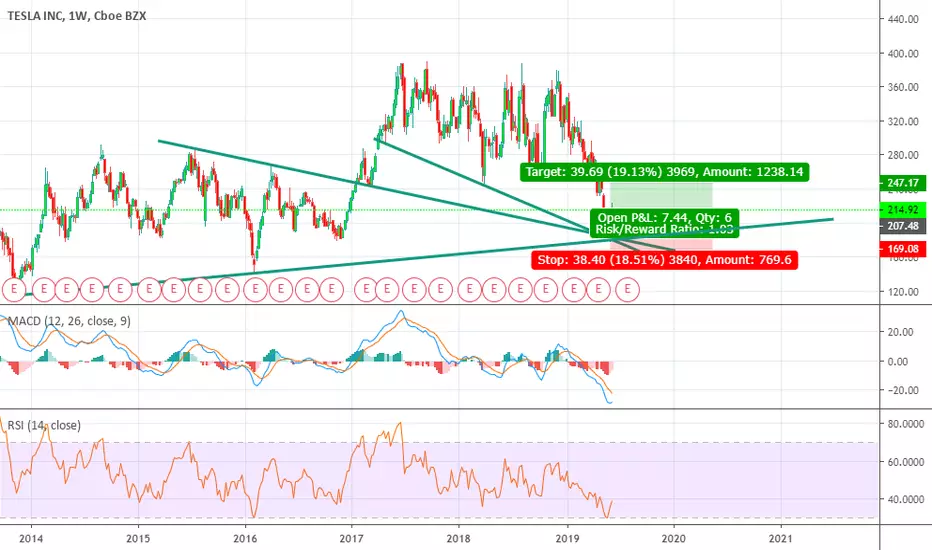
Starting to look familiar? TSLASimple stop loss @ 250 gives you a good R/R here...
- Intrinsic value >50% Share price is $273.36 vs Future cash flow value of $550.18
(^info courtesy of simplywall.st)

Can't see TSLA to go much lower..Can't see TSLA to go much lower.. Is it time for TSLA to finally bounce?

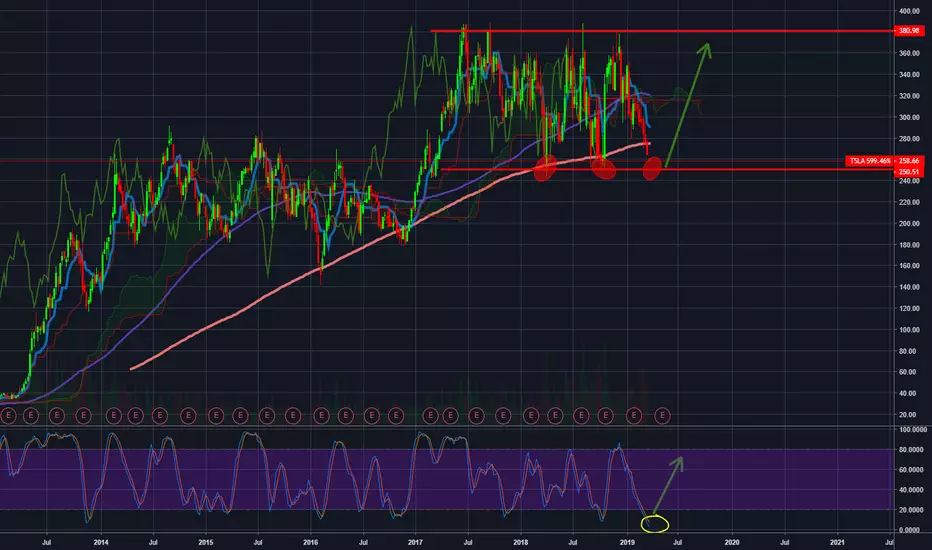
#TSLA With huge potentialThe Stochastic indicator shows us about Oversold as we are below 20 points. This is the first reason for our recommendation for buying. The second reason is the price stuck within a price range between 250 and 380 from July 2018 with support and resistance as clear as seen in the graph and at this moment we are very close to support (With recent declines in indices you should be careful that this can lead to a breakout of support and then further declines)
Sell TSLA:
Entry Price: 257
Take Profit: 380

Bought $TSLABought TESLA .
Monthly support trendline support
260ma weekly support
If if dips further i'm just going to buy more!!!!!

$TSLA 1W$TSLA 1W
$TSLA weekly, close to touche the 260ma weekly, just where the monthly support is… $$$ that’s look like nice long position right there around sub $270. \u2028\u2028Take profit 1 could be around the $360. Is something like a $90 move upwards :)\u2028

$TSLA Giga-move
In the ranging market from December 2013 to December 2016, there were what I see as 3 main moves between $177-$290.
In the current range from March 2017 to now March 2019, you can also see 3 main moves, just a little messier.
The UTA (Ultimate Trend Analyser) and Spectro-O confirm that there is plenty of room for a big move up over the coming months. Spectro-O looks like an almost perfect fractal from February 2016 to February 2017 where I have highlighted. The UTA confirms volume has changed and we're near the optimal entry.
The 50 month MA has been tracking as a well used dynamic support with TSLA and we have come down and kissed it just over the last week, found support and started moving on.
Optimal entry will be under $280 and will need to implement a well thought out stop loss strategy if you're wanting to capture the full move.
Fundamental fuel:
New Giga-factory- www.zacks.com
Model Y reveal in 4 days- cleantechnica.com

$TSLA 1W$TSLA 1W
$TSLA weekly, close to touche the 260ma weekly, just where the monthly support is… $$$ that’s look like nice long position right there around sub $270. \u2028\u2028Take profit 1 could be around the $360. Is something like a $90 move upwards :)\u2028

TSLA - Short Swing, Good entry R/RUpdated Verison from previous post. New Entry and Stop Loss
Entry = 316 - 320
Stop loss = 330.5
Target 1 = 280, R/R = ~2.6
Target 2 = 253, R/R = ~4.5
