Tesla - The all time high breakout!🚗Tesla ( NASDAQ:TSLA ) will break out soon:
🔎Analysis summary:
For the past five years Tesla has overall been consolidating between support and resistance. But following the recent bullish break and retest, bulls are slowly taking over control. It is actually quite likely that Tesla will soon break above the previous all time highs.
📝Levels to watch:
$400
🙏🏻#LONGTERMVISION
SwingTraderPhil
Tslaforecast

TESLA ANALYSIS CAN WE HIT 380? Evening everyone
Here is the analysis on Tesla currently:
Thesis For Bullish: If we break the highs of 336 then we can hit levels of 380 or higher
Thesis for Bearish: If we break the low at 298 then a drop down to 291 then 275 makes sense
Trade Smarter Live Better
Kris/Mindbloome Exchange

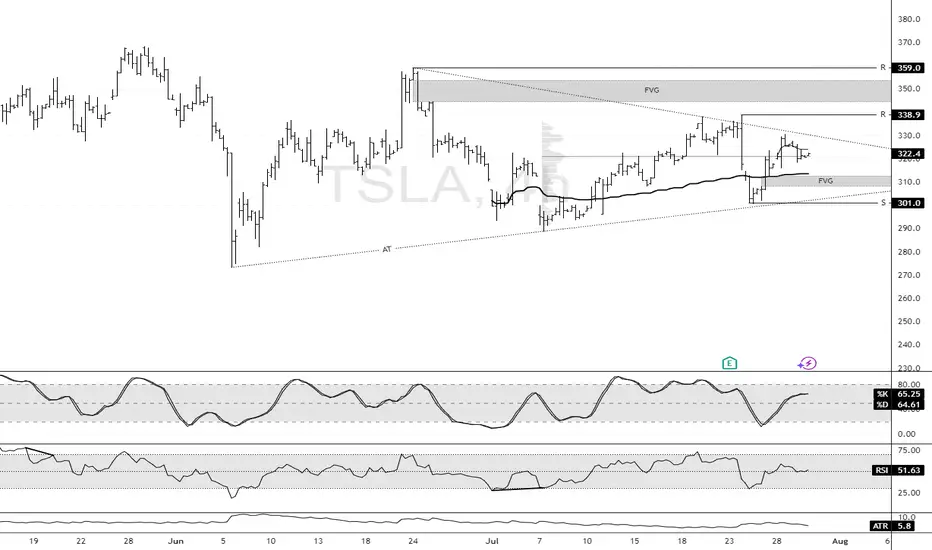
Tesla Builds Toward Fair Value GapFenzoFx—Tesla (#TSLA) bounced from the ascending trendline and closed yesterday's session at the volume point of interest, the $322.3 mark. This level is above the monthly VWAP, meaning bulls are gaining, and bears are losing money.
That said, we expect the uptick in momentum to resume, targeting $338.9, and if this level is breached, the stock will likely aim to fill the Fair Value Gap at $350.0.
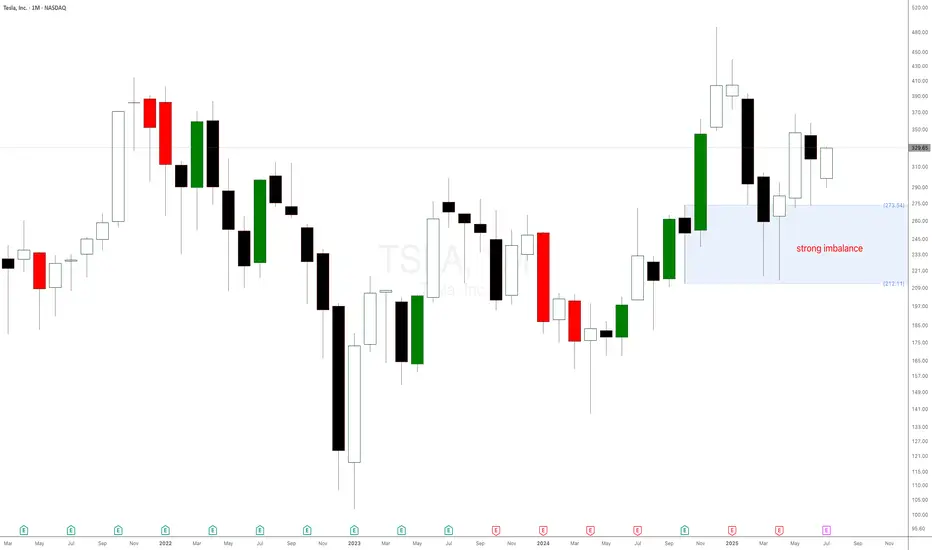
Don’t Listen to Elon Musk – Tesla Stock Chart Tells the REAL StoTesla Stock Set to Break Records: The Power of Monthly and Weekly Demand Imbalances at $273 and $298. Welcome back, traders! In today’s supply and demand breakdown, we’re diving deep into Tesla Inc. (NASDAQ: TSLA) — not from the noisy headlines or what Elon Musk just tweeted, but strictly from raw price action, demand imbalances, and the truth on the charts. Forget the fundamentals, forget the hype, because that’s already been priced in.
This is all about supply and demand, price action, and the power of patience.
The $273 Monthly Demand Imbalance: The Big Fish Made Their Move
A few weeks ago, Tesla stock pulled back to a significant monthly demand imbalance at $273. This level wasn’t just any zone—it was carved out by a strong impulsive move made of large-bodied bullish candlesticks, the kind that only institutions and whales create when they're loading up.
What happened next?
Boom. The market reacted exactly as expected, validating that monthly imbalance and setting the stage for higher prices. This is why we always trust the bigger timeframes—they hold the truth of what the smart money is doing.
Tesla -> The all time high breakout!🚗Tesla ( NASDAQ:TSLA ) prepares a major breakout:
🔎Analysis summary:
Not long ago Tesla perfectly retested the major support trendline of the ascending triangle pattern. So far we witnessed a nice rejection of about +50%, following the overall uptrend. There is actually a quite high chance that Tesla will eventually create a new all time high breakout.
📝Levels to watch:
$400
🙏🏻#LONGTERMVISION
Philip - Swing Trader

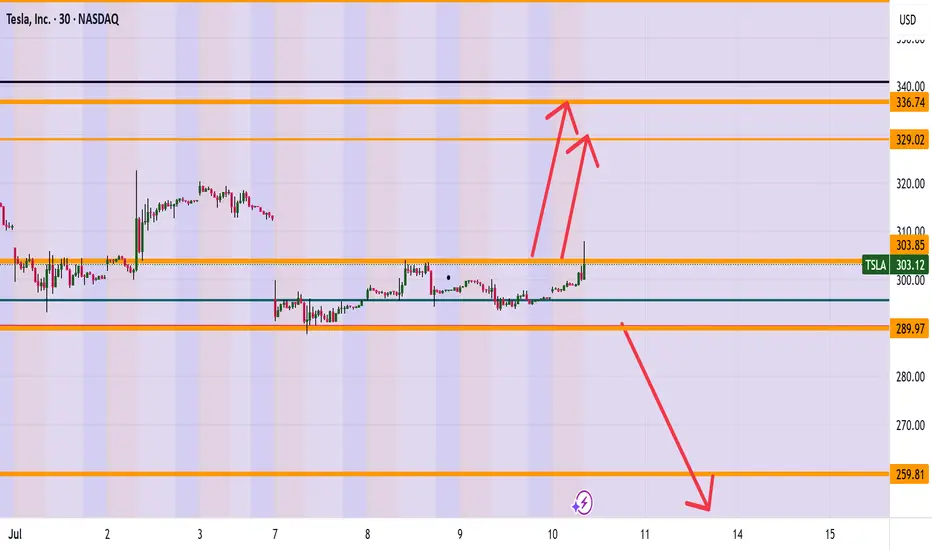
TESLA (TSLA) ARE WE HEADING TO 336? Morning Folks
It appears we are trying to break the highs of 304 and if we are successful a nice range up to 327-336 makes sense. However be careful if sink back down under 289 which then can see levels of 259 getting hit.
What are your thoughts on Tesla? Put in the comments section below
Kris Mindbloome Exchange
Trade Smarter Live Better
Tesla (TSLA) Leads Declines in the Equity MarketTesla (TSLA) Leads Declines in the Equity Market
Yesterday, President Trump announced that letters had been sent to the United States’ trading partners regarding the imposition of new tariffs — for instance, a 25% tariff on goods from Japan and South Korea. This marks a return to “trade diplomacy” under the America First strategy. The tariffs are scheduled to take effect on 1 August, though the date remains subject to revision.
As we highlighted yesterday, bearish signals had begun to emerge in the US equity market. In response to the fresh wave of tariff-related headlines, the major indices moved lower. Leading the decline — and posting the worst performance among S&P 500 constituents — were shares of Tesla (TSLA). The sell-off followed news of a new initiative by Elon Musk, who now appears serious about launching a political “America Party” to challenge both the Republicans and Democrats.
Trump criticised his former ally’s move on his Truth Social platform, and investors are increasingly concerned about the potential impact on Tesla’s business. Tesla shares (TSLA) fell by more than 6.5% yesterday, accompanied by a broad bearish gap.
Technical Analysis of Tesla (TSLA) Stock Chart
On 2 July, our technical outlook for TSLA anticipated the formation of a broad contracting triangle in the near term. Yesterday’s price action appears to confirm this scenario:
→ The sharp move highlighted the lower boundary of the triangle (marked in red);
→ The $317 level — where the previously rising channel (marked in blue) was broken — acted as resistance.
It is worth noting that during yesterday’s session, TSLA did not fall further following the gap down. In other words, the bears were unable to extend the sell-off, suggesting that the stock may attempt a recovery towards the $317 level. This area could potentially act as a central axis within the developing triangle pattern.
This article represents the opinion of the Companies operating under the FXOpen brand only. It is not to be construed as an offer, solicitation, or recommendation with respect to products and services provided by the Companies operating under the FXOpen brand, nor is it to be considered financial advice.

TSLA – Calm Before the Storm or Just Another Dip Buy?Tesla (TSLA) is trading around $315, bouncing off recent lows, but this isn’t just a clean technical setup. With Elon Musk’s political drama escalating (hello, “America Party”) and ongoing tension with Trump, TSLA is becoming a battleground stock with serious volatility.
As swing traders, that’s exactly where we thrive.
📍 Entry Plan
✅ Entry #1 – $315
✅ Entry #2 – $300
• Previous breakout zone — ideal for dip buyers
✅ Entry #3 – $265
• Strong macro support; only activated if market correction deepens.
🎯 Profit Targets
• TP1: $335
• TP2: $355
• TP3: 400+ – if sentiment + volume align with narrative momentum (think: Robotaxi or AI catalyst)
If $265 gets hit, I’m not panicking, I’m preparing for high-reward setups.
⚠️ Disclaimer: This is not financial advice. I’m just sharing my plan and technical zones. Always do your own research and manage your risk.
📌 Follow for more ideas based on price, narrative, and timing. Trade smart — not loud. 🧭📈

Tesla - This bullish break and retest!Tesla - NASDAQ:TSLA - confirmed the bullish reversal:
(click chart above to see the in depth analysis👆🏻)
Tesla recently created a very bullish break and retest. Therefore together with the monthly bullish price action, the recent rally was totally expected. But despite the short term volatility, Tesla remains bullish, is heading higher and will soon create new highs.
Levels to watch: $400
Keep your long term vision!
Philip (BasicTrading)

Musk-Trump Feud Sends Tesla (TSLA) Shares DownRenewed Feud Between Musk and Trump Drags Tesla (TSLA) Share Price Lower
The US Senate yesterday narrowly approved Trump’s so-called “big, beautiful budget bill.”
Elon Musk, who had previously criticised the bill for potentially adding $3.3 trillion to the national debt, warned that Republican lawmakers who supported it would face political consequences. In a post on X, Musk wrote:
“Every member of Congress who campaigned on reducing government spending and then immediately voted for the biggest debt increase in history should hang their head in shame! And they will lose their primary next year if it is the last thing I do on this Earth.”
He also reiterated his intention to establish a third political force under the name “America Party.”
In response, President Trump issued sharp threats:
→ to apply federal pressure on Musk’s companies by revisiting existing subsidies and government contracts (estimated by The Washington Post at $38 billion);
→ to deport Musk back to South Africa.
The market responded immediately to this renewed escalation in the Trump–Musk conflict. Tesla (TSLA) shares fell by over 5% yesterday, forming a significant bearish gap.
Technical Analysis of TSLA Stock Chart
Eight days ago, we analysed the TSLA price chart, continuing to observe price action within the context of an ascending channel (indicated in blue). At that point:
→ In mid-June, when the initial Musk–Trump tensions surfaced, TSLA managed to hold within the channel. However, as of yesterday, the price broke below the lower boundary, casting doubt on the sustainability of the uptrend that had been in place since March–April;
→ The price breached the lower channel limit near the $315 level — a zone that previously acted as support. This suggests that $315 may now serve as a resistance level.
As a result, optimism related to the late-June launch of Tesla’s robotaxi initiative has been eclipsed by concerns that the Musk–Trump confrontation may have broader implications.
If the former allies refrain from further escalation, TSLA may consolidate into a broadening contracting triangle (its upper boundary marked in red) in the near term, ahead of Tesla’s Q2 earnings release scheduled for 29 July.
This article represents the opinion of the Companies operating under the FXOpen brand only. It is not to be construed as an offer, solicitation, or recommendation with respect to products and services provided by the Companies operating under the FXOpen brand, nor is it to be considered financial advice.

Launch of Robotaxi Service Boosts Tesla Share Price by Over 8%Launch of Robotaxi Service Boosts Tesla (TSLA) Share Price by Over 8%
As previously announced by Elon Musk, Tesla has launched its robotaxi service in Austin, Texas. The cost of a ride is $4.20.
The service is not yet fully operational. It is more of an extended testing phase, as access is currently by invitation only, and a Tesla employee may be present in the back seat.
Nevertheless, the market responded positively — Tesla (TSLA) shares rose by more than 8% (comparing the closing prices of daily candlesticks).
Technical Analysis of TSLA Share Price Chart
In our 11 June publication, we:
→ identified an ascending channel;
→ highlighted the May support level (marked with an arrow), suggesting it could act as resistance following a bearish breakout.
Since then:
→ the channel has remained relevant;
→ the aforementioned level acted as resistance but was broken by the bulls yesterday.
As a result, the TSLA share price has reached the median of the current ascending channel, where it may find equilibrium and form a consolidation zone once the initial positive reaction to the robotaxi launch subsides.
It is also worth noting the stock’s resilience following Elon Musk’s controversy with President Trump — the price has already risen more than 28% from the June low, indicating the potential for a scenario in which resistance at $365 is tested.
This article represents the opinion of the Companies operating under the FXOpen brand only. It is not to be construed as an offer, solicitation, or recommendation with respect to products and services provided by the Companies operating under the FXOpen brand, nor is it to be considered financial advice.

TESLATesla is in the correction right now for bigger structure. It can go up to break the recent top with small correction or it can breakdown further before a push up.
Disclosure: We are part of Trade Nation's Influencer program and receive a monthly fee for using their TradingView charts in our analysis.

Tesla (TSLA) Shares Rebound After Sharp DropTesla (TSLA) Shares Rebound After Sharp Drop
When analysing the Tesla (TSLA) stock price chart six days ago, on the morning of 5 June, we:
→ highlighted Elon Musk’s critical comments regarding the spending bill promoted by the US President;
→ noted that a potential rift between Musk and Trump could have long-term implications, including for TSLA shares;
→ outlined an ascending channel (marked in blue);
→ suggested that the price might correct from the upper to the lower boundary of the channel.
This scenario played out rather aggressively: later that same day, during the main trading session, Tesla’s share price dropped sharply to the lower boundary of the channel amid a scandal involving Musk and Trump.
However, the lower boundary of the channel predictably acted as support. Yesterday, TSLA shares were among the top five performers in the S&P 500 index (US SPX 500 mini on FXOpen), gaining around 5.6%.
As a result, TSLA stock price climbed back above the psychologically important $300 mark, recovering from the previous week’s sell-off.
Why Are Tesla (TSLA) Shares Rising?
Bullish drivers include:
→ The upcoming launch of Tesla’s robotaxi service, provisionally scheduled for 22 June. Elon Musk has stated he intends to use the service himself.
→ Easing of tensions with the US President. Donald Trump declared that he has no intention of "getting rid of Tesla or Starlink" should he return to the White House.
→ Continued support from Cathie Wood, the prominent asset manager, who once again reaffirmed her confidence in Tesla’s future success.
Technical Analysis of TSLA Chart
Today, TSLA’s share price is hovering near the median line of the previously identified ascending channel – a zone where supply and demand typically seek equilibrium.
Also worth noting is the $320 level: in May, it acted as support, which suggests it may now function as resistance.
Given these factors, it is reasonable to expect that the sharp recovery from the 5 June low may begin to lose momentum, with the price likely to stabilise and form a consolidation range following the recent spike in volatility.
This article represents the opinion of the Companies operating under the FXOpen brand only. It is not to be construed as an offer, solicitation, or recommendation with respect to products and services provided by the Companies operating under the FXOpen brand, nor is it to be considered financial advice.

TSLA Rebounds from $290 | Buy the Dip or Political Trap?⚠️Just when it looked like Tesla was heading for a breakdown, we got a sharp bounce off the $290 level — and traders are watching closely. But here’s the twist: the move came after a headline-heavy week featuring none other than Trump vs. Elon.
🗞️ According to Politico, tensions flared after Trump made comments suggesting EVs were "doomed without government subsidies." Elon clapped back, defending Tesla’s profitability and independence. This added pressure on TSLA... and then came the bounce. Coincidence? Or whales buying fear?
📥 Entry Zones
• $290 – Strong demand zone, tested and respected
• $275 – Deeper retest if market pulls back
• $240 – Extreme fear level, unlikely unless macro worsens
🎯 Profit Targets
• $305 – Gap-fill magnet
• $320 – Resistance test
• $355+ – If Robotaxi or AI hype returns in force

TSLA cup and handle INVALIDATEDThe TSLA cup and handle breakout case has been invalidated as of Thursday June 5th of this past week. The start of the week showed lack of conviction in the follow through to and over the 360 price level, where sellers stepped up. This indicated a slowdown in bullish momentum and a weakening trend early in the week. The ultimate catalyst that caused the breakdown for TSLA was, of course, the public breakup of Musk and DJT over social media platforms. This caused a "waterfall effect" of intense selling pressure through low volume zones from ~330 to the high volume node and put wall at the 280 level. Price ended up overshooting 280 but ended up reclaiming that level by the end of the session and bounced higher the following day. At this point, the weekly and daily charts are showing a short term wedge formation that may take some weeks to play out. There has not been signs of big institutional buying at the these levels as of now, and as such I suspect that there may be a bit more downside these coming weeks. My current idea is a short/put position under 293.5 to about 273, with a maximum target of 250. If price ends up at or near 250 levels, I would look to start a long position for a play back up to the 300 level.

Tesla's Perfect Storm: A $152 Billion MeltdownTesla's Perfect Storm: A $152 Billion Meltdown, Chinese Rivals on the Attack, and a Faltering Shanghai Fortress
A tempest has engulfed Tesla, the electric vehicle behemoth, wiping a staggering $152 billion from its market capitalization in a single day. This monumental loss, the largest in the company's history, was triggered by a dramatic and public feud between CEO Elon Musk and former U.S. President Donald Trump. The confrontation, however, is but the most visible squall in a much larger storm. Lurking just beneath the surface are the relentless waves of competition from Chinese automakers, who are rapidly eroding Tesla's dominance, and the ominous sign of eight consecutive months of declining shipments from its once-impenetrable Shanghai Gigafactory.
The confluence of these events has plunged Tesla into a precarious position, raising fundamental questions about its future trajectory and its ability to navigate the turbulent waters of a rapidly evolving automotive landscape. The narrative of Tesla as an unstoppable force is being rewritten in real-time, replaced by a more complex and challenging reality.
The Trump-Musk Spat: A Bromance Turned Billion-Dollar Blow-Up
The relationship between Elon Musk and Donald Trump, once a seemingly symbiotic alliance of power and influence, has spectacularly imploded, leaving a trail of financial and political wreckage in its wake. The public falling out, which played out in a series of scathing social media posts and public statements, sent shockwaves through Wall Street and Washington, culminating in a historic sell-off of Tesla stock.
The genesis of the feud lies in Musk's vocal criticism of a sweeping tax and spending bill, a cornerstone of the Trump administration's second-term agenda. Musk, who had previously been a vocal supporter and even an advisor to the President, lambasted the legislation as a "disgusting abomination" filled with "pork." This public rebuke from a figure of Musk's stature was a direct challenge to Trump's authority and legislative priorities.
The President's response was swift and sharp. In an Oval Office meeting, Trump expressed his "disappointment" in Musk, questioning the future of their "great relationship." The war of words then escalated dramatically on their respective social media platforms. Trump, on his social media platform, threatened to terminate Tesla's lucrative government subsidies and contracts, a move that would have significant financial implications for Musk's business empire. He also claimed to have asked Musk to leave his advisory role, a statement Musk labeled as an "obvious lie."
Musk, in turn, did not hold back. On X (formerly Twitter), he claimed that without his substantial financial support in the 2024 election, Trump would have lost the presidency. This assertion of his political influence was a direct jab at the President's ego and a stark reminder of the financial power Musk wields. The spat took an even more personal and inflammatory turn when Musk alluded to Trump's name appearing in the unreleased records of the Jeffrey Epstein investigation.
The market's reaction to this public spectacle was brutal. Tesla's stock plummeted by over 14% in a single day, erasing more than $152 billion in market capitalization and pushing the company's valuation below the coveted $1 trillion mark. The sell-off was a clear indication of investor anxiety over the political instability and the potential for tangible financial repercussions from the feud. The incident underscored how intertwined Musk's personal and political activities have become with Tesla's financial performance, a vulnerability that has been a recurring theme for the company.
The Chinese Dragon Breathes Fire: Tesla's EV Dominance Under Siege
While the political drama in Washington captured headlines, a more fundamental and perhaps more enduring threat to Tesla's long-term prosperity is brewing in the East. The Chinese electric vehicle market, once a key engine of Tesla's growth, has become a fiercely competitive battleground where a host of domestic rivals are not just challenging Tesla, but in some aspects, surpassing it.
Companies like BYD, Nio, XPeng, and now even the tech giant Xiaomi, are relentlessly innovating and offering a diverse range of electric vehicles that are often more affordable and technologically advanced than Tesla's offerings. This intense competition has led to a significant erosion of Tesla's market share in China. From a dominant position just a few years ago, Tesla's share of the battery electric vehicle market has fallen significantly.
One of the key advantages for Chinese automakers is their control over the entire EV supply chain, particularly in battery production. This allows them to produce vehicles at a lower cost, a crucial factor in a price-sensitive market. The result is a growing disparity in pricing, with many Chinese EVs offering comparable or even superior features at a fraction of the cost of a Tesla.
Furthermore, Chinese consumers are increasingly viewing electric vehicles as "rolling smartphones," prioritizing advanced digital features, connectivity, and a sophisticated user experience. In this regard, many domestic brands are seen as more innovative and in tune with local preferences than Tesla. This shift in consumer sentiment has been a significant factor in the declining interest in the Tesla brand in China.
The numbers paint a stark picture of Tesla's predicament. While the overall new-energy vehicle market in China continues to grow at a remarkable pace, Tesla's sales have been on a downward trend. This is a worrying sign for a company that has invested heavily in its Chinese operations and has historically relied on the country for a substantial portion of its global sales.
The pressure on Tesla's sales in China is so intense that its sales staff are working grueling 13-hour shifts, seven days a week, in a desperate attempt to meet demanding sales targets. The high-pressure environment has reportedly led to high turnover rates among sales staff, a clear indication of the immense strain the company is under in this critical market.
The Shanghai Gigafactory: A Fortress with a Faltering Gate
The struggles in the Chinese market are reflected in the declining output from Tesla's Shanghai Gigafactory. For eight consecutive months, shipments from the factory, which serves both the domestic Chinese market and is a key export hub, have seen a year-on-year decline. In May 2025, the factory delivered 61,662 vehicles, a 15% drop compared to the same period the previous year.
This sustained decline in shipments is a significant red flag for several reasons. Firstly, the Shanghai factory is Tesla's largest and most efficient production facility, accounting for a substantial portion of its global output. A slowdown in production at this key facility has a direct impact on the company's overall delivery numbers and financial performance.
Secondly, the declining shipments are a direct consequence of the weakening demand for Tesla's vehicles in China. Despite being a production powerhouse, the factory's output is ultimately dictated by the number of cars it can sell. The falling shipment numbers are a clear indication that the company is struggling to maintain its sales momentum in the face of fierce competition.
The situation in China is a microcosm of the broader challenges facing Tesla. The company's product lineup, which has not seen a major new addition in the affordable segment for some time, is starting to look dated compared to the rapid product cycles of its Chinese competitors. The refreshed Model 3 and Model Y, while still popular, are no longer the novelties they once were, and are facing a growing number of compelling alternatives.
A Confluence of Crises: What Lies Ahead for Tesla?
The convergence of a high-profile political feud, intensifying competition, and production headwinds has created a perfect storm for Tesla. The company that once seemed invincible is now facing a multi-front battle for its future.
The spat with Trump, while seemingly a short-term crisis, has exposed the risks associated with a CEO whose public persona is so closely tied to the company's brand. The incident has also highlighted the potential for political winds to shift, and for government policies that have benefited Tesla in the past to be reversed.
The challenge from Chinese automakers is a more fundamental and long-term threat. The rise of these nimble and innovative competitors is not a fleeting trend, but a structural shift in the global automotive industry. Tesla can no longer rely on its brand cachet and technological lead to maintain its dominance. It must now compete on price, features, and innovation in a market that is becoming increasingly crowded and sophisticated.
The declining shipments from the Shanghai factory are a tangible manifestation of these challenges. The factory, once a symbol of Tesla's global manufacturing prowess, is now a barometer of its struggles in its most important market.
To navigate this storm, Tesla will need to demonstrate a level of agility and adaptability that it has not been required to show in the past. This will likely involve a renewed focus on product development, particularly in the affordable EV segment, to better compete with the value propositions offered by its Chinese rivals. It will also require a more nuanced and strategic approach to the Chinese market, one that acknowledges the unique preferences and demands of Chinese consumers.
The coming months will be a critical test for Tesla and its leadership. The company's ability to weather this storm and emerge stronger will depend on its capacity to innovate, to compete, and to navigate the complex and often unpredictable currents of the global automotive market. The era of unchallenged dominance is over. The battle for the future of electric mobility has truly begun.
Tesla (TSLA) Share Price Falls by 3.5%Tesla (TSLA) Share Price Falls by 3.5%
Yesterday, the share price of Tesla (TSLA) dropped by 3.5%, placing it among the five worst-performing stocks of the day in the S&P 500 index (US SPX 500 mini on FXOpen). Since the peak on 29 May, the decline now totals nearly 10%.
Why Tesla (TSLA) Shares Are Falling
Among the bearish factors are:
→ A drop in car sales in Europe. Sales in Germany fell by 36% year-on-year in May.
→ Growing competition from China. May deliveries from Tesla’s Chinese factory were down 15% year-on-year.
→ Elon Musk’s criticism of the US President’s proposed government spending bill.
Media reports also suggest that Musk took offence at staffing decisions at NASA, while Trump is reportedly losing patience with Musk over his attacks on the spending bill.
A potential rift between Musk and Trump could have far-reaching consequences — including for TSLA shares.
Technical Analysis of TSLA Stock Chart
Six days ago, we:
→ Drew an ascending channel (shown in blue), noting that the upper boundary could pose a challenge to further gains;
→ Highlighted the $355–$375 zone (shown in purple) as a possible resistance area;
→ Suggested a correction scenario following a roughly 27% surge in TSLA’s stock price during May.
Since then, the price has dropped towards the median line of the ascending channel. If this fails to offer sufficient support, the correction may continue towards the lower boundary of the channel, which is reinforced by support around the psychological $300 level and former resistance at $290.
News related to the planned rollout of Tesla’s robotaxi trials could significantly impact TSLA’s price movements in June.
This article represents the opinion of the Companies operating under the FXOpen brand only. It is not to be construed as an offer, solicitation, or recommendation with respect to products and services provided by the Companies operating under the FXOpen brand, nor is it to be considered financial advice.

TSLA weekly cup and handleNASDAQ:TSLA
Last week, the daily chart on TSLA showed a cup and handle formation. Price attempted to break up but rejected overhead supply in the 360s. Price action is starting to show the formation of a handle on the weekly chart that may present a stronger move in the coming weeks to break through the 360 resistance level and overhead supply. June tends to be a strong month for TSLA historically, so the move could happen by the end of the month. Strong break of 360 and a close over to confirm a projected movement to $400 as a first price target, with $420.69 as a secondary PT.

TSLA Weekly Options Outlook — June 1, 2025📉 TSLA Weekly Options Outlook — June 1, 2025
🚨 AI Consensus: Bearish Momentum Ahead of June 6 Expiry
🧠 Summary of AI Model Signals
🔹 Grok (xAI)
Technicals: Below EMAs, RSI deeply oversold (26.95), MACD bearish.
Sentiment: VIX steady, max pain at $340 implies downside.
Trade: Buy $340P @ $8.25 → Target $9.08 (+10%) / Stop $6.60 (−20%)
Confidence: 65%
🔹 Claude (Anthropic)
Technicals: Bearish EMAs/MACD, volume spike on red bars.
Sentiment: Negative sales buzz, falling VIX, max pain $340.
Trade: Buy $340P @ $8.20 → Target +50–100% / Stop $5.74
Confidence: 72%
🔹 Llama (Meta)
Technicals: Bearish M5 EMA stack; support at $345 zone.
Trade: Buy $342.5P @ $9.40 → Target +20% / Stop −50%
Confidence: 70%
🔹 Gemini (Google)
Technicals: Strong bearish momentum, RSI oversold.
Trade: Buy $305P @ $0.95 → Target $1.90 / Stop $0.47 (Day trade)
Confidence: 75%
🔹 DeepSeek
Technicals: Breakdown in progress, momentum fading.
Sentiment: Weak China/Europe news; max pain support at $340.
Trade: Buy $340P @ $8.25 → Target $12.38 (+50%) / Stop $5.78
Confidence: 70%
✅ Consensus Takeaways
🔻 Bearish technical setup on all timeframes
🔄 Max Pain at $340 = potential price magnet
📉 Strong directional momentum + oversold RSI across models
📆 Preferred strategy: Buy weekly naked puts, enter Monday open
🎯 Recommended Trade Setup
💡 Strategy: Bearish Single-Leg Weekly Put
📈 Ticker: TSLA
🔀 Direction: PUT (SHORT)
🎯 Strike: $340
💵 Entry Price: $8.25
🎯 Target: $9.08 (+10%)
🛑 Stop: $6.60 (−20%)
📏 Size: 1 Contract
📆 Expiry: 2025-06-06
⏰ Entry: At Market Open
📊 Confidence: 70%
⚠️ Key Risks to Watch
📉 RSI is oversold — potential for a short-term bounce
🕒 Time decay accelerates midweek — don’t hold too long
🚀 Unexpected bullish catalyst (e.g., SpaceX PR, macro rally)
💵 Liquidity fine (4.4k OI), but wide spreads in fast markets
📊 TRADE DETAILS (JSON)
json
Copy
Edit
{
"instrument": "TSLA",
"direction": "put",
"strike": 340.0,
"expiry": "2025-06-06",
"confidence": 0.70,
"profit_target": 9.08,
"stop_loss": 6.60,
"size": 1,
"entry_price": 8.25,
"entry_timing": "open",
"signal_publish_time": "2025-06-02 09:30:00 UTC-04:00"
}

Musk Steps Away from Politics: What Does It Mean for Tesla?Musk Steps Away from Politics: What Does It Mean for Tesla (TSLA) Stock?
Yesterday, it was announced that Elon Musk will be stepping down from the Trump administration as his term as head of DOGE—where he focused on reducing government spending—has come to an end.
This decision follows his statement at the economic forum in Qatar, where Musk said he plans to focus less on politics, as he feels he has already done enough in that realm.
What Does This Mean for Tesla (TSLA) Stock?
Musk’s move away from politics is likely a positive signal for investors. Here's why:
→ The company’s CEO can now devote more time to addressing issues such as declining vehicle sales in Europe;
→ Musk’s role at DOGE will no longer pose reputational risks for Tesla..
During yesterday’s main trading session, TSLA stock surged to $367—its highest level since mid-February.
Technical Analysis of TSLA Stock Chart
The price continues to hover near the upper boundary of an ascending channel (marked in blue), which could pose a challenge for further upward movement.
Additionally, the price has entered the $355–$375 range—a zone that previously triggered significant reversals (as indicated by arrows). Notably, there was a sharp decline from this zone between February 21–26. From a bearish standpoint, this area could act as resistance, and the candle’s close near its low yesterday supports this view.
From a bullish perspective, the fundamental outlook may still provide upward momentum:
→ A joint press conference with Trump and Musk is scheduled for today;
→ In early June, Tesla is expected to begin testing its autonomous taxis.
So, while a continued uptrend is possible, a short-term correction would seem reasonable after TSLA’s nearly 27% surge throughout May.
This article represents the opinion of the Companies operating under the FXOpen brand only. It is not to be construed as an offer, solicitation, or recommendation with respect to products and services provided by the Companies operating under the FXOpen brand, nor is it to be considered financial advice.

TSLA A.M. Dump IdeaHere is a bearish imuplse at close breaking structure to the downside creating a sell opportunity if price retraces back to the arrow. Simple Idea.

$Tsla will continue to go bullish after a short term pullbackNASDAQ:TSLA is in a bullish market overall speaking.
the price will probably continue to go up after this short term pullback!

Tesla (TSLA) Shares Rebound on Musk’s CommentsTesla (TSLA) Shares Rebound on Musk’s Comments
According to media reports, speaking via video link at the Qatar Economic Forum, Elon Musk stated that he plans to:
→ remain Tesla’s CEO for another five years;
→ reduce his focus on politics, saying he feels he has already done enough;
→ increase his stake in the company from 12.5% to 25%.
These comments, which came alongside news that Tesla will begin testing robotaxis in Texas in June, sparked renewed interest in Tesla (TSLA) shares. TSLA stock outperformed other MAG7 members, climbing above the $353 mark at yesterday’s peak — its highest level since late February 2025.
Just ten days ago, when the price was still below the psychological $300 level, we highlighted TSLA’s strength following its rebound from the $220 support area and suggested a bullish outlook. But is the picture still as optimistic today?
Technical Analysis of TSLA Chart
The chart shows that TSLA is trading within an ascending channel (highlighted in blue), with the price currently near the upper boundary — an area that often acts as resistance. Price action supports this: note the two large candlesticks with closes near their lows (indicated by arrows), suggesting strong bearish pressure.
This gives reason to believe that sellers may take advantage of the roughly 22% rise in the TSLA stock price to lock in profits — a potentially bearish signal. Traders should therefore consider a correction scenario in which the local support at point Q could be tested for resilience.
This article represents the opinion of the Companies operating under the FXOpen brand only. It is not to be construed as an offer, solicitation, or recommendation with respect to products and services provided by the Companies operating under the FXOpen brand, nor is it to be considered financial advice.
