Tslalong

Tsla 180 is near now
We can go to 180 in weekly chart shows a continuation
Was bloody bath and very bad week
Looking forward to see the crazy pull back
For me i prefer buy than selling in this range
Good luck

TSLA - Triple top formed 15 % drop (NEW)The price formed a triple top pattern.
How to trade:
- enter short only if /when the price breaks the neckline (support) with the volume increase.
- target and stop loss are shown in the chart
Last daily candle shows that sellers are still in control and more downside is likely.
Macro is bearish overall, nothing changed.
Good luck

Buy tsla Am not hyping you know me
Technically speaking tsla is over sold dialy , weekly , monthly .
Not only that its drop with zero green candle that means the reversal will be great from this area .
GOOD LUCK

TSLA BUY ++++ oversold!!!!!We continue to break supports, the upward trend appears to be broken as well. We have support at $206-209 range, most every indicator I have charted is at or near record oversold levels for this stock which is heavily shorted. We have cloud resistance at $266 and top of the downward trend is $341. Added 10 more calls for a total of 70 calls on TSLA

TSLA oversold and ready for Bounce This could be an infamous dead cat bounce but if history rhymes then we should see everyone start talking about TSLA towards earnings and media coverage means meme stock action that defies fundamentals.
Bears are in a lot of profit and market makers may be ready pull it up towards the longer term MAs real quick to screw both calls and puts expiring this week.
"Bespoke Investment Group took at look at prior periods when Tesla stock fell more than 20% over a seven-day stretch. It found 23 instances since 2010 and found that big declines are a set up for big gains.
Tesla stock typically rises about 37%, 84%, and 238% over the next month, three months, and six months, respectively, after a the rapid 20%-plus drop."

Bullish TSLA to 225SPY oversold and took TSLA along with it, now we we could see a bounce like the previous ones to 225+, main reason being put options expiring this Friday that people will close positions on as it reached the bottom of the Bollinger bands.

A Possible BUY on TSLA StockHi there,
I just took some analysis on Tesla and I saw all moves as it indicates a possible Bull on Tesla Stock. The Stock Being Bearish for a While now touches a point on the below trendline after Forming M Pattern on the Daily Timeframe. I'm expecting the Pair to experience some Bullish move now as it is now on a key level. I'll be checking Recent News Publications about Elon Musk Tesla and if all things being equal, I'll be buying some Shares on the Stock now on my KUDA. Invest Responsibly...
Sign Up for Kuda and Use My Referral Code: RoOdr19X

TSLA Firesale?TSLA is approaching $200 zone... worth monitoring for some life changing discounts on Elon's stock.

HOOD double top 22 % drop possibleHOOD price is forming a double top pattern.
How to trade:
- enter short only if / when the price breaks below the neckline
- Volume surge on the breakout point will be a confirmation for a real breakout
- stop loss and target shown in the chart
Fundamentals:
- Macro remains bearish overall.
- DXY still strong.
- More downside expected in the stock and crypto markets
Good luck

Is it clear for TSLA ! Buy now next week will blow up
Best area to buy we are in 0.5 Fib and bellow the Bolonger band over over sold NOT ONLY THAT the stochastic RSI shows a big buying opportunity
Iam not positive in medium term but short term we will have a big move minimum to 280 as shown in bolonger
GOOD LUCK

Tsla dont risk for selling nowGuys i wanted to share my thought because i see alot of TA that say tsla will fall to 120 $
I know nothing is impossible but not now maybe in 2023 yes it can happened
Now lets talk about buying profit and how fast you can make it
As my analysis daily is over sold , and weekly probably we go to 220-200 not more now , but in buying side first target is 273 and if we cross it we go 300
I mean the buyers will make more profit
Watch 2017-2018 and see how similar it looks
Good luck

Tesla range for scalping If tesla reaches 232 that fib livil for daily over over sold
It can reach 273 easily and if it hold it can reach 298 as weekly fib livil
I think this is reasonable since btc correlated with stocks as a high risk assets
Btc can go to 23k
Tsla will blow up
But then milt down harder than we think
Any way i am bearish in both ( short term)
GOOD LUCK

Tsla every up move SELLIam scalping tesla today and yesterday i bought it and ill collect my profit to short again 288 hopefully it can reach will be a good selling area to me
Why buy because it over sold in 4 hours chart and daily also
Why selling there is continuation of down trend in weekly
Here me up ( next week or two we will go in massive up trend when all time frame is over sold )
GOOD LUCK and dont wait below 200$ i think 200 will be the last area to buy
Tsla update after a big crash Tsla is over sold in daily and hourly
I expect a sort of pull up to 288 or 277
Will i know its in down trend but the first wave is finished and 50% of up wave correction is coming fast in 3-5 day it will finish
THIS IS MY SECOND UPDATE TODAY TO MAKE SURE I GIVE A PERFECT ENTRY FRIENDS
GOOD LUCK
TSLA EASY SCALPING IDEA (little risky) $$$TSLA is oversold on the RSI, and we may see a lot of buying pressure this week to close the gap we made today. Looking at previous RSI bounces, we bounced off levels 29-30 twice recently, so it is possible we bounce back when the RSI reaches around 29 - 30. Please keep in mind that my outlook on TSLA remains bearish, but it is more likely that we may see bullish price action in the short term

Iam buying tsla here Iam stil bearish but going to buy more after selling the 300 to 266
Iam bought the 266 and ill buy more today since its over sold just scalping 3-4 days maximum we may back test the 275 or close the gap
GOOD LUCK

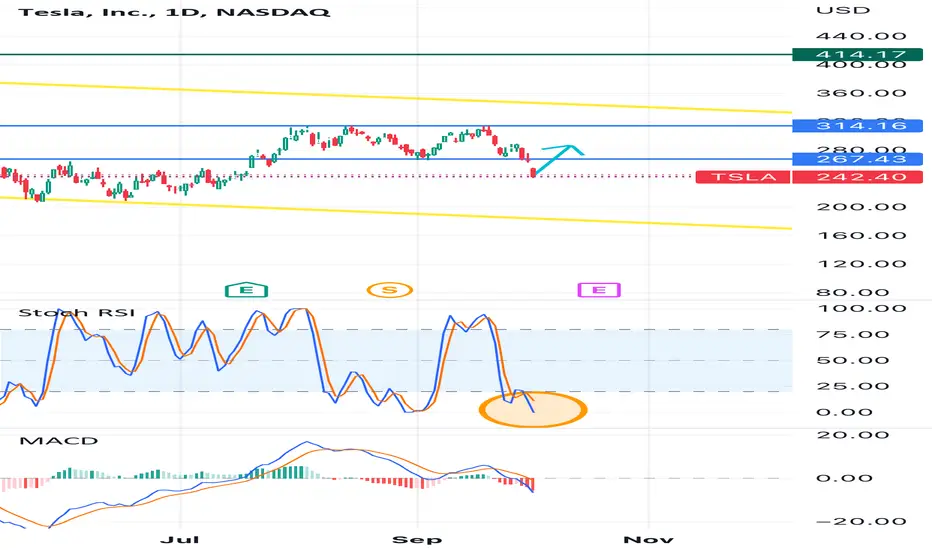
TSLA INCOMING BLOODBATH $$$As I said in my prior analysis, breaking this main support will be quite negative for TSLA, but this week we ended up finishing just below the key support that had been holding TSLA for so long, but now that we have broken it. Expect a bearish October in which we will test the next levels of support shown on the chart.

Tsla reach first target I will buy some tesla today for daily scalping
Tsla retrace to first target yes it doesnt touch 255$
But not bad selling from 310 $
Now ill buy tesla for 3-5 days max and then sell again for weeks or more
Tsla will go up again to 290$-310$
Good luck

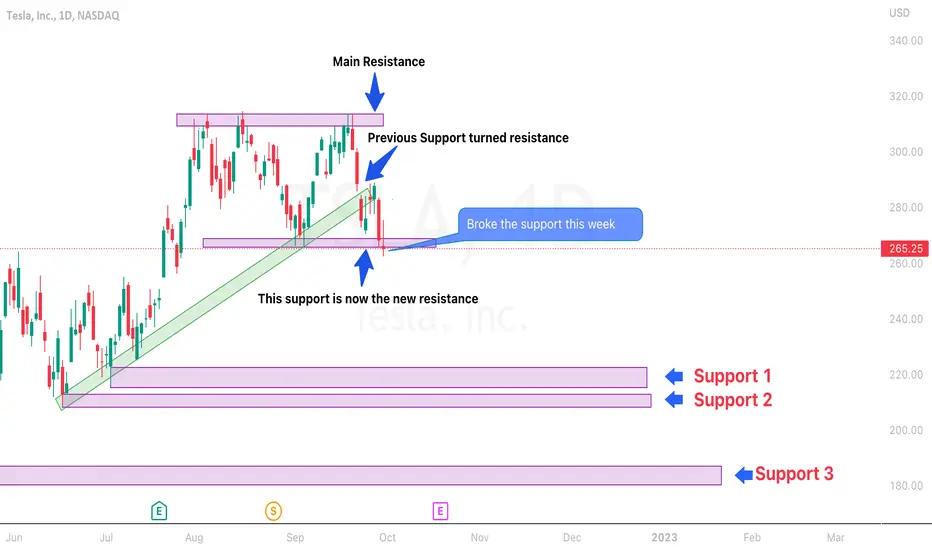
TSLA BULLISH AND BEARISH CASE SCENARIO $$$I've highlighted the critical support and resistance levels, where we see more volatility and volume. If we are able to break through that resistance, we will see bullish price action, and if we retest and see a pullback, we will see bearish price action. In both cases, you can use the support and resistance to your advantage.

TSLA SWING TRADEMy original setup has followed through so now we will take advantage of some small upside to come after the beatdown the past couple days... The 886 fib levels have been hit IEW the last local high to the swing low. Going to price action go green for a bit, so this may be a opportunity to get in on a bounce to some upside. No edge on oscillators, but it seems very practical to get market mercy. We are defiantly not bullish long term, as i expect to hit the 189-200 levels in the future. Thanks tradaaaas

Tesla Cup and HandleList of Important points:
1.Cup
The Cup is usually “U” shaped and may be considered as a rounding bottom with almost equal highs on either side. However, a “V” shaped cup also qualifies as a Cup and Handle pattern but the conviction is higher in “U” shaped due to the consolidation at the bottom.
2.Handle
The handle is usually the pullback from the higher end of the cup which may be rounding, triangle, or a descending channel. Usually, the pullback is about 1/3rd of the size of the prior advance.
Learn to trade with Technical analysis made easy course by Market Experts
The smaller the pullback, the better is the strength of the formation and the higher the possibility of a breakout.
3.Volume pattern
The breakout from the handle’s resistance should be accompanied by increased volume thus confirming the same.
4.Period
The cup usually forms over a period of 1-6 months or even longer those formed in weekly and monthly charts. The handle ideally forms over a span of 1-4 weeks or even higher depending upon the time period of the cup.
5.Target
The projected target from the breakout is usually the vertical distance from the high to the bottom of the cup.
6. Stop loss
Traders may place a stop loss at the lowest point of the handle and may trail it to a recent swing low as the stock makes a higher high within the consolidation area of the handle; depending upon the risk appetite of the trader.
