Tslalong

TSLA - Big Banks selling Tesla into Battery Day - Down Big FRIExpect TSLA to have a near carbon copy of what happened today before regaining some of it's strength just before we head into the weekend (assuming the NASDAQ is stable).
I'm worried this morning's premarket action was just a preview of things to come. Stocks bounced at the open before showing increasing weakness throughout the day repeatedly challenging some key levels.
To make matters worse, TSLA formed almost a perfect bearish pennant during today's trading session. The TICK action on the stock today was filled with big moves down and slow rebounds - typically indicating that the big players are starting to move against the stock while retail investors are left holding the bag.
Tesla is a strong stock, and one I like to be on the bull side of under most circumstances, but the weakness it showed today - especially in the afternoon - leads me to believe a lower open is all but certain Friday morning. This will likely get a small bump as PUT positions clear, leading to a short lived rally similar to what we saw today. I expect Tesla to open in the $400-414 range, moving quickly back to $420, and then ultimately grinding down until the final hour of trading. Going into the weekend, I think TSLA will rebound from a LOTD in the $383-389 range and recover to low $400s. That momentum will likely include a gap up into Monday's trading session and the lead up to battery day; however, the shareholder meeting is scheduled the same day as battery day. I expect we're going to get some very NEGATIVE news likely related to COVID, the factory shutdowns, and increasing competition. The cybertruck looks like it could be in serious trouble with Ford debuting its all electric F-150 in 2022 - within 6 months of the tsla cybertruck launch (and it has the benefit of not looking like a Total Recall inspired sardine can).
The Play: Short TSLA - if the NASDAQ is broadly down, short at open. If the NASDAQ is up or sideways premarket, wait for the bounce to $420, then short. Drop the shorts < $390 and don't hold the shorts over the weekend.

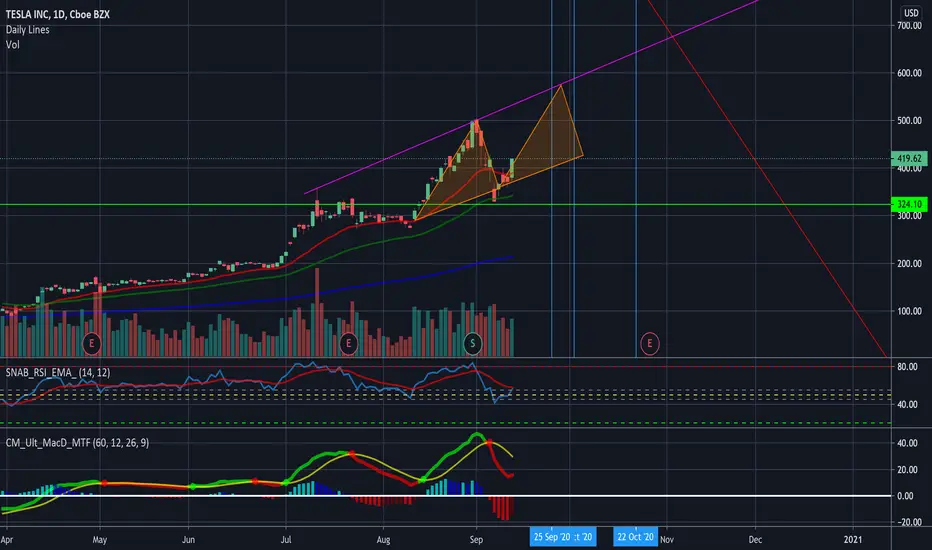
TESLA -BULLISHHello everyone ! tesla is bullish , in deep red market also showing strength . This time it can cross 500 and move for 700+ . symmetrical traingle completion . stoploss 350
thankyou and plz share your views


The imminent TSLA Implosion - Beware Monolithic Financial NewsOne of the biggest red flags when it comes to investing is a monolithic/singular message reverberated ad nauseum throughout the financial news media. Lately, everything about Tesla has been nothing but positive with almost no analysts commenting on the 800-lb gorilla in the room. Just months ago, Musk was threatening to move production out of California due to what he referred to as 'fascist' government orders to shelter in place - shutting down Tesla's largest production facilities for both its vehicles in the bay area and its battery production in Nevada. Those production stoppages from March to May are going to severely impact Tesla's Q3 financials and is likely a HUGE reason behind Tesla both being rejected by the S&P 500 AND Tesla raising $5B in cash from common stock sales - diluting its shares by more than 1%.
Now the hype is all around 'Battery Day', with Musk himself hyping it just yesterday on Twitter saying it's going to be exciting. Everyone already knows about the million mile battery, so while it's interesting tech, it's not something that isn't already priced into the stock and what's more, it's provided by a source outside Tesla through their chinese partner, Contemporary Amperex Technology Ltd. - so despite it being good news for EVs everywhere - VW can buy the same 'million mile battery' that's going into the future Teslas.
Just last year, TSLA was struggling to keep up with demand - so much so that Tesla had to walk back from earlier statements that it's gigafactory would be putting out 3,000 model Y's a week by 6 months. Now, the fallout from COVID-19 is coming home to roost. Tesla produced 110k cars in Q1, 82k cars in Q2. In 2019, Q2, Q3, & Q4 churned out 87k, 97k, and 105k respectively. With the massive amount of debt Tesla has taken on to build new gigaFactories in China and Germany - they can't afford to be shut down. This was confirmed by musk in a tweet after he told employees that every unit that produced was incredibly important. It was also confirmed by Musks actions to force workers to return to work or forfeit unemployment benefits defying the Shelter in Place order. More than 130 confirmed cases of COVID-19 would pop up at Tesla and another 20 at their suppliers. Adding to production troubles, many Tesla clients cited quality issues with new deliveries - a clear sign of an overstressed, undermanned workforce.
Expect TSLA to try to fill the gap left by last week's S&P snub of 15% in premarket trading this morning. I think it's almost inevitable that shortly thereafter, many of the big inst's will sell off their shares into retail traders waiting arms who are all excited about battery day. TSLA will see a big correction before Battery Day as news of the inevitably bad financial news and Q3 deliveries start to circulate.
Perhaps the most telling sign of coming fundamental troubles for TSLA is the company's decision to combine it's shareholder meeting with it's Battery Day pep rally. While everyone is OOO'ing and AWWW'ing the million mile battery, TSLA will also be discussing the substantial losses the company took from the COVID-19 pandemic and increasing competition in the marketplace.
The fact that TSLA is overvalued is no longer relevant to the argument - despite being completely true. Tesla's cash on hand is the real issue. The real value of TSLA was just revealed by the most recent common stock offering the company used to raise $5B if you were smart enough to see it.
The shares that TSLA sold diluted the market cap by roughly 1.2%, and the market handed TSLA a 35% stock price drop because of it. An over-reaction? Perhaps, but with a price to book ratio of 32.39, while the average auto & truck manufacturer price to book ratio is a paltry 1.9 - and that INCLUDES Tesla. Clearly, if we removed tsla from that average, we would be looking at something closer to 1 (note: anything less than 1 is considered good by value investor standards, and anything less than 3 is preferred). 32.39 to 1 and 35 to 1.2 are practically identical ratios. If a 1% dilution causes this type of sell off, there's no better indication that the stock is incredibly overpriced.
To avert a flash crash due to the abysmal numbers we're expecting during the shareholder meeting, Elon is going to be doing the song and dance for battery day on the 22nd. I'm a big fan of Tesla, and have made most of my trading income by buying long calls on TSLA. At least for the short term, TSLA is about to turn into a pumpkin. They'll no doubt rebound, but I don't think we'll ever see a 2500 stock price again - or anything near it. TSLA is the #1 market cap right now for 2 reasons: they were first in the EV market and their autopilot tech is super cool and a competitive advantage that other manufacturers will have a tough time emulating. However, both of those strengths have temporary ramifications - nobody thinks about whether ford or gm was first to market and it's just a matter of time before every other car manufacturer has some type of autopilot feature. But the infrastructure to build up production capacity to the levels of the Big 3 takes decades - and that's time that Tesla unfortunately just doesn't have.
Summary:
*BEWARE THE BULL TRAP set by an elevated premarket price.
*TSLA is estimated to be ~40k units behind production forecasts. This will decimate financials as one of their largest costs - labor - saw no downturn despite the pandemic.
*Battery Day was combined with the shareholder's meeting to distract from what will undoubtedly be horrific financials because of COVID-19
*There has been a severe divergence between volume and price - which indicates a high probability of trend reversal
*There's evidence of big institutions selling off their positions by block sizes, erratic price action, and low liquidity based on the bid/ask gaps.
*TSLA's stock has been on a tear, but reality will set in fairly soon. The shareholder meeting will reveal the cash position of the company - which is likely to be terrifying to many investors and reveal the company's reason for the recent $5B stock offering and S&P rejection. The company will likely only have a few months of reserves at best.
*Tesla will undoubtedly survive the coming big drop, but getting back to profitable on a consistent quarterly basis is going to take time. However, we likely saw the top of TSLA's stock price over the last few weeks. Expect some more big steps down in the week to come and around Q3 earnings as well.
*RSI shows the stock is severely overbought on the daily, and every time TSLA has run into this high a level on RSI, the following day was almost always negative or at best, flat.

TSLA LONG - BATTERY DAY RUN UPLet's see if this exact pattern plays out...
I bet there will be a run up to battery day and a little after followed by some profit-taking.
LONG TSLA.
Any bears can S.E.C ;) Oil and gas? BIG SHORT
PT: 500-525 in 2-3 weeks.
Long trade opportunityWe have bullish divergence on both rsi and macd on the D1 timeframe of Tesla.
2:1 riskreward trade, proper risk management always the key :)

TSLA - Bullish ScenarioTSLA bullish setup, marked some support & resistance with some trend lines, trade this at your own risk! Cheers


Tesla’s 2020 Annual Meeting of Stockholders September 22, 2020Tesla’s 2020 Annual Meeting of Stockholders will be held on Tuesday, September 22, 2020, at 1:30 PM Pacific Time. Immediately following the conclusion of the 2020 Annual Meeting, we will hold our separate Battery Day event. we are now approaching to witness another Elon Musk’s other exciting invention — Tesla’s upcoming Battery Day, which has now been scheduled for September 22. As the name suggests, “Battery Day” would revolve around Tesla’s latest work on significant advancements of battery technology. As a matter of fact, Tesla has been under a lot of pressure from its investors for various reasons, and thus with this event, it would be able to share something substantial and groundbreaking for its shareholders.
Mid last year, Tesla had acquired the battery technology of Maxwell for leveraging its dry electrode technology as well as to produce its own battery cells. This, in turn, has helped the company’s concept of building lithium-ion batteries. Tesla has been working on enhancing the battery technology for several years, and that has put the company way ahead of its rivals. After being postponed many a time, with this event, Tesla is expected to reveal advancements in its new battery technology as well as showcase its latest innovations with cell production.
The company has been strongly focusing on expanding their market with a cost-efficient electric vehicle (EV), which makes the concept of battery extremely significant. Therefore, energy density also needs to be more for the electric vehicle to offer such capability in a small package. These advancements in battery technology have been eagerly awaited in the community of EV that are willing to leverage this for developing electric vehicles.

TSLA Battery Day Annual Meeting of Stockholders 09/ 22/ 2020Elon Musk Expected to Unveil the Million Mile Battery on Tesla Battery Day 2020 Happening on September 22
Tesla’s 2020 Annual Meeting of Stockholders will be held on Tuesday, September 22, 2020, at 1:30 PM Pacific Time. Immediately following the conclusion of the 2020 Annual Meeting, we will hold our separate Battery Day event. we are now approaching to witness another Elon Musk’s other exciting invention — Tesla’s upcoming Battery Day, which has now been scheduled for September 22. As the name suggests, “Battery Day” would revolve around Tesla’s latest work on significant advancements of battery technology. As a matter of fact, Tesla has been under a lot of pressure from its investors for various reasons, and thus with this event, it would be able to share something substantial and groundbreaking for its shareholders.
Mid last year, Tesla had acquired the battery technology of Maxwell for leveraging its dry electrode technology as well as to produce its own battery cells. This, in turn, has helped the company’s concept of building lithium-ion batteries. Tesla has been working on enhancing the battery technology for several years, and that has put the company way ahead of its rivals. After being postponed many a time, with this event, Tesla is expected to reveal advancements in its new battery technology as well as showcase its latest innovations with cell production.
The company has been strongly focusing on expanding their market with a cost-efficient electric vehicle ( EV ), which makes the concept of battery extremely significant. Therefore, energy density also needs to be more for the electric vehicle to offer such capability in a small package. These advancements in battery technology have been eagerly awaited in the community of EV that are willing to leverage this for developing electric vehicles.
This shareholders meeting is very important due to Recent stock split that Tesla on Tuesday announced a five-for-one stock split effective August 31. At the close of trading on August 28, shareholders will receive five shares for every one they ownTesla , Inc. (“Tesla”) announced today that the Board of Directors has approved and declared a five-for-one split of Tesla’s common stock in the form of a stock dividend to make stock ownership more accessible to employees and investors. Each stockholder of record on August 21, 2020 will receive a dividend of four additional shares of common stock for each then-held share, to be distributed after close of trading on August 28, 2020. Trading will begin on a stock split-adjusted basis on August 31, 2020.
Forward-Looking Statements
Certain statements, including, without limitation, statements regarding the expected timing and impact of the stock dividend are “forward-looking statements” that are subject to risks and uncertainties. These forward-looking statements are based on management’s current expectations. Various important factors could cause actual results to differ materially, including the risks identified in our filings with the Securities and Exchange Commission, including our Quarterly Report on Form 10-Q for the quarter ended June 30, 2020. Tesla disclaims any obligation to update this information.
How will the Apple and Tesla stock splits affect open orders?
Open stock orders of 100 shares or greater
Open buy orders of 100 shares or greater will be adjusted on the morning of the ex-date, August 31, 2020. For example, A stock order of 100 shares of Tesla ( TSLA ) before the ex-date will be adjusted to 500 shares of TSLA on the morning of August 31.
In the case of limit orders to buy, stop orders to sell, and stop limit orders to sell, any order entered prior to market close on August 28, 2020 will be adjusted for ex-date after the market closes on August 28, 2020.
Limit orders to sell, stop orders to buy, and stop limit orders to buy will not be adjusted, but will now be significantly away from the market price.
The price will also be adjusted in conjunction with the split terms unless entered as a Do Not Increase order.
Open stock orders of 99 shares or fewer
Limit orders to buy, stop orders to sell, and stop limit orders to sell that are entered prior to market close on August 28, 2020 will be canceled for ex-date after the market closes on August 28, 2020.
Limit orders to sell, stop orders to buy, and stop limit orders to buy will not be canceled.
Please note: Stock orders entered after market close on August 28, 2020 will not be adjusted or canceled. Some stock orders may be rejected for aggressive pricing or invalid stop price on ex-date August 31, 2020, before the market opens.

TSLA Filling the Gap!With the $5B Common Stock share sale complete for $TSLA, the downward pressure on Tesla has been completely alleviated. Tesla is about to make back most of the losses it experienced over the last week for a number of reasons:
1) $5B stock sale took merely 4 days to complete
2) Battery Day Expo is 12 days from now ( 8 sessions) and rumor has it Tesla will unveil it's new 1.24M mile battery system - some super cool tech.
3) ARK investment group just bought some huge positions in Tesla yesterday
4) HUGE SHORT SQUEEZE COMING - there are more than 51k+ NAKED put options = 510,000 shares that will either be margin called at open or as the bulk of these naked options are called away as lowers in the $290-325 strike price execute (which currently have 25k exposed options)

TSLA bout to close that GAP to $400 after hoursLoad up on TSLA. There's no sure thing in the market, but this one is about as close as you can get.
Bounced off key support uptrend at $330.
TSLA had to sell $5B in common shares to increase percent of public float shares available. Why? They didn't need the capital. Simple - it's required to be included in the S&P 500. The S&P 500 requires that 50% of a company's shares be held by the public rather than private equity/owners/directors/etc.
TSLA completed that sale in less than 4 days, but it also greatly exaggerated the 20% drop we saw yesterday, and the 35% drop we've seen this week.
With the sale complete - expect $TSLA to continue it's climb faster than ever before.
Tesla's battery expo is expected to shake up the EV industry with some incredible tech. It's a given it'll have something to do with battery capacity, but just how much battery capacity may be the most important tech invention since the internet (yes, really). There's rumors Tesla plans to unveil the million mile battery. Beta's have already confirmed the battery good up to 1.24M miles.
2 people move the markets by their tweets. Trump and Elon. Even though the cybertruck launch was pretty much a disaster - the stock still went up like crazy the next few days. ANY expo with Elon talking about new tech is going to hit the afterburners for Tesla stock

$TSLA upside to $500+ (Wave 2) before $268Wave1 Target has been hit $375. Now has to go perform Wave2 upside to $500+.

TSLA IdeaI am looking for a burst up. We are now in a strong area of support on the 4-hour chart. We have had a strong retracement as well. Fundamentally with Musk visiting Germany these past couple of weeks with potential projects related to Tesla (TSLA) I'm still overall bullish on this stock unless the market tells me otherwise.

Tesla - can start moving Hello everyone ! tesla formed bullish pinbar on daily chart . and it also retested 200 ema on hourly chart , and looking very much bullish . target price -500+ , levels to watch 430 -410 .
Thankyou and plz like and share your views

TSLA Bottomed ? Looks like the post split sell off is ending. a great buy opportunity for everyone who missed the buy at 1400$( presplit)
Tesla stock is poised towards our next target of 500$ and possibly higher towards the 600s.

$TSLA Long term correction to $50 By 2023 and raises to $2000 $TSLA stock life cycle been reached it's tip now it has to correct which will disappoint Permabulls and in long term it's gonna correct to $50 by 2023 or earlier.
And it'll create a new life cycle from $50 due to it's powerful & futuristic tech and stepping into new industries, it's gonna raise to $2000 by 2030.

Tesla does not have time to reach its support trendlineDue to rising expecations for the upcoming Battery Day on 22nd of Sept, Tesla will not have time to fall further, it'll bounce back up mid next week. You can guess the price.

TSLA LONG SET UP AFTER (Five-For-One Stock Split) ROCKET TIMETITLE/(DATE)- Buy LIMIT TSLA
ASSET- TSLA
PLATFORM- MT4
ORDER TYPE- Buy limit
Time Frame- 1D
ENTRY PRICE 1- $420.00 (Pending)
ENTRY 2- $410.00 (pending)
STOP LOSS- $385.00 (600 PIPs)
TAKE PROFIT 1- $505.00 (600 PIPS)
TAKE PROFIT 2- $565.00 (1200 PIPS)
TAKE PROFIT 3- $625.00 (1800 PIPS)
TAKE PROFIT 4- $685.00 (2400 PIPS)
TAKE PROFIT 4- $745.00 (3000 PIPS)
STATUS🚨 PENDING🚨
Tesla on Tuesday announced a five-for-one stock split effective August 31. At the close of trading on August 28, shareholders will receive five shares for every one they own
Tesla , Inc. (“Tesla”) announced today that the Board of Directors has approved and declared a five-for-one split of Tesla’s common stock in the form of a stock dividend to make stock ownership more accessible to employees and investors. Each stockholder of record on August 21, 2020 will receive a dividend of four additional shares of common stock for each then-held share, to be distributed after close of trading on August 28, 2020. Trading will begin on a stock split-adjusted basis on August 31, 2020.
Forward-Looking Statements
Certain statements, including, without limitation, statements regarding the expected timing and impact of the stock dividend are “forward-looking statements” that are subject to risks and uncertainties. These forward-looking statements are based on management’s current expectations. Various important factors could cause actual results to differ materially, including the risks identified in our filings with the Securities and Exchange Commission, including our Quarterly Report on Form 10-Q for the quarter ended June 30, 2020. Tesla disclaims any obligation to update this information.
How will the Apple and Tesla stock splits affect open orders?
Open stock orders of 100 shares or greater
Open buy orders of 100 shares or greater will be adjusted on the morning of the ex-date, August 31, 2020. For example, A stock order of 100 shares of Tesla ( TSLA ) before the ex-date will be adjusted to 500 shares of TSLA on the morning of August 31.
In the case of limit orders to buy, stop orders to sell, and stop limit orders to sell, any order entered prior to market close on August 28, 2020 will be adjusted for ex-date after the market closes on August 28, 2020.
Limit orders to sell, stop orders to buy, and stop limit orders to buy will not be adjusted, but will now be significantly away from the market price.
The price will also be adjusted in conjunction with the split terms unless entered as a Do Not Increase order.
Open stock orders of 99 shares or fewer
Limit orders to buy, stop orders to sell, and stop limit orders to sell that are entered prior to market close on August 28, 2020 will be canceled for ex-date after the market closes on August 28, 2020.
Limit orders to sell, stop orders to buy, and stop limit orders to buy will not be canceled.
Please note: Stock orders entered after market close on August 28, 2020 will not be adjusted or canceled. Some stock orders may be rejected for aggressive pricing or invalid stop price on ex-date August 31, 2020, before the market opens.

More Blue Skies Ahead After Landing in $400 ZoneThis spike down from pre-split levels of $2500 to $2000 is a good opportunity on what should be a short-lived spike downards.
Trade Idea: Set limit buy orders from $420-300 at $5 increments from $420-$400 and $10 increments from $400-$300. Many in orders that range shouldn't trigger.


