TSLA Earnings Play (Bearish Bias)
🚨 TSLA Earnings Play (Bearish Bias) 🚨
Earnings Date: July 23, 2025 (AMC)
🧠 Confidence: 75% Bearish | 🎯 Target Move: -10%
⸻
🔍 Key Takeaways:
• 📉 TTM Revenue Growth: -9.2% → EV demand weakness
• 🧾 Margins Under Pressure: Gross 17.7%, Operating 2.5%, Net 6.4%
• ❌ EPS Beat Rate: Only 25% in last 8 quarters
• 🐻 Options Flow: High put volume at $330 strike
• 🧊 Low Volume Drift: Trading above 20/50MA but losing steam
• 📉 Sector Macro: EV competition + cyclical headwinds
⸻
🧨 Earnings Trade Setup:
{
"instrument": "TSLA",
"direction": "put",
"strike": 300,
"expiry": "2025-07-25",
"entry_price": 2.02,
"confidence": 75,
"profit_target": 6.06,
"stop_loss": 1.01,
"entry_timing": "pre_earnings_close",
"expected_move": 7.1,
"iv_rank": 0.75
}
⸻
🛠️ Trade Details:
Parameter Value
🎯 Strike Price $300 PUT
💰 Premium Paid $2.02
📅 Expiry Date 2025-07-25
🛑 Stop Loss $1.01
🚀 Profit Target $6.06
📏 Size 1 Contract
⏱ Entry Timing Pre-Earnings
📊 IV Rank 75%
🕒 Signal Time 7/23 @ 14:14 EDT
⸻
📈 Strategy Notes:
• 🧯 IV Crush Risk: Exit within 2 hours post-earnings
• 🎲 Risk/Reward: 1:3 setup | Max Loss: $202 | Max Gain: $606+
• 🧭 Volume Weakness & put/call skew signal downside
• 🧩 Macro + Tech + Flow Alignment = Tactical bearish play
⸻
🧠 “Not all dips are worth buying — this might be one to short.”
📢 Drop your thoughts — would you take the trade or fade it?
Tslashort

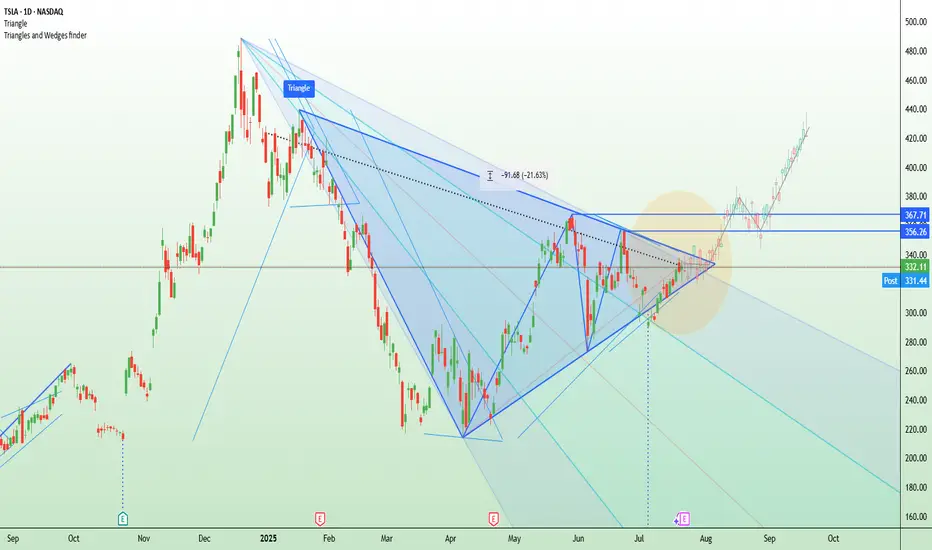
TSLA squeezes into resistance ahead of earnings Tesla is set to report Q2 earnings after the closing bell on Wednesday, covering the quarter ending June 2025.
The stock has been highly volatile this year, amid concerns about tariffs, Elon Musk’s politics (and nazi salutes), and his public clashes with President Donald Trump.
Tesla bulls Wedbush think, “We are at a 'positive crossroads' in the Tesla story,” suggesting that investors will look past the current numbers and focus on Tesla’s long-term AI potential.
Technically, Tesla is now testing a major descending trendline that’s capped every rally since December. The current price action resembles an ascending triangle pattern — a bullish structure — with resistance around $356 and a series of higher lows from May through July. This tightening formation suggests building pressure ahead of the earnings release.
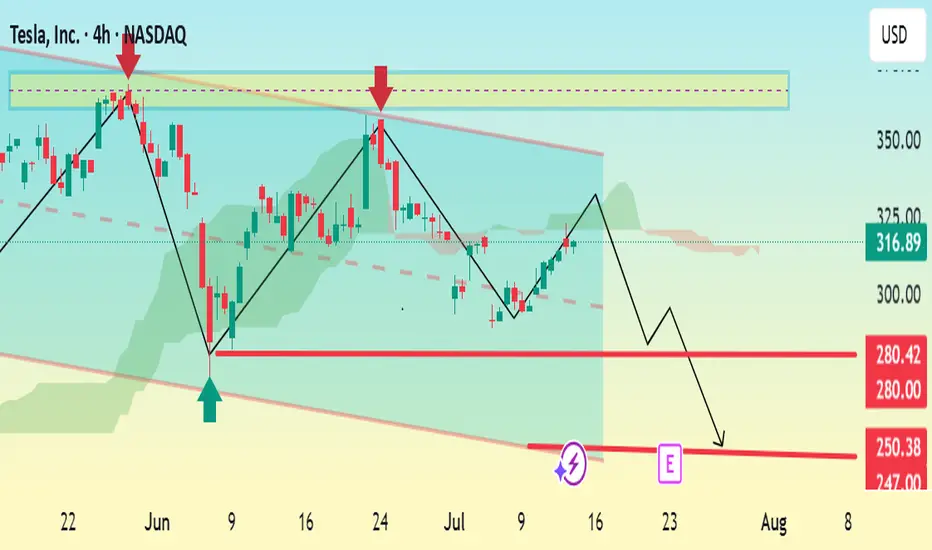
TSLA 4H Analysis – Bearish Reversal Setup📈 Trade Plan Summary
• Entry Range: 316 to 332
• Target 1: 280
• Target 2: 250
• Stop Loss: 370
⸻
📉 Type of Trade:
This appears to be a short (sell) position, since your targets are below the entry point.
⸻
✅ Risk Management Check
Let’s consider your worst-case entry (i.e., highest point in the range: 332) and best-case exit (Target 2 = 250):
• Risk = 370 - 332 = 38 points
• Reward = 332 - 250 = 82 points
📊 Risk:Reward Ratio ≈ 1:2.15 — Good setup!
Tesla, Below 200 Next - The Crash Can Reach 140, 150 & 160Tesla has been bearish since December 2024 and producing lower highs since. A strong lower high happened late May with a shooting start candlestick pattern. A month later another lower high and bullish rejection with an inverted hammer.
This looks like an ABC correction with the low in March/April being the A wave. The lower high in May the B wave and the next low the final C wave. This would complete the corrective pattern.
Conditions for bullish
An invalidation of the bearish bias and potential would happen with a rise and close, weekly, above 355. Any trading below this number and the bearish bias remains intact.
Indicators: RSI & MACD
» RSI:
The RSI looks pretty bad as it already curved down; trending down and moving lower since December 2024.
» MACD:
The weekly MACD is weak, starting to curve but still on the bullish zone. The daily MACD already turned bearish and moving lower.
Summary
Overall, market conditions are weak for this stock and everything points lower. The chart structure points to a lower low based on a broader bearish trend.
Thank you for reading.
Namaste.

Diamond Reversal Forming On Tesla ($TSLA)This pattern on TSLA fits the outline for a diamond reversal that is referenced on Investopedia.
It has all the "classical" facets of a diamond reversal which is a high (A), a low (C) a higher-high.
Furthermore, this is happening alongside a very similar pattern on NFLX and some bearish patterns on many other stocks.
Similar forms also occurred on SPX in 2021-2222 and Bitcoin in 2021.
The move up from the 2023 lows has the form of an ABC up... which suggests another 5 wave downmove on-par with or even exceeding the previous downmove is on the way.
The move off the highs was a whole 75% so even presuming a moderate 1:1 ratio, the next wave down could be very aggressive which means that an excellent short could be lining up.
Trade safe and be careful out there.

TSLA Honey Ticking Bull Trap!TSLA has a beautiful big ars bear flag! While it should have broken down to trigger a short trade, it decided to Honey Tick people right into a Trap!
It formed a perfect MEGAPHONE in wave 3 up that has now CRACKED! This is a much juicer short setup with the potential of collapsing from here and taking out the entire bear flag and MORE!!
First, we need a lower low and then a lower high and off we GO BABY!!!
Don't Get HONEY TICKED!
As I always say, never EVER!! Invest in toxic people like Elona. They always blow themselves up in the end. It's in their nature!
Click boost and follow, let's get to 5,000 followers. ;)

Tesla's Perfect Storm: A $152 Billion MeltdownTesla's Perfect Storm: A $152 Billion Meltdown, Chinese Rivals on the Attack, and a Faltering Shanghai Fortress
A tempest has engulfed Tesla, the electric vehicle behemoth, wiping a staggering $152 billion from its market capitalization in a single day. This monumental loss, the largest in the company's history, was triggered by a dramatic and public feud between CEO Elon Musk and former U.S. President Donald Trump. The confrontation, however, is but the most visible squall in a much larger storm. Lurking just beneath the surface are the relentless waves of competition from Chinese automakers, who are rapidly eroding Tesla's dominance, and the ominous sign of eight consecutive months of declining shipments from its once-impenetrable Shanghai Gigafactory.
The confluence of these events has plunged Tesla into a precarious position, raising fundamental questions about its future trajectory and its ability to navigate the turbulent waters of a rapidly evolving automotive landscape. The narrative of Tesla as an unstoppable force is being rewritten in real-time, replaced by a more complex and challenging reality.
The Trump-Musk Spat: A Bromance Turned Billion-Dollar Blow-Up
The relationship between Elon Musk and Donald Trump, once a seemingly symbiotic alliance of power and influence, has spectacularly imploded, leaving a trail of financial and political wreckage in its wake. The public falling out, which played out in a series of scathing social media posts and public statements, sent shockwaves through Wall Street and Washington, culminating in a historic sell-off of Tesla stock.
The genesis of the feud lies in Musk's vocal criticism of a sweeping tax and spending bill, a cornerstone of the Trump administration's second-term agenda. Musk, who had previously been a vocal supporter and even an advisor to the President, lambasted the legislation as a "disgusting abomination" filled with "pork." This public rebuke from a figure of Musk's stature was a direct challenge to Trump's authority and legislative priorities.
The President's response was swift and sharp. In an Oval Office meeting, Trump expressed his "disappointment" in Musk, questioning the future of their "great relationship." The war of words then escalated dramatically on their respective social media platforms. Trump, on his social media platform, threatened to terminate Tesla's lucrative government subsidies and contracts, a move that would have significant financial implications for Musk's business empire. He also claimed to have asked Musk to leave his advisory role, a statement Musk labeled as an "obvious lie."
Musk, in turn, did not hold back. On X (formerly Twitter), he claimed that without his substantial financial support in the 2024 election, Trump would have lost the presidency. This assertion of his political influence was a direct jab at the President's ego and a stark reminder of the financial power Musk wields. The spat took an even more personal and inflammatory turn when Musk alluded to Trump's name appearing in the unreleased records of the Jeffrey Epstein investigation.
The market's reaction to this public spectacle was brutal. Tesla's stock plummeted by over 14% in a single day, erasing more than $152 billion in market capitalization and pushing the company's valuation below the coveted $1 trillion mark. The sell-off was a clear indication of investor anxiety over the political instability and the potential for tangible financial repercussions from the feud. The incident underscored how intertwined Musk's personal and political activities have become with Tesla's financial performance, a vulnerability that has been a recurring theme for the company.
The Chinese Dragon Breathes Fire: Tesla's EV Dominance Under Siege
While the political drama in Washington captured headlines, a more fundamental and perhaps more enduring threat to Tesla's long-term prosperity is brewing in the East. The Chinese electric vehicle market, once a key engine of Tesla's growth, has become a fiercely competitive battleground where a host of domestic rivals are not just challenging Tesla, but in some aspects, surpassing it.
Companies like BYD, Nio, XPeng, and now even the tech giant Xiaomi, are relentlessly innovating and offering a diverse range of electric vehicles that are often more affordable and technologically advanced than Tesla's offerings. This intense competition has led to a significant erosion of Tesla's market share in China. From a dominant position just a few years ago, Tesla's share of the battery electric vehicle market has fallen significantly.
One of the key advantages for Chinese automakers is their control over the entire EV supply chain, particularly in battery production. This allows them to produce vehicles at a lower cost, a crucial factor in a price-sensitive market. The result is a growing disparity in pricing, with many Chinese EVs offering comparable or even superior features at a fraction of the cost of a Tesla.
Furthermore, Chinese consumers are increasingly viewing electric vehicles as "rolling smartphones," prioritizing advanced digital features, connectivity, and a sophisticated user experience. In this regard, many domestic brands are seen as more innovative and in tune with local preferences than Tesla. This shift in consumer sentiment has been a significant factor in the declining interest in the Tesla brand in China.
The numbers paint a stark picture of Tesla's predicament. While the overall new-energy vehicle market in China continues to grow at a remarkable pace, Tesla's sales have been on a downward trend. This is a worrying sign for a company that has invested heavily in its Chinese operations and has historically relied on the country for a substantial portion of its global sales.
The pressure on Tesla's sales in China is so intense that its sales staff are working grueling 13-hour shifts, seven days a week, in a desperate attempt to meet demanding sales targets. The high-pressure environment has reportedly led to high turnover rates among sales staff, a clear indication of the immense strain the company is under in this critical market.
The Shanghai Gigafactory: A Fortress with a Faltering Gate
The struggles in the Chinese market are reflected in the declining output from Tesla's Shanghai Gigafactory. For eight consecutive months, shipments from the factory, which serves both the domestic Chinese market and is a key export hub, have seen a year-on-year decline. In May 2025, the factory delivered 61,662 vehicles, a 15% drop compared to the same period the previous year.
This sustained decline in shipments is a significant red flag for several reasons. Firstly, the Shanghai factory is Tesla's largest and most efficient production facility, accounting for a substantial portion of its global output. A slowdown in production at this key facility has a direct impact on the company's overall delivery numbers and financial performance.
Secondly, the declining shipments are a direct consequence of the weakening demand for Tesla's vehicles in China. Despite being a production powerhouse, the factory's output is ultimately dictated by the number of cars it can sell. The falling shipment numbers are a clear indication that the company is struggling to maintain its sales momentum in the face of fierce competition.
The situation in China is a microcosm of the broader challenges facing Tesla. The company's product lineup, which has not seen a major new addition in the affordable segment for some time, is starting to look dated compared to the rapid product cycles of its Chinese competitors. The refreshed Model 3 and Model Y, while still popular, are no longer the novelties they once were, and are facing a growing number of compelling alternatives.
A Confluence of Crises: What Lies Ahead for Tesla?
The convergence of a high-profile political feud, intensifying competition, and production headwinds has created a perfect storm for Tesla. The company that once seemed invincible is now facing a multi-front battle for its future.
The spat with Trump, while seemingly a short-term crisis, has exposed the risks associated with a CEO whose public persona is so closely tied to the company's brand. The incident has also highlighted the potential for political winds to shift, and for government policies that have benefited Tesla in the past to be reversed.
The challenge from Chinese automakers is a more fundamental and long-term threat. The rise of these nimble and innovative competitors is not a fleeting trend, but a structural shift in the global automotive industry. Tesla can no longer rely on its brand cachet and technological lead to maintain its dominance. It must now compete on price, features, and innovation in a market that is becoming increasingly crowded and sophisticated.
The declining shipments from the Shanghai factory are a tangible manifestation of these challenges. The factory, once a symbol of Tesla's global manufacturing prowess, is now a barometer of its struggles in its most important market.
To navigate this storm, Tesla will need to demonstrate a level of agility and adaptability that it has not been required to show in the past. This will likely involve a renewed focus on product development, particularly in the affordable EV segment, to better compete with the value propositions offered by its Chinese rivals. It will also require a more nuanced and strategic approach to the Chinese market, one that acknowledges the unique preferences and demands of Chinese consumers.
The coming months will be a critical test for Tesla and its leadership. The company's ability to weather this storm and emerge stronger will depend on its capacity to innovate, to compete, and to navigate the complex and often unpredictable currents of the global automotive market. The era of unchallenged dominance is over. The battle for the future of electric mobility has truly begun.
TSLA Backtest: A robo-taxi launchpad? TBD ... 𝗧𝗲𝘀𝗹𝗮 𝗕𝗮𝗰𝗸𝘁𝗲𝘀𝘁: A robo-taxi launchpad? 🤖🚗
After a 20%+ breakout, NASDAQ:TSLA is retesting its 200dma with $295–300 now key support. Hold that — and bulls have room to run to $400+.
𝘉𝘶𝘭𝘭𝘪𝘴𝘩 𝘴𝘦𝘵𝘶𝘱 𝘸𝘪𝘵𝘩 𝘢 𝘥𝘢𝘵𝘦: June 12 robo-taxi reveal in Austin could mark Tesla’s first real step toward autonomous ride-hailing at scale.
𝘏𝘪𝘨𝘩 𝘱𝘳𝘪𝘤𝘦, 𝘩𝘪𝘨𝘩 𝘩𝘰𝘱𝘦𝘴: Tesla's valuation has always priced in the future. This time, the future might show up in a self-driving Model Y.
$NQ_F NASDAQ:NDX NASDAQ:QQQ NASDAQ:NVDA NASDAQ:AAPL AMEX:SPY NASDAQ:SOX CBOE:ARKK #Tesla #Robotaxi #FSD #ElonMusk #Stocks

TSLA Weekly Options Outlook — June 1, 2025📉 TSLA Weekly Options Outlook — June 1, 2025
🚨 AI Consensus: Bearish Momentum Ahead of June 6 Expiry
🧠 Summary of AI Model Signals
🔹 Grok (xAI)
Technicals: Below EMAs, RSI deeply oversold (26.95), MACD bearish.
Sentiment: VIX steady, max pain at $340 implies downside.
Trade: Buy $340P @ $8.25 → Target $9.08 (+10%) / Stop $6.60 (−20%)
Confidence: 65%
🔹 Claude (Anthropic)
Technicals: Bearish EMAs/MACD, volume spike on red bars.
Sentiment: Negative sales buzz, falling VIX, max pain $340.
Trade: Buy $340P @ $8.20 → Target +50–100% / Stop $5.74
Confidence: 72%
🔹 Llama (Meta)
Technicals: Bearish M5 EMA stack; support at $345 zone.
Trade: Buy $342.5P @ $9.40 → Target +20% / Stop −50%
Confidence: 70%
🔹 Gemini (Google)
Technicals: Strong bearish momentum, RSI oversold.
Trade: Buy $305P @ $0.95 → Target $1.90 / Stop $0.47 (Day trade)
Confidence: 75%
🔹 DeepSeek
Technicals: Breakdown in progress, momentum fading.
Sentiment: Weak China/Europe news; max pain support at $340.
Trade: Buy $340P @ $8.25 → Target $12.38 (+50%) / Stop $5.78
Confidence: 70%
✅ Consensus Takeaways
🔻 Bearish technical setup on all timeframes
🔄 Max Pain at $340 = potential price magnet
📉 Strong directional momentum + oversold RSI across models
📆 Preferred strategy: Buy weekly naked puts, enter Monday open
🎯 Recommended Trade Setup
💡 Strategy: Bearish Single-Leg Weekly Put
📈 Ticker: TSLA
🔀 Direction: PUT (SHORT)
🎯 Strike: $340
💵 Entry Price: $8.25
🎯 Target: $9.08 (+10%)
🛑 Stop: $6.60 (−20%)
📏 Size: 1 Contract
📆 Expiry: 2025-06-06
⏰ Entry: At Market Open
📊 Confidence: 70%
⚠️ Key Risks to Watch
📉 RSI is oversold — potential for a short-term bounce
🕒 Time decay accelerates midweek — don’t hold too long
🚀 Unexpected bullish catalyst (e.g., SpaceX PR, macro rally)
💵 Liquidity fine (4.4k OI), but wide spreads in fast markets
📊 TRADE DETAILS (JSON)
json
Copy
Edit
{
"instrument": "TSLA",
"direction": "put",
"strike": 340.0,
"expiry": "2025-06-06",
"confidence": 0.70,
"profit_target": 9.08,
"stop_loss": 6.60,
"size": 1,
"entry_price": 8.25,
"entry_timing": "open",
"signal_publish_time": "2025-06-02 09:30:00 UTC-04:00"
}

TSLA A.M. Dump IdeaHere is a bearish imuplse at close breaking structure to the downside creating a sell opportunity if price retraces back to the arrow. Simple Idea.

$TSLA back to $148-155 before correction is overDespite the bounce over the last few days, TSLA's price action is still bearish overall.
I think it's likely that we find resistance here or at $290, and then work our way back down to the lower support levels at $148-155.
I think once we get down to those levels, it'll be a good long term buy and we can see price go back to $700+.

𝗧𝗲𝘀𝗹𝗮 𝗕𝗿𝗲𝗮𝗱𝗸𝗼𝘄𝗻: Priced for perfectionPriced for perfection in an imperfect market
NASDAQ:TSLA nearly hit its 200dma and key resistance area (~288–292) after a roughly 20% post-earnings squeeze, and as long as it stays below that level, it risks retesting the long-term uptrend line that has marked major lows twice since COVID.
𝘛𝘢𝘳𝘪𝘧𝘧 𝘢𝘯𝘥 𝘴𝘶𝘱𝘱𝘭𝘺-𝘤𝘩𝘢𝘪𝘯 𝘳𝘪𝘴𝘬: Tesla depends heavily on Chinese-made battery and electronic components now hit by reciprocal U.S. tariffs, while over 60% of global neodymium and dysprosium—vital for its EV motors—are mined and processed only in China, creating a critical bottleneck that could sharply elevate its input costs.
𝘔𝘢𝘳𝘨𝘪𝘯 𝘱𝘳𝘦𝘴𝘴𝘶𝘳𝘦 𝘷𝘴. 𝘭𝘰𝘧𝘵𝘺 𝘷𝘢𝘭𝘶𝘢𝘵𝘪𝘰𝘯: Q1 price cuts of up to 20% on core models drove Tesla’s auto gross margin to its lowest since 2020, calling into question the sustainability of its >70× forward P/E multiple, which assumes exceptionally high profits from future ventures like robotics and autonomous fleets.
$NQ_F NASDAQ:NDX NASDAQ:QQQ NASDAQ:AMZN NASDAQ:META NASDAQ:NVDA NASDAQ:SOX $ES_F AMEX:SPY SP:SPX TVC:DXY NASDAQ:TLT TVC:TNX TVC:VIX #Stocks #TrumpTariffs 🇺🇸 #ChinaTariffs 🇨🇳

TSLA, the king of all meme stocksYesterday, Q1 earnings call. Stock misses earnings by 30% on already reduced expectations of 0.38. Had it been earnings expectations from a week before (which was 0.434), it would've missed by around 45%.
Still, the stock manages to rebound from mid 220s up to 257 in a single day (around 10%). It's impressive, but still looms a ceiling just up ahead (258-260) which I think is the perfect opportunity to short. Will be invalid if it manages to push up above 267.6 which is the local resistance line and a major historic resistance also.
That said. I think the odds are good in shorting around 258-260. Expecting a fall towards low 200s and even towards high 170s.

Breaking: Tesla Up 6% In Premarket Albeit Q1 Profit Drops 71%Shares of Tesla (NASDAQ: NASDAQ:TSLA ) stock surged 6% in early premarket trading on Wednesday amidst missing expectation, Q1 profit drops 71%.
Tesla investors breathed a sigh of relief after CEO Elon Musk said he would refocus his attention on the electric automaker, but that promise did not entirely dispel worries that his right-wing shift had irrevocably damaged the company's image.
The automaker's shares (NASDAQ: NASDAQ:TSLA ), rose about 6.5% in premarket trading on Wednesday after Musk said he would cut back, opens new tab his work for U.S. President Donald Trump to a day or two per week from sometime next month after the automaker posted a 71% slump in net income and a sharp drop in automotive revenue.
Since hitting a record high in December, Shares of Tesla (NASDAQ: NASDAQ:TSLA ) have lost about half its value reducing its market capitalization by more than $500 billion, largely on concerns that brand damage could hurt sales for a second straight year.
Tesla said it will a review of its full-year delivery forecast amid shifting global trade policies in the second quarter earnings update, which is expected in July.
While Tesla is less likely to be affected by global tariffs than legacy automakers, it still expects an outsized impact on the fast-growing energy storage business that uses battery cells from China.
Technical Outlook
As of the time of writing, NASDAQ:TSLA shares are up 6.5% in premarket trading. The asset is undergoing a bullish reversal pattern after bouncing off from the critical support point of $218.
TSLA shares are aiming for a 118% surge should the asset break the key Fibonacci levels highlighted on the chart. With the last trading session's RSI at 46, NASDAQ:TSLA is well primed for a bullish campaign since consolidating late December, 2024 losing almost 56% of value, TSLA shares are looking to capitalize on that.

TSLA Weekly Options Trade Plan 2025-04-17TSLA Weekly Analysis Summary (2025-04-17)
Below is an integrated analysis of the reports and market data:
──────────────────────────────
MODEL REPORTS – KEY POINTS
• Grok/xAI – Price and moving averages on both 5‑min and daily charts are below key EMAs; RSI and MACD point to current bearish momentum. – Notable technical support at about 239.75 with resistance above near 242. – The options chain shows heavy put activity at the $240 strike (premium about 0.67), and max pain is at 245, although that level is less relevant for a near‐term (0DTE) trade. – Recommendation: Trade the TSLA $240 PUT at an ask of 0.67 at the open, aiming for roughly a 100% gain and using about a 50% loss as a stop.
• Gemini/Google – Technicals on short‐term and daily timeframes are mixed: the daily chart is clearly bearish while some 5‑min indicators hint at stabilization. – Conflicting signals (including the max pain pull toward 245 and falling VIX) result in not having a high‑conviction directional bias. – Conclusion: “No trade” is recommended today because the conflicting indicators raise the risk of getting whipsawed.
• Claude/Anthropic – Technical analysis on both 5‑min and daily confirms a moderately bearish bias (price well below major EMAs, RSI below 50). – However, one suggested trade was a TSLA $237.50 PUT at an extremely low premium (0.13) which seems less attractive given the preferred premium range. – In essence, the model sees downside potential but selected a strike a bit further out from the current price.
• Llama/Meta – A moderately bearish setup is noted, with the technical picture similar to the others on very short‐term charts. – However, the model also flags the influence of max pain at 245 and concludes that a naked call (for example, at the $240 or $242.50 strike) could profit if the upward “max pain pull” works in play. – Ultimately, this view contrasts with the put trades favored by others.
• DeepSeek – Confirms the overall technical picture: price is below key averages, with bearish momentum evident on both 5‑min and daily charts. – Emphasizes the high open interest on $240 puts and the near-term support at 239.75. – Recommends buying the TSLA $240 PUT at its 0.67 ask price for this weekly (0DTE) option. ────────────────────────────── 2. AREAS OF AGREEMENT AND DISAGREEMENT
Agreements: – Most reports note that TSLA is trading in a moderately bearish state with price below the relevant moving averages and key support levels near 239.75. – There is broad recognition that options activity is concentrated around the $240 strike—especially on the put side, where volume and open interest are very high, underscoring bearish positioning. – Technical indicators (RSI, MACD, Bollinger Bands) on short‑term and daily charts lean toward bearishness despite some very short‑term signals of stabilization.
Disagreements: – Gemini/Google sees too many conflicting signals (including the upward pull implied by max pain) and hence recommends no trade, while the majority of the other analysts view the setup as tradeable. – Llama/Meta is open to trading a naked call (capitalizing on the max pain influence) whereas Grok/xAI, DeepSeek, and to a lesser degree Claude/Anthropic advocate for a bearish put trade instead. ────────────────────────────── 3. CONCLUSION & TRADE RECOMMENDATION
Overall Market Direction Consensus: Most opinions point to a moderately bearish bias for TSLA on a near-term, 0DTE weekly horizon. Even though conflicting signals (like max pain toward 245 and some stabilization on very short timeframes) introduce uncertainty, the weight of the technicals and put side open interest lean toward downside pressure.
Recommended Trade: Trade a single‑leg, naked PUT (weekly option) on TSLA.
Trade Parameters: – Instrument: TSLA – Strategy: Buy a TSLA $240 PUT – Expiration: 2025‑04‑17 (weekly, 0DTE) – Premium: Approximately $0.67 per contract (slightly above the preferred range, but justified by high liquidity and clear technical support) – Entry Timing: At the open – Profit Target: Around 100% gain from the entry premium (i.e. exit near a $1.34 premium) – Stop‑Loss: Roughly a 50% loss at about $0.33 per contract – Confidence Level: Approximately 65% – Key Risks & Considerations: • The mixed signals (especially Gemini’s caution and the max pain theory) mean price could quickly reverse if TSLA rebounds near 245. • Very short‑term trading (0DTE) carries risks related to rapid time decay and volatility spikes. • A failure to break important support (around 239.75) would warrant an early exit. ────────────────────────────── 4. TRADE_DETAILS (JSON Format)
{ "instrument": "TSLA", "direction": "put", "strike": 240.0, "expiry": "2025-04-17", "confidence": 0.65, "profit_target": 1.34, "stop_loss": 0.33, "size": 1, "entry_price": 0.67, "entry_timing": "open" }
Disclaimer: This newsletter is not trading or investment advice but for general informational purposes only. This newsletter represents my personal opinions based on proprietary research which I am sharing publicly as my personal blog. Futures, stocks, and options trading of any kind involves a lot of risk. No guarantee of any profit whatsoever is made. In fact, you may lose everything you have. So be very careful. I guarantee no profit whatsoever, You assume the entire cost and risk of any trading or investing activities you choose to undertake. You are solely responsible for making your own investment decisions. Owners/authors of this newsletter, its representatives, its principals, its moderators, and its members, are NOT registered as securities broker-dealers or investment advisors either with the U.S. Securities and Exchange Commission, CFTC, or with any other securities/regulatory authority. Consult with a registered investment advisor, broker-dealer, and/or financial advisor. By reading and using this newsletter or any of my publications, you are agreeing to these terms. Any screenshots used here are courtesy of TradingView. I am just an end user with no affiliations with them. Information and quotes shared in this blog can be 100% wrong. Markets are risky and can go to 0 at any time. Furthermore, you will not share or copy any content in this blog as it is the authors' IP. By reading this blog, you accept these terms of conditions and acknowledge I am sharing this blog as my personal trading journal, nothing more.

TESLA | Monthly Analysis After NASDAQ:TSLA hitting its ATH target, 87% - 90% retracement is next target
start of 2027 = will be a buying signal for tesla unless there's some issues involving with Elon Musk, then tesla could experience under performance
Long term investors - prepare for down side inside buying channel

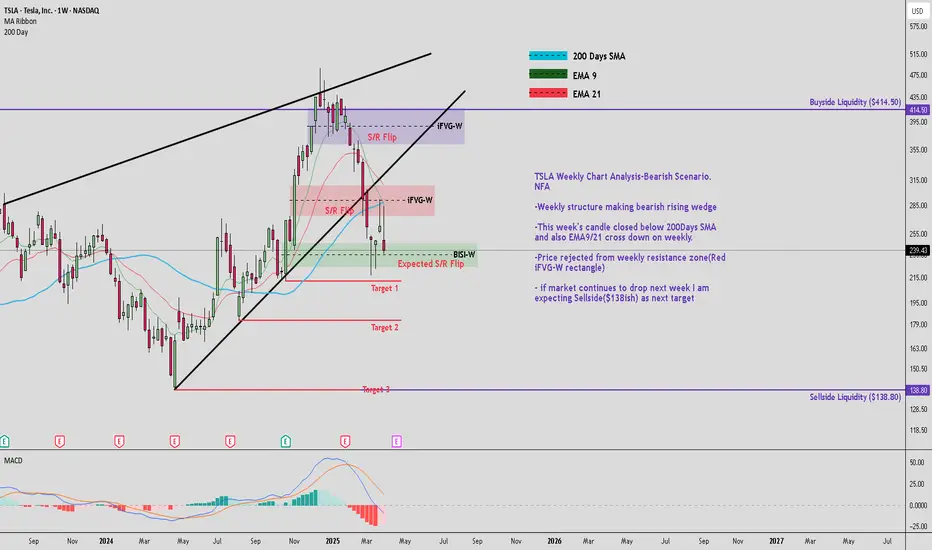
TSLA Weekly Chart Analysis-Bearish Scenario. NFATSLA Weekly Chart Analysis-Bearish Scenario. NFA
-Weekly structure making bearish rising wedge
-This week's candle closed below 200Days SMA and also EMA9/21 cross down on weekly.
-Price rejected from weekly resistance zone(Red iFVG-W rectangle)
- if market continues to drop next week I am expecting Sellside($138ish) as next target
May TSLA, CRSH and burn in Gehinnom - My Short Against TSLAToday, I will be fully committing to a long-term mutli-asset short against TSLA, albeit using a non-conventional approach.
Rather than simply short selling TSLA shares and going into debt, I plan to hold, maintain and build positions in CRSH, TSLQ, TSLL, and TSLY using a combination of share and option spread in both directions. Taking advantage of the speculative, high volatility nature of this massively overpriced stock and reinvesting those short term profits, whenever the technicals and fundamentals are in favor of a short.
It's important to remember, that short positions should be generally be short term, and maintaining them is more about managing risk, position size and dynamic hedging than it is about fundamentals, technicals or even sentiment on the company and people
For example, I currently have Bull Put Spread on TSLL, which is a bullish leveraged ETF on TSLA, the credit from this position funds the purchase of shares in CRSH, which is 1x short on TSLA and pays a monthly dividend. Depending on the price movement and the greek changes on the options, I can close the short put legs or exercise the long puts, going short shares on a leveraged bullish etf... Furthermore, I've done the math and the dividend from TSLY or CRSH can offset either the losses from the options on the short end of the trade or pay margin maintenance on CRSH or TSLQ whenever I choose to increase/decrease the pressure of the overall long-short portfolio .
I won't go into further specifics on the proprietary short portfolio I plan to build against TSLA over the next 4 years, however I will state this is not purely emotional. Using the Kelly Criterion, the ETFs mentioned, the dividend as well as options spreads will give me a very wide net to cast in order to chokeout this Neo-Nazi company to the ground.
When it comes to "hidden fundamentals" and macro economics related to a TSLA Short, it's entirely possible that the US trade war may result in the German Giga factory being shut down entirely . German Criminal Code (§ 86 and § 86a StGB) could be applied to Elon Musk as well as his employees at the German TSLA plant as it explcitly prohibits dissemination of Means of Propaganda of Unconstitutional Organizations, Use of Symbols of Unconstitutional Organizations. This law explicitly prohibits the sharing of people, groups, and organization utilizing pro-nazi salutes such as the one display by Elon. Video of using these symbols to glorify unconstitutional organization weren't just shared widely on the propaganda site X, but were likely shared among TSLA employees in Germany...
There is also the very serious issue of Elon Musk has directly funding far-right political organizations, including the Alternative for Germany (AfD) party, which is under surveillance by German domestic intelligence for suspected extremist activities. German Chancellor Olaf Scholz has publicly condemned Musk’s association with such groups, describing it as "completely unacceptable" and a direct challenge to Germany’s democratic values. Any additional threats of sanction against Germany, the EU may only serve to motivate German politicians to enforce these laws against TSLA. This factory has production rate of 5,000 vehicles per week in March 2023, which if you've ever read Elon's book, you'd understand the strategic importance of this goal and this factory. Beyond this, there are in fact several other smoking guns in the German factory, including but not limited to the use of unlicensed commercial software, used to operate TSLA's commercial hardware. Brownie points if you can spot this in the public video "Flying Through Giga Berlin". Though this video is 2 years old, it is never the less, video evidence of TSLA's violations of multiple German laws beyond the one mentioned above. Though it remains to be seen exactly to what extent these issues, if any have been resolved to date.
I have no obligation to disclose or update people on this position. However, I plan to post most article on these assets throughout the year.

TSLA - GAME OVER!The 15 minutes of fame for TSLA & Elona is over! According to the chart.
Wave 3 up, with an Eiffel Tower ending pattern.
I got the top back in 2021 twice.
1st
2nd
I caught the break out in 2024
I caught the top again in 2024
I am getting the end now in 2025.
I am a macro guy so it won't be tomorrow but it's over.
Yes, there will be some buying opportunities on the way down. Ultimately the result will be the same.
GAME OVER!

TLSA takes a breather, a deep oneTrend Barrier is broken.
Close below the Weekly Center-Line.
There's mostly a reaction to such events, so I expect a slight weekly pullback to the upside before a complete break to the PTG1.
PTG2 could be the continuation profit target mid term.
Rule #1: Protect You Soldiers

Tesla's Unhealthy Rise Could Correct Tesla's Unhealthy Rise Could Correct 🚨
Tesla has experienced a significant and rapid price rally recently, creating a potential imbalance in the market. However, this chart highlights a few key areas that traders should watch for potential corrections:
1️⃣ Gap Formation: A noticeable gap formed during the rally (highlighted on the chart). Gaps often act as magnets, and markets tend to revisit them over time. This suggests the possibility of Tesla retracing to this level.
2️⃣ Resistance Zone (~$420): The price is currently testing a resistance zone after the recent pullback. If Tesla fails to break and sustain above this level, it could trigger further bearish momentum.
3️⃣ Potential Targets:
First Target (~$360): If the bearish move begins, this level, marked as a prior area of support, could act as the next stopping point.
Second Target (~$316): A deeper correction could bring Tesla back to a more balanced price range, aligning with longer-term support zones.

Sliding In December: Is Tesla (TSLA) Losing Its Spark?
As always, we like to keep it clean and simple, with technicals and analysis that's easy to see and understand. Let's get into it:
Losing all its spark? Nah. But, we see a correction for TSLA happening this December, starting within the next 1-2 days. Why?
- It’s currently bumping into price levels we last saw in 2022, which served as a strong ceiling back then and might trigger profit-taking now.
- It's well into a Wave 5 Elliott Wave, signaling exhaustion in 4h/8h/1D timeframes.
- Overbought.
Additionally, many are noting that Tesla’s valuation feels stretched compared to its earnings and growth prospects. Analysts point out that its current price may rely on overly optimistic assumptions about future market share, tech breakthroughs, and profitability. Some also highlight that competitors are catching up, which could eat into Tesla’s premium valuation. Meanwhile, skeptics argue that the stock’s recent run has simply gotten ahead of fundamentals, and a correction might be due as more realistic expectations set in.
We see a 10% slide to the $360 range.
Let's see what December brings.
Be Alert.
Trade Green.

Tesla Are we pushing down to 249 or 241 ??? Good morning Trading Fam
A quick update with Tesla , we did not a see a break up into our buy zone and now a correction or more is in place to 249 or 241. However beware this is either a correction or a bigger move down which currently we need more info to figure out before we make that thesis.
Enjoy the video
Kris/ Mindbloome Trading
Trade What You See
