TSLA Breakdown at 800Failed to breakout to the upside, slowing trend with consolidation between ~885 - 800. Very strong resistance at 800, however there is a lot of air if it breaks.
Look for closing daily prices below 810 for short opportunities. Look at 780 intraday for last chance tests of resistance.
Tslashort


TSLAFrom someone who claims to short is a scam and justifies said argument with out-of-context statements of not being able to sell a car without owning it, how about not selling stock in a company that doesn't profit without selling credits or pay a dividend? what a clown. Further, he wants to SHORT the planet earth and is burning all his cash in hopes of new wealth in another world. He just needs to apologize for the hypocritical insults on shorting and own that his very life is the biggest short position and happens to be a short position against the planet EARTH. Nothing wrong with shorting but it shouldn't be legal to do in such large volumes relative to the current order book, and assessed over time for adjustments.
End rant....
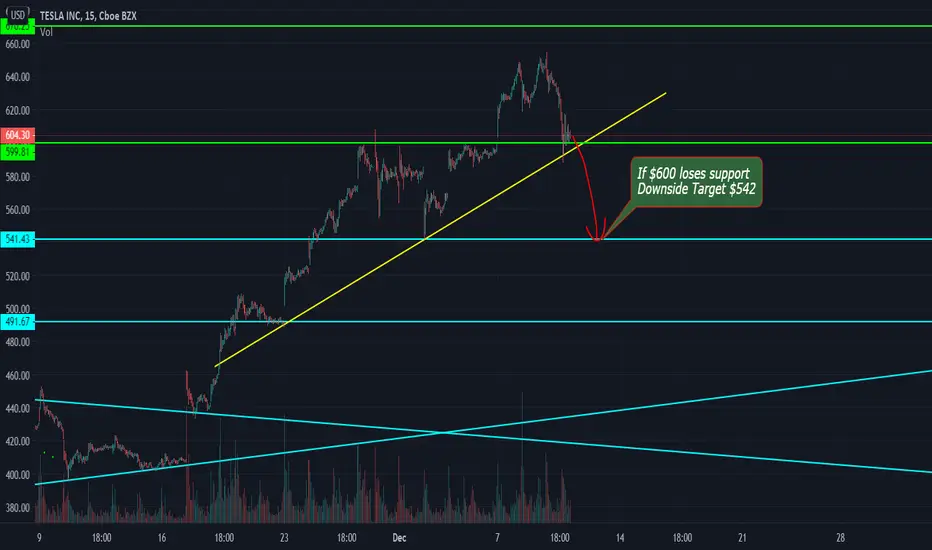
As far as the technicals are considered: If we break the steep support line we closed at on Friday(less visible green line following the price above the channel), we will probably return to the red rectangle or lower if the broader markets decide to cool off.

Diamond top formation in Tesla. Go ShortAfter the failed breakout of the rising wedge a week or so ago Tesla moved up again but failed to make new highs. Now we have formed a diamond formation which sometimes although rarely comes at the top of a long uptrend. This may be what we are seeing here.
Here is Investopedia's take on it
www.investopedia.com
This certainly looks like one to me here, perhaps we will see an attempt to break the formation to the downside the next few days. I had expected buyers to step in the last 24 hrs with the bitcoin asset that Tesla now own having gone up massively in value, however the market (in Tesla not Bitcoin) seems unimpressed.
Here on the extended hours chart we can see Tesla made an attempted a break of what could be perceived as a flag but that failed, now perhaps it's time to test the bearish reversal pattern of the diamond formation and the strength of sellers.
Note of caution
Most breakouts fail. In order for sellers to be successful we need to see several things:
1) The bigger picture confirming the possible break
1) Lower timeframe moving averages confirming the direction of the break
2) A build up of break pressure like a coiled up spring
3) Volume coming into the break
4) A clear resistance level (here shown as red line) near the break point which would act as strong resistance against a fake break
What do you think? If you agree and think we all the above, then we can attempt to go short and we could look to target the green support line in the top graph. We should enter before the break not after to minimise risk and so as to be able to bring our trade to break even straight away. We should then look to take 50% of our profits after the break as most breakouts fail due to overbought or oversold conditions. All being well we can hold the rest of our position till we hit our target point. We could even consider adding to shorts on pullbacks as we go down.
Follow the trade above and i'll update it as and when.

TSLA Major Correction? Share your thoughts!Today I decided to zoom out and look at the big picture. I was looking at the monthly chart of NASDAQ:TSLA . I noticed that the current month is a green 8 on the TD sell setup, which means that next month is going to be the reversal signal. I imagine the candle of February to be red or a bearish pin bar (shooting star). Before I dive into the analysis, I want to make clear that I am long TSLA. Fundamentals have not changed. Tesla is going to be the biggest disruptor of the decade. What this analysis suggests is merely a correction. The scale of the correction might be too big. I measured it to be 38% at the smallest price range of the movement, and 49% at most. It is. no doubt. steep compared to the most recent correction of 34% in Sep 2020 which I marked in the chart above. Either way, TSLA is no stranger to these swings, so let's give it a deeper look.
I previously called a target for TSLA at $1050 which lies above the border of the broadening wedge. This target has not yet been achieved, so we're still in that long position. It's actually playing out as drawn (see related idea ). From there, I see a breakout and going to new highs towards $2000 during 2021 as this image illustrates.
But seriously, how is it fun sailing up to $2000 without some bumpiness? Right? From where we are right now, a rise to $2000 makes a little more than 2X in terms of gain. But take it down a notch and correct to about $550 and then jack it up all the way to $2200; and you get the headline "Tesla climbs 4X in 3 months as more wall street shorts get liquidated!". Michael Burry will have exited his short of course. Oh and what would cause such a crash is perhaps another Tesla crashing into a police patrol while on full-self driving. Now that we imagined it, let's see it on the chart.
I drew two downward paths. Both are one-month long. The first starts after the $1050 target is reached. This will be the ultimate bull trap. Traders who sell at the top of the broadening wedge and would re-enter once price has broken above it are the ones that will eat the bull trap. The second path I drew starts after some consolidation along the next descending resistance line. Notice these parallel dotted descending lines. I estimated the next one using Fibonacci. So the idea of the second dotted path is that price gets squeezed between the descending trend line and the ascending top of the broadening wedge. At that point, I know that I will be in so much doubt whether price will plunge downwards from that squeeze or explore upwards. We'll just have to keep collecting clues to favor one bet over the other.
The target of both paths is the bottom of the broadening wedge. In my estimation, if this correction happens, this will be the bottommost point for TSLA onwards.
For the stop loss, you will have to keep watching this idea as I update it, because I can't decide a stop loss yet; except I would loosely say it's the descending trend line that price action will decide. We have to wait and see a bearish reversal signal such as a shooting star candle or a higher high in price coinciding with a lower high in RSI.
In conclusion, I have to make clear a few points:
I would never recommend shorting TSLA. TSLA has much much more room to the upside than it has to the downside. TSLA is much much more likely to see $2000 from here than it is to see $400. So shorting is a BAD idea.
This is merely a warning with the goal that you make sure you are not too leveraged, that you prepare mentally before a correction happens, that you do not panic if it does happen, and that you prepare to add to your position at the bottom. TSLA is a long term investment for the coming decade. It is not a trade.
This is one of those calls that I'm only publishing for fun and learning, and to entice thought and have some of your opinions. So please leave your opinion in the comments.

TSLA going limpTSLA just got a bunch of cars recalled and elon disappeared off twitter. I propose tesla is going into limp mode and will lose a lotta moolah. This is my amateur garbage stock analysis thank you for coming to my TED talk

Short TESLA today. Who is the big shorts Micheal Burry?Ok so with trading timing is everything. Lets face it that Micheal Burry from the film "the big short" got really lucky with his housing market short in 2007-8. It's one thing knowing a market will sell off, it's another thing timing it. Fair enough he had to get all those swabs sorted as there wasn't even an instrument to short sub prime back then. Micheal was so early with his trade though that it nearly costs him dearly.
Here he is again lining up his Tesla shorts for ages now as the market has been going higher and higher.
markets.businessinsider.com
I've been trading TESLA the other way adding to longs again and again while most trader said it cant go no higher! Now we are at a point though that the MACDH on the daily chart has finally trigged an extremely bearish divergence. These extreme divergences work out 80-90% of the time. The Dow had one a couple of days ago and selling has been hard down a 1000 points or so the last day. We have also had Yellen saying "we don't see a lower dollar" last week which has caused the Dollar to strengthen, gold to sell off and equites with it. This is actually the first time Tesla has put in a major divergence like this in several years. Looks like a low risk high reward short to me ahead of the fed this afternoon. Everything depends on them and how much Yellen can really do to stop the plummeting dollar.
I think we can trade short TESLA down to at least the $700 dollar region. Stop at the high of around $902.
Let's see if we can outsmart Micheal Burry a little anyway with our TESlA short timing today.
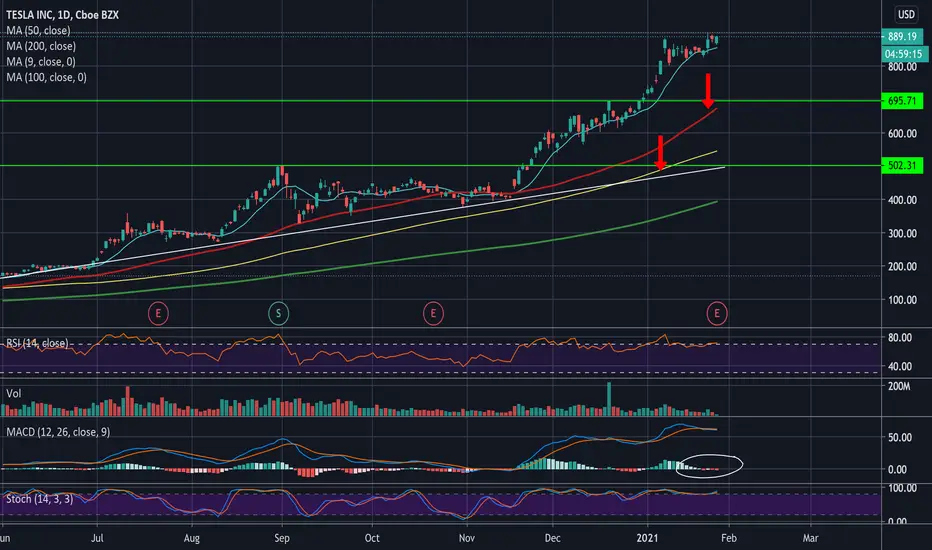
Tesla: the bubble is about to burstYesterday, 27 January 2021, after market, Tesla reported. The reaction to the report gave the final sell signal; the sign that the bubble is about to burst.
If we look at the chart since 2018 we see a sideways movement up until the beginning of 2020. Since 2020 Tesla is moving in a steep uptrend. Since the beginning of 2020 the price has roughly ten folded. In my opinion a big bubble has formed since 2020. To quote CNBC: "Tesla’s market capitalization has increased by more than $500 billion in 2020, and the company is now worth about as much as that of the nine largest car companies globally, despite selling a small fraction of the volume of cars that they do."
If we look at the indicators we see that since the beginning of 2020 a divergence with RSI and Di + is forming. Since November 2020 Tesla is up trending within the uptrend. This trend within the trend broke yesterday. Today we gapped down out of this uptrend. MACD also gave a sell signal.

$TSLA - END OF PARABOLIC MOVE? TARGET $485- $87 $SPY #TeslaI'm bullish on TESLA TECH but there is a limit for anything & there is no exception.
It's too pricey at the moment and could be end of PARABOLIC move & has to correct 60-80%
I laid down the target in the chart.
However, require confirmation on the same if it hits my First downside target $485.
Good luck both BULLS & BEARS.

TSLA - Gap Fill Up, Bull Pennant Breakout - Hi Ho Hi Ho Up We GoRound Two of Riding That TESLA Electric Train!
Gap fill up to high $870s today - drop below $832 ($835 really) it's a bust. Potential for decent gap up overnight if we finish the day >+3.5%

TSLA -- looking for pullbackIt's Tesla so it's always crazy, but I always just look for putting as much odds in my favor as I can.
One count I have shows potential pretty good resistance around $850 - 855 area. Premium is always high with Tesla so I'll be looking for potential call credit spreads on this one.
After hours it edged up higher, and, if tomorrow it holds and pushes up, I'll watch to see if we tag 850 and watch price action as I'll look to sell premium on this one in a bearish play.
Couple zones below, notably the $750 area, to watch as well. If price does pull back, signifying a potential wave iii is put in around 855, the 750 area aligns well with a standard wave iv pullback right within a demand buying zone.
My game plan: if price opens up, will watch for it to push to 850 area. Once there, I'll look to enter a call credit spread to sell some premium. If price does reject around 850, I'll look for it to go test back down around 800 and 750. But, it's Tesla, hence why I'm not saying just outright short it. Doing a credit spread gives you an edge due to premium in Tesla's options. As always, know your risk level and know when to take a stop loss. For me, after a potential pull back which I will play, will not surprise me at all for Tesla to reach $1,000...

TSLA - short scalp opportunityTesla usually sees late day profit taking and stop loss scalping. Usually occurs mid-late afternoon, and if sentiment is overwhelmingly positive, the MM's will typically do a late day spring that will rocket the stock into tomorrow. This trade idea is a short term scalp.
The $830 put option exp 1/8 has a time value of only $3-4/ea. Retracement to the high $790s would yield a $8-12/contract return.

TSLA head and shoulders on 15 minute. down we go?looks like head and shoulders forming on the 15 minute. PT of $740


TSLA - Gap Fill Up, Bull Pennant Breakout - Hi Ho Hi Ho Up We GoChart speaks for itself...If gap lasts to 9:30, we fill. Key Levels listed on chart. South of $715 is stop loss and trade is a bust.
Picking up some calls shortly after open. Will double the position once we see a hard bottom.

TSLA - Bears Taking ChargeI've always been skittish about shorting TSLA for obvious reasons, but the bears may be gaining momentum that's hard to ignore. With Wells Fargo analysts making a dire prediction that TSLA is the next AOL, and the uptrend breakdown over the last few days - I think we'll see some more sideways or downward price action on TSLA in the next day or so - short of any major actions regarding the stimulus. North of $674 however, this trade idea flops. Price target $640


TSLA boom or bust for 12/21?Tesla and SP500 is now last friday's news. I think we see a spike in pre-market and then market open on Monday i think all the short term buyers will sell off. TSLA will do its accordion thing bouncing between 500 and 700 and end up somewhere in the middle 600? anyways with all the buying thats completed worried about calls having IV crush and sold friday while holding shares to see what happens in the morning. dip buy for sure. good luck!

TSLA Analysis With the current uptrend and inclusion in the S&P 500, the price could hit in the range of $700 ¬ $750 and then will be a huge sell-off before it continues to more uptrend.

Regular divergence on TSLA, short orderSeems that the technical indicators are all coming down, but the price is still up. Will short TSLA at the R1 pivot level


TSLA TREND 2.0Ichimoku lagging span is still showing a strong bullish trend.
Now, there are pullbacks which is healthy for the trend but they are nothing more than that.
Simple and healthy pullbacks.
The ichimoku lagging span indicates how weak the pullbacks are (opinion: i’m guessing it is due to sell offs from investors who are taking profits for the holidays).
Also, there seems to be strength within the 600 mark, as it acted as a form of strength and now a possible form of resistance since the 600 mark was broken, and is now providing resistance for the price action.
My last indicator for a further uptrend would be the VWAP as it broke past the VWAP and bounced off of the VWAP at 603(still keeping above the 600 mark.
Best bet would be to HOLD at least until after the S&P500 inclusion. It would be a good chance to TP, but it may also be a perfect opportunity for more resistance above 600. As further growth comes to TSLA, long term positions should continue to prosper.