Tesla DOWNTREND (short-term)NASDAQ:TSLA
Tesla is doing a great job delivering and producing its car during this crisys and it showed already its strenght but I think we will see a mid-term sell until the support I spotted. This should happen becouse of the too fast short-term growth of the shares of this company. I think it is a sell until it does touch the orizontal green line I spotted as a support. The Stocastic is also supporting that at this price tesla action are overbought. I personally like the way Tesla applied industry 3.0 and mecanical robot arms and even the internal production facilities but in my tecnical point of view I should wait to another support touch(will be the 3rd one) due to the too fast price growht of last weeks and due to the actual covid situation in US too and as we know Tesla is even in China and right now there is high tension between China and US. Let me know what you think about this analisys, have a good trading day!
Tslashort

Huge reversal from TeslaIf so the 5th wave is about to end. Probably at 1180. Then we should expect a 3 wave retracement at least to 800 levels

TESLA growth analysisHello traders,
As the TESLA stock price chart shows, TSLA is taking an upward trend, the support S1 confirms that.
Since 18 Mars increase to a specific maximum point (Point A, B, and C), and then take a break to prepare for another one.
Right now, we have another increasing trend of TESLA. Two scenarios:
-- Either, it will continue to reach a new maximum, and go back down as a break. That break will be decreasing and must not be below the level “L”, in that case, we can say it’s going up again.
-- Either, it will go down below that level “L”, and in that case, we can say that this trend is ending.
Generally, we expect that it will go up, take a break by going down to bounce on a level that is higher than “L”, and go again in an increasing trend.

TSLA correctionAnother chart pattern is completed, but result is not. In the case of the red alert, it seems that TSLA cant go up quickly. I am on the purple trend side.

TSLA temporary short and long setup on the daily chartTSLA is testing $954. The overall market has been slowly correcting and is likely to pull TSLA down with it. Short target 1 would be around $833 and that could also be used to start a long position. Short target 2 would be around $673 and that could be used to start a long a position as well. 50% Fib retracement is at $673 so we could possibly test this area and take a long position.
Also, take note at $833 and $673 there is a lot of support and these almost perfectly line up with Fib retracement of 78.60% and 50% respectively.

Tesla - Bearish & consolidation Target -900 -910 level
Rsi signal -bearish divergence
support - 840
no strong resistance
Plz like and share it

TSLA Puts and Short on the menuBought 1 TSLA Put 400 18/09 yesterday at $1007
Let's wait and see.
I am a small fish. Hopefully bulls don't learn to swim.
Not financial advice.
The whole market needs a chill pill.

🤣 Yo! Elon! Whatchu Wanna Do? (TSLA)💰 LET'S GET INTO SOME TESLA ANALYSIS!💰
1️⃣ First off SMASH that LIKE BUTTON & Give us a FOLLOW for DAILY ANALYSIS! ❤❤❤
- Most of the market is bleeding currently. Zoning in on a 2 day chart for tesla entry.
- Look for the compression on the Crossover strategy and align the red ema dots for a long term play.
- No confirmation just yet.
Best of luck to you and all of your trades this week! 🤜
Drop your charts and comments down below, share with us what you think is going on in the markets! ❤❤❤
Thanks for checking out our analysis! ✌😁✌
🥇MLT | MAJOR LEAGUE TRADER

🤔 Compression Shows signs Of Potential Tesla Selloff. (TSLA)💰 LET'S GET INTO SOME TESLA ANALYSIS!💰
1️⃣ First off SMASH that LIKE BUTTON & Give us a FOLLOW for DAILY ANALYSIS! ❤❤❤
(Overall Market Sentiment) 🤷♂️ Neutral
- We are seeing 2 compression candles known as dojis relativity towards the top of previous Resistance. This is where we would like to look for distribution. We do not have 100% Crossover confirmation on the Crossover strategy. It's not a confirmed play just yet. Need a little more time.
- Only 1/3 ema dots are firing red as of now. This also does not show a trade confirmation.
- We are playing in a nice size range, if we get a Crossover and selloff we could play a short for up to 10% for a potential test on support. If we were to collapse and break old support, chances are that this break to the upside was just a fakeout.
Thanks for checking out our analysis! ✌😁✌
🥇MLT | MAJOR LEAGUE TRADER

💥 The Highs Are On High Alert! (TSLA)🤔 Just looked at amazon, facebook and now tesla all show correlation to testing the highs.
Look for it to play the red upward support and squeeze in the compression point. Break below look for a short back down. I think we are still evaluating if the breakout at 902 to the new highs is a fakeout or going to see if support can hold. You see that we did drop all the way back down but bounced right back up off that old major Resistance level.
The larger timeframe like the daily and 3 day are still green so I don't have that long term confirmation yet.
My main concern is how I'm seeing the Resistance levels across the board be tested right now.
Have an awesome trading day and weekend. ❤❤
🥇MLT | MAJOR LEAGUE TRADER

Tesla vs Daimler vs BMW Market Cap and revenue Tesla Market cap is valued at 184.88B with a Revenue of 24.58 billion USD (2019) while Daimler AG, commonly known and referred to as Mercedes, has a Mkt cap of 39.28B with a Revenue of 172.7 billion EUR (2019) and BMW has a Mkt cap of 37.04B with a Revenue: 104.2 billion EUR (2019).
Also Tesla’s new registrations fell 37% in California during the coronavirus pandemic, said today`s report (6/17/2020).
The indicators are showing a huge overbought level.
I`ve entered a short till the Fib 618 level of 614 USD.

TSLA:- Hourly BearishIn short term of the technical analysis, the chart are showing a very strong down trend aside from the fundamental issues.
Was actually quite healthy for Tesla to retrace for a longer journey, for the meantime we will expect it to go at least till the tend line or even breakthrough it before a further positive movements.
Fundamentally to look out from:-
Covid-19 second wave
Tesla Batery Day
The uncertain visions:-
EV will definitely be a trend in long term. However, the competitors are following tightly from Tesla's back.
Due to Covid-19, people are seeing a work from home more than travelling around (this may carry to our future lifestyle), that says will car sales be potentially fall due to car may not seems to extremely crucial compared to the past. Everything accessible from "Home".

Tesla Searching For Support. (TSLA)🚨 Very critical price action move for the next big tesla play.
We did get our breakout to attempt to push up, but fakeouts can happen.
You're going to look for 926-930 to test for support. We are pretty much testing it now!
If this was a fakeout expect a big selloff. You can play aggressive here if you wanted to catch this as a level support only if the Crossover strategy plays and the ema dots line up for a curl back up. Otherwise for a longterm position you will want to look for 1024 to breach to shoot for a new bull trend.
Good luck! 🎲🎲
🥇MLT | MAJOR LEAGUE TRADER

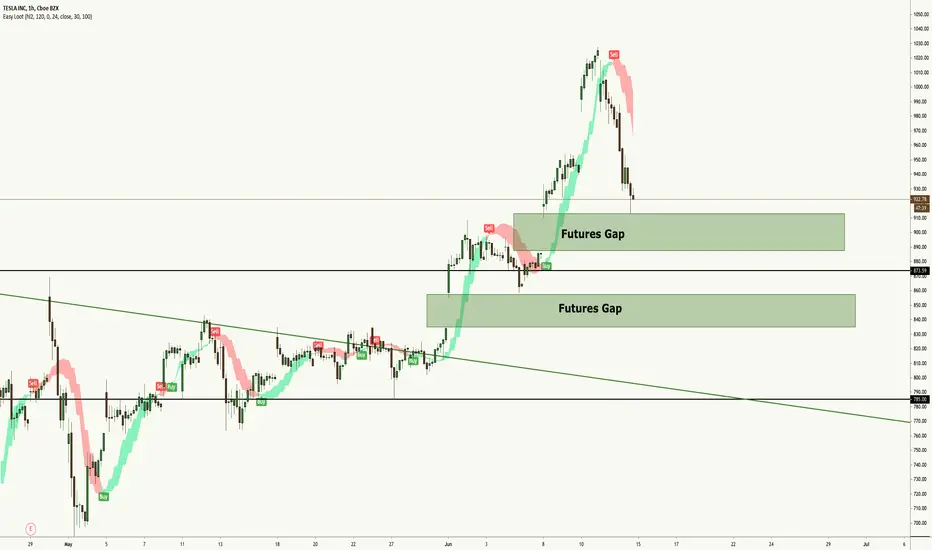
$TSLA Where Will it Stop Bleeding
Tesla is coming down in stock price, with two futures gaps to close on it's way down
That is how we can predict where it's going to stop bleeding
Start of the uptrend that brought the move up is $785, look for entry along there
1st Futures Gap of 5% will crash price down to $874 support
2nd Futures Gap of another 5% will crash price down to test the topside of this downtrend as well as the $785 start of the uptrend support level
Don't bet against the patterns of the market, you will get clapped/
TSLA - Short entry opportunity Filled gap from 970$ to 950$ today. Recent TSLA rally loosing steam - aided by TSLA downgrade from formerly bullish analysts to underweight and overall market loosing momentum. Retest of lower line (blue line) of uprising channel likely, look for breakdown below. Confirmation by a retest of the lower line (blue line) of the rising channel form below -> could provide great short entry spot. Very extended from 200 sMA aswell.


Told You Play $910 Level, Look What Happened. (TSLA)June 7th , we approached a very key level of $910 and I alerted you to play this edge on breakout. Now Tesla has printed around a %12 gain in just 3 days! 💰💰 Congratulations if you played it.
All indicators from the ema dots to the Crossover strategy candles showing strong green pressure.
Best of luck,
🥇MLT | PRO TRADERS


Fun Time Approaching For Tesla! (TSLA)I am highly interested on tesla as we approach an edge play at all time highs!
Followed by the massive market crash tesla has ran non stop on the larger timeframes to the current position of 885.66, that is a lot of rocket fuel! 👨🚀
BEAR SCENARIO:
What your going to want to look at on the daily timeframe is to watch for the Crossover strategy take place. We want to see the green candles compress for a red doji crossover for interest on a potential massive short position. Once we ge the cross confirmation the next step is to start to see the red candles cross over the green line that it has been trending above since the bottom. That is how we will spot the Resistance pressure.
We notice on the ema dots below we have one confirmation of red dots printing, we need to see them all line up and follow. Your strongest confirmation is when the candles and the ema dots align. That is the money shot. Like we say in say in our course we always use tight stip loss in case of a reversal! 1-3%
BULL SCENARIO:
We already have green candles in motion but the current Resistance level we are watching is 910.04.
As we approach this edge we want to look for a breakout to fire long. So if we can get price to break we will fire long and apply our stoploss and continue to track tesla based off the ema dots and the Crossover strategy. Our stoploss will become 1% on a break back low then to reverse to a short and play this level till we get pull on the new long term trend. (Tight risk management on breakouts) A breakout like this your going to see a pullback to test it to see if the highs are a new level of support or just a fakeout. If bull pressure can snap it and really kick in you should be solid. If it hesitates then you know something is up.
All time highs are a great spot to look for a very long term position. 910.04 is your money level. Play the strategy to the book. We will be using the daily and the 3 day charts for this one. Will stay updated on tesla as I scout it.
Best of luck, enjoy your sunday and have a blessed day! 😁❤✌😁❤✌
⬇️ Drop some comments and let us know what you think will happen next! ⬇️
🥇MLT | MAJOR LEAGUE TRADER

Tsla:- Short term BearishLooking at the rejection at 884, there will be a short term rejection before continue to the normal routine.
Furthermore Tesla competition out on the market are growing much stronger from multiple anger.

Smooth Sailing. (TSLA)Tesla, wait for that 3 day to Crossover to the dark side.
Green and red support and Resistance levels drawn for you on breakouts.
Implement 1% rule on edge plays.
You know the rules.
Get that money 💰💰💰💰
🥇MLT | PRO TRADERS


Entering short because with none riskMarket looks to dump today... Tesla is in the wedge still, which is why I will be using a tight stop all day. Good luck and remember this is only advice, make your own trades.
