$TSLA PRIVATE AT $420? As I am sure you all are aware of the speculation surrounding $TSLA going private at $420, I want to hear: are you still LONG/SHORT or has your opinion changed? Personally, I have too many questions about them going private. The main one being the price target of $420 are where this funding has been secured from. According to Elon's tweets, shareholders can either decide to sell their shares before going private or being the will be able to keep them if it ends up going through. Elon is no stranger to this as he does the same thing with Fidelity's investment in SpaceX. I do agree with the fact that Tesla short propaganda is real from short sellers, but I think the is an issue that Elon holds personally (which in hind sight can have upside and drawbacks simultaneously). Im sure the next few weeks will certainly be interesting to say the least.
Tslashort

Tesla Elliott Wave Analysis: Correction Sill In ProgressHello Traders,
In this Elliott Wave Analysis, we will have a look at Tesla in the 1-hour timeframe.
Tesla ended the cycle from 04/02/18 low (245.19) at the peak of 06/18/18 (373.85) in blue wave (1). Below from there, the stock is in the progress of correcting the cycle from 04/02/18 low in 3-7 or 11 swings lower in blue wave (2). The internals of blue wave (2) pullback is unfolding as an Elliott Wave double correction where red wave W ended at 07/05/18 low (296.05).
The internals of red wave W unfolded as a flat structure, where it ended black wave ((a)) at 06/26/18 (325.54), black wave ((b)) pullback at 07/02/18 peak (366.85) and black wave ((c)) of red wave W at 07/05/18 low (296). Up from there, it ended red wave X pullback at 07/10/18 peak (329.44). Below from that peak, it ended blue wave (w) at 07/24/18 low (292.35) and blue wave (x) pullback at 07/26/18 peak (310.63).
Near-term focus remains towards the area of 272.92-264.22, which is 100%-123.6% Fibonacci extension area of blue wave (w)-(x) before a reaction higher can be seen. As long as the pivot at 329.44 peak stays intact, we expect it to extend lower as the right side remains still to the downside.

UPDATE: TSLA bulls regain control, target $450Hi guys, thank you for the support! I will have this analysis out each weekend as well as daily updates throughout the week, if you guys like what I'm doing hit the "follow" button and you will get a notification each time I post a video or chart!
Have a great day everyone!

UPDATE: Positive catalyst for TSLA, potential target $450Hi guys, thank you for the support! I will have this analysis out each weekend as well as daily updates throughout the week, if you guys like what I'm doing hit the "follow" button and you will get a notification each time I post a video or chart!
Have a great day everyone!

Using Technicals to measure TSLA market fatigueI've never charted TSLA using my relatively new charting skills so I thought I'd check it out. Remarkably, charting Tesla reveals a lot of predictable price action.
First thing that's noticeable about Tesla is that despite growing losses and a lack of profitability Tesla has remained more or less in a bullish channel since the beginning. Despite a great deal of volatility there's been an extreme level of support that's more or less allowed the stock to continue increasing in value despite relatively poor results.
However, noticeably, starting Sept 2014 TSLA began a negative trend within the larger positive channel that ended with the Trump rally following the election in Nov 2016. That rally peaked in mid to late June 2017 and the market has been in a descending channel since then. This descending channel differs from the 2014 one in being newer (obviously) with the market yet to trade into the lower half of the channel. Notably, during the 2014 to 2016 negative trend the market mostly stayed within the upper half of the channel which indicates the faith of core TSLA shareholders. During that time, TSLA was still "new" and "fresh", allowing optimism to overrule skepticism.
Now, in 2018, we're starting to see signs again of skepticism creeping into the market. At the peak, 1 W and 1 M (month) RSI divergence was signaling. These are major sell signals and in the case of the 1 M signal it took nearly 4 years for the signal to occur beginning with a RSI peak in June 2013 followed by a subsequently lower RSI peak 4 years later in June 2017. Looking at 1 W signals it's clear that divergence signals were followed by periods of consolidation but the cycle for Tesla clearly looks far into the future, allowing each period of draw downs to be followed by buyers attracted to cheap shares. TSLA price bounced hard right as 1 W RSI hit just above 30, indicating the strength of TSLA in the market.
Now, with price having dipped about $100 off the peak with clear 1 M divergence signaled we can get a better sense of the market fatigue from TSLA based on technicals as well as fundamentals. The recent dip followed reports that the Model 3 continues at a low production level, likely because TSLA can't sell them for $35,000 at a profit (which is what Elon Musk more or less said himself) but at nearly $80k they can produce them profitably. When combined with the absurd 6-9 month wait for a vehicle and announcements from BMW of a Model 3 beating model slated for the 2020 model year the market seems to be very clearly reaching a breaking point in its "faith" that TSLA will ever be profitable or will even "survive" as Elon Musk put it (more or less - don't remember the ask phrasing).
Elon Musk is clearly aware that Tesla is at risk of losing too much money too quickly that they cannot continue to operate. Overall cash flow has become a major concern for them and they are running out of gimmicks to pull, i.e. like the Boring Company, or announcing the Roadster and the Semi to crowdfund their operating cash. At some point soon, they will need to actually make money or the market will turn against them.
These things all appear to be signaled by the price action over the last 4 years. Beginning in 2014 the market began to fatigue and price fluctuated significantly but failed to break that much higher. Then the Trump rally boosted the stock market all across the board. As 1 M RSI divergence was signaled the market started taking profit but an expectation of the Model 3's production ramp up allowed price to stay up through early 2018 but as the Model 3 repeatedly failed to reach the target production capacity as promised/expected, we saw about 3 tests of the upper channel line by the market followed by a sharp drop off as the market began to price in failure.
Given the current price level near the middle of this descending channel and the market yet to test the bottom of the channel and 1 M RSI divergence, shorting/buying puts on TSLA looks promising.

Watch out: Cup & Handle forming and Q1 Results!Tesla is still trading within the profit area I identified on March 19th, 2018. It's currently trading BELOW the 200 days EMA as well consolidating the bear tendence.
On the other hand there has been an adding up of long positions lately, probably in the hope of a bounce right after the Q1 earning report scheduled for May the 2nd.
The movement on the hourly chart shows a probable cup & handle formation taking place. It might be a burst but it is worth taking a close look at it.
If, and I highlight the IF, this formation completes I would set a TP at around 305$ more or less. Still within the profit area I highlighted on March 19th.
It is important to notice that on May the 2nd the company scheduled the Q1 financial reporting and Q&A webcast. I personally do not expect a lot from this. And all I expect is no good news.
The company missed production targets for the Model 3 and we already know that. The company closed down the production lines recently due to various issues and all I expect is a confirmation of all these problems (and much more) in the financial results too.
***As usual, not a trading advice, merely my idea for educational purposes only***

Using Trend Indicators to Help Determine a Short in TSLATSLA is having quite a bit of news these days. There are plenty of traders who will use that for fuel to look long or short. However, that's not what I want to do. I want to let the chart tell me what to do. As I'm not using my actual trading platform, a few things will have to be "givens". Feel free to look these up for yourself.
This is how to trade using a plan for the entire process start to finish before you enter. If you do not have a trading plan, do not take this setup. This is for educational purposes only. Trading involves risk and you may lose actual capital by taking this trade if it does not work. You must trade your own plan. I simply wanted to show you what that can look like for a specific trade.
Learn more by joining our CTP Group and start building your plan today. mailchi.mp
Using two price channels, the shorter mid line has crossed below the longer midline on both the daily and weekly. What this means is that daily and weekly price action is geared towards the downside. This has failed before, but this is not the reason to short, simply a confirmation piece that the short is valid.
Using the 60 minute, a high probability short is presenting itself. Not shown: MACD & 200 simple moving average.
Shown: 50 simple moving average, ichimoku cloud (cloud only, nothing extra to keep confusion down as much as possible) and 20 range price channels.
TSLA is closing below the 20 range low, under the 50sma, and below the cloud. The 200sma (not shown) is above the 50sma which shows bearish strength from a moving average perspective. The MACD (not shown) and MACD Avg are both below zero showing short side strength.
Setup 1: Short when the 60 minute closes below the 20 range low. (Triggered Just now on close at $282.65)
Setup 2: Short when the 60 minute closes below the previous pivot low at $282.51. (Not Yet Triggered)
Initial stop (aggressive) above today's high which is $291.62 using whatever cushion your plan suggests.
Initial stop (conservative) using the 20 range high. Exit if the 60 minute closes past the 20 range high or move your stop just above the bar that closes above the 20 range high.
Profit target: $250
Trailing Method: Once the 20 range high gets below your entry price, walk the 20 range high. If price closes past the 20 range high after it gets under your entry price, exit immediately or move the stop just above that bar's high.
Do not move the stop until the 20 range high gets below your entry price. Accept the full risk going in. You reduce risk when it's not working, not when it is not working and you really didn't want to lose what you put out there.
If target reached, take all off or 1/2 off and walk the 20 range high for the rest.
Earnings for TSLA are May 2nd, you have plenty of time to exit before earnings. Do not hold thru earnings unless your plan allows. Earnings have substantial moves and a 60 minute chart is not where you want to be trading earnings from.
This is a high probability trade but that does not guarantee it will work. Trading is not about guarantees, it's about trading consistency to produce an edge over the long haul. This is how every trade you take should look:
Reason to take the trade
Where to get in
Where to put the stop
Where to get out (Notice trailing it is an option, it doesn't have to be 1:1 or anything like that)
When to reduce risk & trail
Known news events that could disrupt your trade & what to do about it
If it doesn't, it's time to start learning how. Join the CTP Group Today. mailchi.mp

tesla short - trend and fibboTA say tesla might continue its path down, also tesla gets loads of bad commentery over them, that also is a reason they might go down even more!

TSLA Stuck in the middle! (but more bearish than bullish)TSLA has had some crazy moves recently between its down move from 360 to 245 and then back up to 310 (that is down 32% then back up 26.4%!!). TSLA is currently stuck in a range between 310 and 290 and an argument could be made for either direction going forward, however the current trend is down and TSLA has not been able to break the descending trend line from 2/27/18 and 3/12/18 yet.
On a break down a reasonable price target would be about near the bottom of the gap 3/27-28/18 and 3/27-28/17! (funny how same gap same day 1 year apart!). However moving down, below 245 there is major supply from the consolidation of years 2013-2017 which would make a move lower more difficult.
On a break out a reasonable price target would be about 320 at the 100 day moving average and the top of the gap from 11/1-2/2017.


DEAD FROM INSIDE, HEALTHY FROM OUTSIDE: LIKE STERIOD USER (TSLA)
TSLA Net profit each year ( lossing millions)
( in Millions)
2007: -80
2008: -79
2009: -52
2010: -147
2011: -251
2012: -394
2013: -61
2014: -187
2015: -717
2016: -667
First, let's see what other successful investors have to say:
David Einhorn: Took a huge short position on TSLA
Einhorn has averaged annualized returns of 16.5% over the last 20 years. He's no mug.
Berkshire Hathaway: No long position of TSLA stock
Berkshire Hathaway is Warren Company and big than all others
Even Elon Musk himself admits his stock is overvalued:
www.cnbc.com
I mean it's common sense, someone else is paying $55 Billion for a company "x" because he thinks that company is "Cool" doesn't mean you should also pay the same amount as you know the fact that company "x" is losing $400-700 million a year.


TSLA - From stretch to relaxThis is a situation, where TSLA will reach the centerline with a chance of over 80%, according to the rules of the fork.
Playing this small, but playing it.
P!

TSLA Support at 247Fibonacci Extensions and a bull flag pattern completion give a measurement of support to 247.32


TeslaLooks overbought based on CCI, rejected at the green line, might make a push to res at 270 due to the Trump rally the markets are experiencing


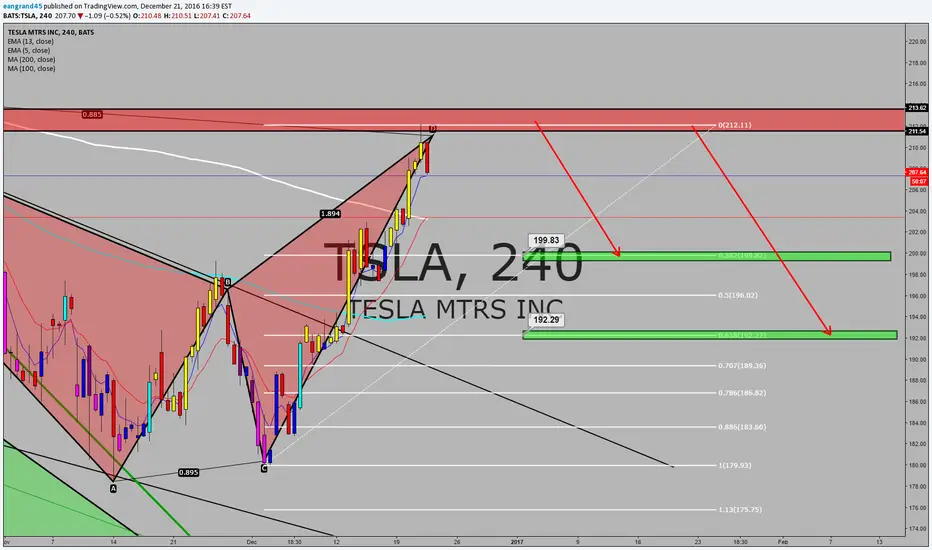
Is it time for Tesla's annual price raise?Current Reisistance @ 217-219 (.618)
Look for resistance to test .382 @ 240's

Bulls of Wall Street - TSLA Possible Setup, Will be looking for an entry within the next 2-3 days. Stay tuned!

Still bullish on Tesla?
Bearish Harmonic pattern, decreasing MA's, lower highs/lows, oil optimism, close below long term .381 retracement ( no support from .5), am i forgetting anything? Be careful friends.
