TSLA WEEKLY CALL SETUP — 07/23/2025
🚀 TSLA WEEKLY CALL SETUP — 07/23/2025
📈 AI Consensus Signals 🔥 Bullish Move Incoming
⸻
🔍 SENTIMENT SNAPSHOT
5 AI Models (Grok, Gemini, Claude, Meta, DeepSeek) =
✅ MODERATE BULLISH BIAS
➡️ Why?
• ✅ RSI Momentum (Daily + Weekly = UP)
• ✅ Bullish VIX sentiment
• ⚠️ Weak volume + neutral options flow
• 🧠 No model signals bearish direction
⸻
🎯 TRADE IDEA — CALL OPTION PLAY
{
"instrument": "TSLA",
"direction": "CALL",
"strike": 380,
"entry_price": 0.88,
"profit_target": 1.76,
"stop_loss": 0.44,
"expiry": "2025-07-25",
"confidence": 65%,
"entry_timing": "Open",
"size": 1 contract
}
⸻
📊 TRADE PLAN
🔹 🔸
🎯 Strike 380 CALL
💵 Entry Price 0.88
🎯 Target 1.76 (2× gain)
🛑 Stop Loss 0.44
📅 Expiry July 25, 2025
📈 Confidence 65%
⏰ Entry Market Open
⚠️ Risk High gamma / low time (2DTE)
⸻
📉 MODEL CONSENSUS
🧠 Grok – Bullish RSI, cautious due to volume
🧠 Gemini – Momentum confirmed, weekly strength
🧠 Claude – RSI + VIX = green light
🧠 Meta – 3 bullish signals, minor risk caution
🧠 DeepSeek – RSI + volatility favorable, careful on size
⸻
💬 Drop a 🟢 if you’re in
📈 Drop a ⚡ if you’re watching this flip
🚀 TSLA 380C looks primed if we break resistance near $376
#TSLA #OptionsTrading #CallOptions #WeeklySetup #AIPowered #MomentumTrade #TeslaTrade #GammaRisk #ZeroDTEReady
Tslasignal

TSLA Earnings Play (Bearish Bias)
🚨 TSLA Earnings Play (Bearish Bias) 🚨
Earnings Date: July 23, 2025 (AMC)
🧠 Confidence: 75% Bearish | 🎯 Target Move: -10%
⸻
🔍 Key Takeaways:
• 📉 TTM Revenue Growth: -9.2% → EV demand weakness
• 🧾 Margins Under Pressure: Gross 17.7%, Operating 2.5%, Net 6.4%
• ❌ EPS Beat Rate: Only 25% in last 8 quarters
• 🐻 Options Flow: High put volume at $330 strike
• 🧊 Low Volume Drift: Trading above 20/50MA but losing steam
• 📉 Sector Macro: EV competition + cyclical headwinds
⸻
🧨 Earnings Trade Setup:
{
"instrument": "TSLA",
"direction": "put",
"strike": 300,
"expiry": "2025-07-25",
"entry_price": 2.02,
"confidence": 75,
"profit_target": 6.06,
"stop_loss": 1.01,
"entry_timing": "pre_earnings_close",
"expected_move": 7.1,
"iv_rank": 0.75
}
⸻
🛠️ Trade Details:
Parameter Value
🎯 Strike Price $300 PUT
💰 Premium Paid $2.02
📅 Expiry Date 2025-07-25
🛑 Stop Loss $1.01
🚀 Profit Target $6.06
📏 Size 1 Contract
⏱ Entry Timing Pre-Earnings
📊 IV Rank 75%
🕒 Signal Time 7/23 @ 14:14 EDT
⸻
📈 Strategy Notes:
• 🧯 IV Crush Risk: Exit within 2 hours post-earnings
• 🎲 Risk/Reward: 1:3 setup | Max Loss: $202 | Max Gain: $606+
• 🧭 Volume Weakness & put/call skew signal downside
• 🧩 Macro + Tech + Flow Alignment = Tactical bearish play
⸻
🧠 “Not all dips are worth buying — this might be one to short.”
📢 Drop your thoughts — would you take the trade or fade it?

$TSLA Weekly Call Play – 07/22/25
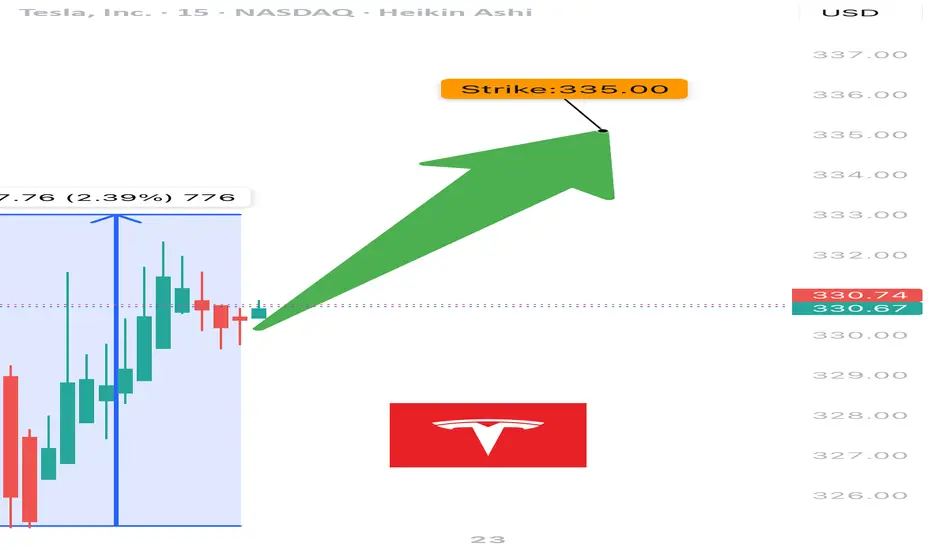
🚀 NASDAQ:TSLA Weekly Call Play – 07/22/25
RSI Bullish 📈 | Options Flow Strong 🔁 | Volume Weak 💤 | 3DTE Tactical Entry
⸻
📊 Market Snapshot
• Price: ~$332–335 (spot near strike)
• Call/Put Ratio: 🔁 1.24 – Bullish Flow
• Daily RSI: ✅ 57.6 – Rising momentum
• Weekly RSI: ⚠️ 54.8 – Neutral / flattening
• Volume: ❌ Weak – Institutional absence
• Gamma Risk: ⚠️ Moderate (DTE = 3)
• VIX: ✅ Favorable
⸻
🧠 Trade Setup
{
"Instrument": "TSLA",
"Direction": "CALL",
"Strike": 335.00,
"Entry": 9.90,
"Profit Target": 15.00,
"Stop Loss": 6.00,
"Expiry": "2025-07-25",
"Confidence": 0.65,
"Size": 1,
"Entry Timing": "Open"
}
⸻
🔬 Sentiment Breakdown
Indicator Signal
📈 Daily RSI ✅ Bullish – confirms entry
📉 Weekly RSI ⚠️ Flat – no long-term edge
🔊 Volume ❌ Weak – no institutional bid
🔁 Options Flow ✅ Bullish (C/P = 1.24)
💨 VIX ✅ Favorable for upside trades
⏳ Gamma Decay ⚠️ High risk (3DTE)
⸻
📍 Chart Focus
• Support Zone: $328–$330
• Breakout Watch: $335+
• Target Zone: $340–$345
• ⚠️ Risk Watch: Volume divergence + gamma decay on low move
⸻
📢 Viral Caption / Hook (for TradingView, X, Discord):
“ NASDAQ:TSLA bulls flash 335C with confidence, but volume’s asleep. RSI’s in, gamma’s ticking. 3DTE lotto with caution tape.” 💥📉
💵 Entry: $9.90 | 🎯 Target: $15.00+ | 📉 Stop: $6.00 | ⚖️ Confidence: 65%
⸻
⚠️ Who This Trade Is For:
• 🔁 Options traders chasing short-term call flows
• 📈 Momentum scalpers riding RSI pop
• 🧠 Disciplined risk managers eyeing 3DTE setups
⸻
💬 Want a safer bull call spread (e.g., 330/340) or risk-defined iron fly for theta control?
Just ask — I’ll build and optimize it for you.
TSLA WEEKLY TRADE IDEA – JULY 21, 2025
🚀 TSLA WEEKLY TRADE IDEA – JULY 21, 2025 🚀
🔔 Bullish Play, But Handle With Caution 🔔
Models split, but momentum wins (for now)…
⸻
📈 Trade Setup
🟢 Call Option – Strike: $332.50
📆 Expiry: July 25, 2025 (Weekly)
💰 Entry: $11.05
🎯 Target: $22.11 (100% Gain)
🛑 Stop: $5.53 (50% Loss)
🕰️ Entry Time: Monday Open
📊 Confidence: 65% (Moderate)
⸻
🧠 Why This Trade?
✅ RSI trending bullish on both daily + weekly
⚠️ Weak volume & bearish options flow (C/P ratio > 1)
📉 Institutions may be hedging into earnings
🌪️ Earnings risk looms – volatility expected
📉 Some models say no trade – we say: controlled risk, tight leash
⸻
🧨 Strategy:
🔹 Single-leg naked call only
🔹 Avoid spreads due to IV & potential gap risk
🔹 Scale out if gain >30% early-week
🔹 CUT FAST if volume + price diverge
⸻
🔥 Quick Verdict:
Momentum > fear, but don’t ignore the smoke.
TSLA 332.5C — Risk 1 to Make 2+
Ready? Let’s ride the wave 📊⚡
#TSLA #OptionsTrading #CallOption #TradingSetup #WeeklyTrade #EarningsSeason #MomentumPlay #TradingViewIdeas #SwingTrade #SmartMoneyMoves

TSLA Rebounds from $290 | Buy the Dip or Political Trap?⚠️Just when it looked like Tesla was heading for a breakdown, we got a sharp bounce off the $290 level — and traders are watching closely. But here’s the twist: the move came after a headline-heavy week featuring none other than Trump vs. Elon.
🗞️ According to Politico, tensions flared after Trump made comments suggesting EVs were "doomed without government subsidies." Elon clapped back, defending Tesla’s profitability and independence. This added pressure on TSLA... and then came the bounce. Coincidence? Or whales buying fear?
📥 Entry Zones
• $290 – Strong demand zone, tested and respected
• $275 – Deeper retest if market pulls back
• $240 – Extreme fear level, unlikely unless macro worsens
🎯 Profit Targets
• $305 – Gap-fill magnet
• $320 – Resistance test
• $355+ – If Robotaxi or AI hype returns in force

TSLA A.M. Dump IdeaHere is a bearish imuplse at close breaking structure to the downside creating a sell opportunity if price retraces back to the arrow. Simple Idea.

$Tsla will continue to go bullish after a short term pullbackNASDAQ:TSLA is in a bullish market overall speaking.
the price will probably continue to go up after this short term pullback!

Swing Trade Plan for TSLA (as of $285)TSLA has rallied from its previous consolidation zone and is approaching a potential resistance area between $290–$295. Momentum is solid, but RSI and volume trends may suggest we’re nearing short-term exhaustion.
✅ Strategy 1: Wait for the Pullback (Safer Play)
Entry zone:
• $240 – Ideal level near former resistance turned support
• $215 – Strong support with higher reward potential
Stop-loss:
• Below $200 (to protect against deeper trend reversal)
Profit targets:
• $265 – Conservative
• $290 – Re-test zone
• $355 – Bullish breakout continuation (if sentiment remains strong)
This setup gives room for the price to breathe and positions you after a healthy correction.
⚡️ Strategy 2: Momentum Breakout Trade (Aggressive)
Entry:
• On breakout above $295 with volume confirmation
Stop-loss:
• Below $280 (tight, breakout failure protection)
Target:
• $320, $340+, depending on follow-through
This is higher risk, higher reward — you’re betting on bulls continuing the charge without a pullback.
⚠️ Disclaimer: This is not financial advice. Trading involves risk. Always do your own analysis and trade with proper risk management.

Tesla is Going to 303 + Looks like Tesla is going to 303 or possibly higher
Kris/Mindbloome Exchange
Trade Smarter Live Better

Tesla Stock: Neutral Bias Persists Following Earnings ReportTesla’s stock is currently hovering near the $250 level, after a bullish gap formed following the release of its latest earnings report. Initially, the company's results fell short of expectations: earnings per share came in at $0.27 versus the expected $0.39, and total revenue reached $19.3 billion versus $21.11 billion anticipated by the market. Despite this, the stock's initial reaction was a bullish gap, fueled by brief, fleeting optimism, but the session ultimately closed with a notable indecision candle, casting some doubt on whether a new short-term uptrend is truly beginning.
Bearish Channel Remains in Play:
Despite the recent upward jump in the latest session, buying momentum has so far failed to break through the upper boundary of the descending channel that has persisted since late December. For now, this bearish channel remains the most important formation to monitor, based on recent price behavior.
MACD:
The MACD histogram is currently oscillating close to the neutral zero line, indicating that the average strength of the recent moving average swings remains largely neutral. If this behavior continues, the market may lack a clear short-term trend.
ADX:
The ADX indicator is showing a similar setup. The line continues to hover around the 20 level, which typically signals indecision in the market. This reflects a neutral tone in the current price movement, suggesting that a lack of momentum is driving a series of directionless swings. Unless the ADX line starts to rise steadily, a neutral bias may continue to dominate the stock in the short term.
Key Levels:
$220 – Key Support: This level marks the lowest point in recent months. A break below this support could reactivate the bearish channel that has defined short-term price action.
$290 – Technical Barrier: Aligned with the 200-period simple moving average, a bullish breakout above this level could pose a serious threat to the current bearish trend channel.
$330 – Final Resistance: This level is aligned with the 100-period simple moving average. If the stock reaches this area, it could confirm a shift in market momentum and pave the way for a more sustained bullish trend on the chart.
Written by Julian Pineda, CFA – Market Analyst

TSLA Weekly Options Trade Plan 2025-04-17TSLA Weekly Analysis Summary (2025-04-17)
Below is an integrated analysis of the reports and market data:
──────────────────────────────
MODEL REPORTS – KEY POINTS
• Grok/xAI – Price and moving averages on both 5‑min and daily charts are below key EMAs; RSI and MACD point to current bearish momentum. – Notable technical support at about 239.75 with resistance above near 242. – The options chain shows heavy put activity at the $240 strike (premium about 0.67), and max pain is at 245, although that level is less relevant for a near‐term (0DTE) trade. – Recommendation: Trade the TSLA $240 PUT at an ask of 0.67 at the open, aiming for roughly a 100% gain and using about a 50% loss as a stop.
• Gemini/Google – Technicals on short‐term and daily timeframes are mixed: the daily chart is clearly bearish while some 5‑min indicators hint at stabilization. – Conflicting signals (including the max pain pull toward 245 and falling VIX) result in not having a high‑conviction directional bias. – Conclusion: “No trade” is recommended today because the conflicting indicators raise the risk of getting whipsawed.
• Claude/Anthropic – Technical analysis on both 5‑min and daily confirms a moderately bearish bias (price well below major EMAs, RSI below 50). – However, one suggested trade was a TSLA $237.50 PUT at an extremely low premium (0.13) which seems less attractive given the preferred premium range. – In essence, the model sees downside potential but selected a strike a bit further out from the current price.
• Llama/Meta – A moderately bearish setup is noted, with the technical picture similar to the others on very short‐term charts. – However, the model also flags the influence of max pain at 245 and concludes that a naked call (for example, at the $240 or $242.50 strike) could profit if the upward “max pain pull” works in play. – Ultimately, this view contrasts with the put trades favored by others.
• DeepSeek – Confirms the overall technical picture: price is below key averages, with bearish momentum evident on both 5‑min and daily charts. – Emphasizes the high open interest on $240 puts and the near-term support at 239.75. – Recommends buying the TSLA $240 PUT at its 0.67 ask price for this weekly (0DTE) option. ────────────────────────────── 2. AREAS OF AGREEMENT AND DISAGREEMENT
Agreements: – Most reports note that TSLA is trading in a moderately bearish state with price below the relevant moving averages and key support levels near 239.75. – There is broad recognition that options activity is concentrated around the $240 strike—especially on the put side, where volume and open interest are very high, underscoring bearish positioning. – Technical indicators (RSI, MACD, Bollinger Bands) on short‑term and daily charts lean toward bearishness despite some very short‑term signals of stabilization.
Disagreements: – Gemini/Google sees too many conflicting signals (including the upward pull implied by max pain) and hence recommends no trade, while the majority of the other analysts view the setup as tradeable. – Llama/Meta is open to trading a naked call (capitalizing on the max pain influence) whereas Grok/xAI, DeepSeek, and to a lesser degree Claude/Anthropic advocate for a bearish put trade instead. ────────────────────────────── 3. CONCLUSION & TRADE RECOMMENDATION
Overall Market Direction Consensus: Most opinions point to a moderately bearish bias for TSLA on a near-term, 0DTE weekly horizon. Even though conflicting signals (like max pain toward 245 and some stabilization on very short timeframes) introduce uncertainty, the weight of the technicals and put side open interest lean toward downside pressure.
Recommended Trade: Trade a single‑leg, naked PUT (weekly option) on TSLA.
Trade Parameters: – Instrument: TSLA – Strategy: Buy a TSLA $240 PUT – Expiration: 2025‑04‑17 (weekly, 0DTE) – Premium: Approximately $0.67 per contract (slightly above the preferred range, but justified by high liquidity and clear technical support) – Entry Timing: At the open – Profit Target: Around 100% gain from the entry premium (i.e. exit near a $1.34 premium) – Stop‑Loss: Roughly a 50% loss at about $0.33 per contract – Confidence Level: Approximately 65% – Key Risks & Considerations: • The mixed signals (especially Gemini’s caution and the max pain theory) mean price could quickly reverse if TSLA rebounds near 245. • Very short‑term trading (0DTE) carries risks related to rapid time decay and volatility spikes. • A failure to break important support (around 239.75) would warrant an early exit. ────────────────────────────── 4. TRADE_DETAILS (JSON Format)
{ "instrument": "TSLA", "direction": "put", "strike": 240.0, "expiry": "2025-04-17", "confidence": 0.65, "profit_target": 1.34, "stop_loss": 0.33, "size": 1, "entry_price": 0.67, "entry_timing": "open" }
Disclaimer: This newsletter is not trading or investment advice but for general informational purposes only. This newsletter represents my personal opinions based on proprietary research which I am sharing publicly as my personal blog. Futures, stocks, and options trading of any kind involves a lot of risk. No guarantee of any profit whatsoever is made. In fact, you may lose everything you have. So be very careful. I guarantee no profit whatsoever, You assume the entire cost and risk of any trading or investing activities you choose to undertake. You are solely responsible for making your own investment decisions. Owners/authors of this newsletter, its representatives, its principals, its moderators, and its members, are NOT registered as securities broker-dealers or investment advisors either with the U.S. Securities and Exchange Commission, CFTC, or with any other securities/regulatory authority. Consult with a registered investment advisor, broker-dealer, and/or financial advisor. By reading and using this newsletter or any of my publications, you are agreeing to these terms. Any screenshots used here are courtesy of TradingView. I am just an end user with no affiliations with them. Information and quotes shared in this blog can be 100% wrong. Markets are risky and can go to 0 at any time. Furthermore, you will not share or copy any content in this blog as it is the authors' IP. By reading this blog, you accept these terms of conditions and acknowledge I am sharing this blog as my personal trading journal, nothing more.

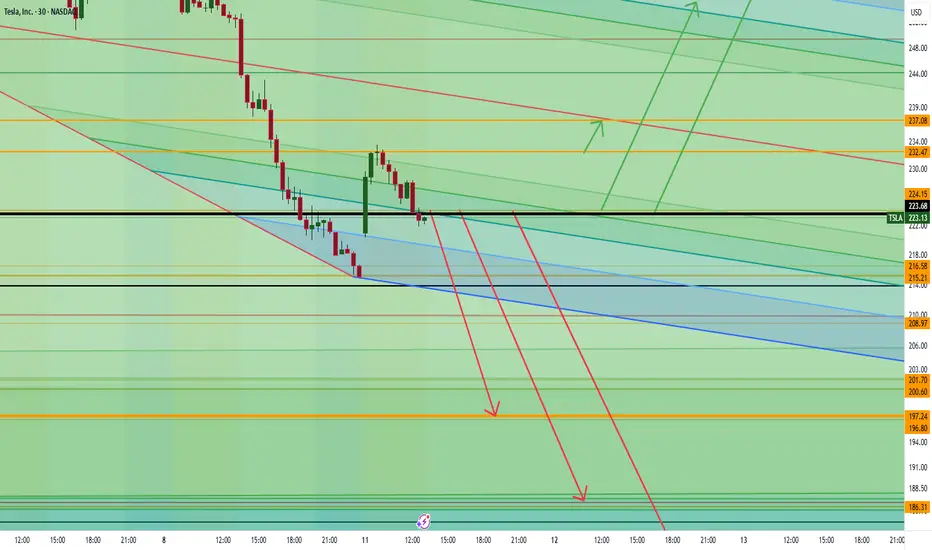
Tesla is About to Collapse… or Skyrocket—Are You In?Tesla is all over the news with boycotts, drama, and market chaos, but the real action is on the charts. If we break below 222, things could get ugly fast with a drop toward 197, 186, and even 176. But if we hold above 223, momentum could send us flying past 232, 237, and potentially 256 or even 264.
Big money is watching, and the next move could be massive. The question is—are you trading this or just watching from the sidelines?
Kris/ Mindbloome Exchange
Trade Smarter Live Better
Tesla at a Crossroads: $257 or a Dive to $242? Alright, Tesla fam—big decision point ahead. Do we hold $257 and drop to $242, or are we about to rip to $280 and start pushing for higher highs? Either way, something big is brewing. How are you playing this?
Kris/Mindbloome Exchange
Trader Smarter Live Better

TSLA’s Next Big Move: Collapse or Skyrocket? Key Levels to WatchTesla (TSLA) is approaching key price levels that will determine its next move.
Potential Downside:
-If TSLA drops below $297, the next level to watch is $292.
-A break below $292 could lead to $283.
-If $283 fails, the price may drop significantly toward $222.
Potential Upside:
-If TSLA reverses, it could rise back to $384.
-A breakout above $384 could push it to $431 and beyond.
If this analysis added value to you, please like and share!
Kris/Mindbloome Exchange
Trade Smarter Live Better

Quick 4-Min Tesla Analysis: Deeper Pullback or Ready for LiftoffJust wrapped up a quick Tesla analysis (under 4 min)! Right now, we could see a dip to the $289 zone before pushing higher, or a deeper move down to $250 before driving up toward $475.
Where do you think Tesla is headed next? Let me know your thoughts!
Kris/Mindbloome Exchange
Trade Smarter Live Better

Under 3-Minute Deep Dive Into Tesla (TSLA) – Big Move ComingTesla just pulled back to $320 on the weekly chart, and this is where things get interesting. If buyers step in, we could see a strong push to $370, and if that breaks, $397 and even $417 are in play.
But here’s the flip side—if Tesla loses $320, things could unravel fast, and $250 might not be far off.
I’m watching this level closely because the next move could be huge.
Kris/Mindbloome Exchange
Trade Smarter Live Better

Tesla Update: Navigating the Road to $440Morning Trading Family
Tesla's journey is heating up as we aim for the $440 target. But buckle up, because we've got some resistance zones to watch:
First Stop: $427 - This could be where the ride gets a bit turbulent. Expect some market reactions here.
Next Challenge: $435.35 - Another potential bump in the road. Will we see a correction, or will Tesla's momentum carry us straight through?
The depth of any correction at these levels is still up in the air, but keep your eyes peeled. If the market punches through these resistances, $440 might just be in our sights sooner than expected!
If you found this useful: boost, share, like, and comment. I appreciate all the support! If you're struggling as a trader, I get it - I've been there myself. Jump in, send me a DM or head to my profile; I'm more than happy to help.
Kris/Mindbloome Exchange
Trade What You See

What’s Next for Tesla: $440 or $340?Good Morning, Trading Family!
Here’s the plan: if Tesla moves up to $398 and breaks above it, we could see it head to $440. But if it starts to drop, it might go down to $374 and bounce back up. If it falls below $374, we could see it drop further to $340.
This Sunday, I’m hosting a webinar about how emotions can hurt your trading and how to stay in control.
Send me a message or check my profile for more info. If this analysis helped, like, comment, and share it with others.
Kris/ Mindbloome Exchange ( ME)
Trade What You See

Tesla’s Next Move: $425 or $420 – Which Way Will It Break?Morning Trading Tesla is gearing up for a big move, and all eyes are on $425 and $420. These levels are the key to figuring out where the stock is headed next. Let’s break it down so it’s easy to follow.
If Tesla Breaks Above $425
This is where the bulls could take control. Here’s what to watch:
$439: First stop. If we clear this, it’s a sign of strength.
Above $439: Things could really heat up. Long trades make sense here as Tesla could climb higher.
If Tesla Breaks Below $420
The bears might step in, and we’ll be looking for lower levels. Watch these zones:
$417: The first area where buyers might show up.
$402: A deeper pullback, but still within range for a bounce.
$394: A critical level—if this breaks, we could see more selling.
$374: The big one. If it gets this low, it’ll be a major area of interest.
Here’s the Game Plan
Keep it simple: Watch $425 and $420. If one of these breaks, it’ll give us a clear direction. Don’t forget to plan your trades, set stop-losses, and stick to your strategy.
If you enjoyed this breakdown, give it a follow or a like. Got questions about Tesla, other charts, or feeling stuck with trading? Send me a DM—I’d love to help!
Struggling with burnout, trading stress, or figuring out how to stay consistent as a trader? Reach out. I’m here to help you stay balanced and build a sustainable trading mindset.
Kirs/Mindbloome Exchange
Trade What You See

Tesla at the Crossroads: Breakout to $522 or a Slide to $420?Tesla’s price action is heating up as it hovers between $452 resistance and $441.54 support. A breakout above $452 could ignite a rally toward $522, while a breakdown below $441.54 might signal a drop to $420 or lower. This is the moment to stay sharp—will Tesla soar or stumble? Let’s dive into the key levels, actionable tips, and what to watch for next!
Any questions about this chart or any others send me a message
Kris/Mindbloome Exchange
Trade What You See

Sliding In December: Is Tesla (TSLA) Losing Its Spark?
As always, we like to keep it clean and simple, with technicals and analysis that's easy to see and understand. Let's get into it:
Losing all its spark? Nah. But, we see a correction for TSLA happening this December, starting within the next 1-2 days. Why?
- It’s currently bumping into price levels we last saw in 2022, which served as a strong ceiling back then and might trigger profit-taking now.
- It's well into a Wave 5 Elliott Wave, signaling exhaustion in 4h/8h/1D timeframes.
- Overbought.
Additionally, many are noting that Tesla’s valuation feels stretched compared to its earnings and growth prospects. Analysts point out that its current price may rely on overly optimistic assumptions about future market share, tech breakthroughs, and profitability. Some also highlight that competitors are catching up, which could eat into Tesla’s premium valuation. Meanwhile, skeptics argue that the stock’s recent run has simply gotten ahead of fundamentals, and a correction might be due as more realistic expectations set in.
We see a 10% slide to the $360 range.
Let's see what December brings.
Be Alert.
Trade Green.

Tesla at a Critical Pivot – What’s the Next Move?Hey trading family, Tesla’s chart is heating up, and we’ve got some key levels to keep on our radar. Here’s how it’s shaping up:
Break below $338: A drop to $334 is likely, with potential to bounce back up from there.
Deeper drop: If we go lower, watch for a move toward $326, followed by a possible push upward.
Break above $348: If Tesla clears this high, we could target $361 and potentially even higher levels.
Tesla’s setup has a lot of potential both ways. What’s your plan if we dip or if we rip higher?
👉 Like, comment, and share your insights below! Got questions or your own analysis? Send me a DM – let’s connect.
Mindbloome Trading // Kris
Trade What You See.

Tesla’s Power Move: $300 Broken, $322 in SightUpdate:
Good morning, trading family. It’s your guide, Mindbloome Trader, here to remind you to trade what you see.
Tesla has broken through $300 and is holding strong. If it keeps this momentum, $322 is a realistic target. However, if it slips below $300, it could just be pausing before its next move.
Stay patient, follow the trend, and trust the process. Let the market show you the way.
Mindbloome Trading/ Kris
Trade What You See
