Tslasignal

TSLA Split $ we need to hold above our current support 840$+, in order to retest the resistant around 947$, and have our breakout and squeeze over the 1000$+, before the split in 2 weeks from now .

$TSLA bulls is back!$TSLA stock climbs after beats its earnings expectation few days ago and continue to soars after fed meeting. No major news about the pipeline just pure technical breakout.
as for the chart pattern, TSLA is making lower high and i expect TSLA will pull back tomorrow, before is starts to push to high again.
here my price target for $TSLA for monday 08/01/22.
============================================================
For calls; buy above $911 and sell at 935 or above
For puts, buy below 880.89 and sell at 874.18 or below
============================================================
Welcome to this free technical analysis . ( mostly momentum play )
I am going to explain where I think this stock might possibly go the next day or week play and where I would look for trading opportunities
for day trades or scalp play.
If you have any questions or suggestions on which stocks I should analyze, please leave a comment below.
If you enjoyed this analysis, I would appreciate it if you smashed that LIKE button and maybe consider following my channel.

TESLA SHORTHi there,
Tesla has been pumping up recently.
Tesla has reached the top channel and resistance. If it breaks through channel top resistance then bulls are here.
I am looking for short so check it out and let me know what you think
thanks

TSLA turning point in growthTSLA turning point in growth
new time to look for a buy entry point
buying from the lower border of the descending conal Time to buy a new model)))

TSLA Bttom Support we dipped below the strongest support the 700$, however we close 1D candle over the 700$, that show us the strength of that support , if we want to make this our bottom , we need to hold above the 700$ and test again the current RS around the 833$, cause if we have 1D candle below 700$ SP , we will see a new support test above the 550$.
and still the 947$ is the bullish confirmation for TSLA if we close 1D candle above and hold .

$TSLA - Bullish Pennant Setup, Imminent BreakoutGreat Buy Signal at the bottom of pennant with Stock RSI in oversold territory. Coiling into imminent breakout to the upside intact. $1,500-1,800 price objective per upward channel by EOY.

TSLA reversal zone we still holding above our strong support which is the 947$, and above our EMA, continuation and holding above this support will confirm the bullish momentum, and retest for the squeeze area near the 1200$.

TSLA Bull-run continuation we have one Resistant lift at 1200$, which will be another breakout, and seeing all time high for tsla, but we expect a bit of fighting back from the short around this area , but we need to hold our first support to confirm the strength of our trend , other wise we will go back to the second support .
holding above the 1200$ will confirm the bull-run contention for tsla .

TSLA Major dump / shortTSLA is on an aggressive down trend from the weekly down. The daily is the main point of entry which was missed at $876.90 that started the overall trend, we then focus on and the weekly as the overall "tp" ... please do your own analysis.

Tesla Analysis 13.02.2022Hello Traders,
welcome to this free and educational analysis.
I am going to explain where I think this asset is going to go over the next few days and weeks and where I would look for trading opportunities.
If you have any questions or suggestions which asset I should analyse tomorrow, please leave a comment below.
I will personally reply to every single comment!
If you enjoyed this analysis, I would definitely appreciate it, if you smash that like button and maybe consider following my channel.
Thank you for watching and I will see you tomorrow!

$TSLA - Bullish Inverse Head & ShoulderChart is setting up for a major breakout with a clear Inverse Head & Shoulder pattern. This is a Bullish Pattern. Great buying opportunity.

Tesla Analysis 08.01.2022Hello Traders,
welcome to this free and educational analysis.
I am going to explain where I think this asset is going to go over the next few days and weeks and where I would look for trading opportunities.
If you have any questions or suggestions which asset I should analyse tomorrow, please leave a comment below.
I will personally reply to every single comment!
If you enjoyed this analysis, I would definitely appreciate it, if you smash that like button and maybe consider following my channel.
Thank you for watching and I will see you tomorrow!

$TSLA - Bullish F FlagChart is showing a bullish F Flag setting up, great buy point at lower flag for a breakout.

$TSLA short term extended, backtest of 1000 expected$TSLA is extended in the short term up over 300/share in 4 days, much of this is weekly call buying. We saw a lot of that fade away today with bearish bets increasing to end the week. Puts off the open, first target is 1070 (we might open at this level in pre market). Below 1070 looking for selling to speed up and take us to the 10 day target towards eow.

TSLA BREAKOUTTSLA confirmed a breakout on Friday Close
Breakout from 10 Month Long Base
Price is in strong uptrend since MAY (Lower Highs)
Strong earnings helped the breakout

TSLAHello. Due to the negative divergence in the weekly time frame and the formation of the weekly candle, it is predicted that the correction will continue

TSLA (TESLA) LONG SET UP (GAP FILLED)BUY TSLA at $932.00
Take Profit 1- $1000.00
Take Profit 2- $1090.00
Take Profit 3- $1190.00
Take Profit 4- $1243.00
Support: $940.50-$930.00/ $909.00/$860.00/ $830.00 / $780.00-$780.00
Resistance: $980.00-$1000.00/$1078.00/ $1115.00/ $1196.00/ $1245.00

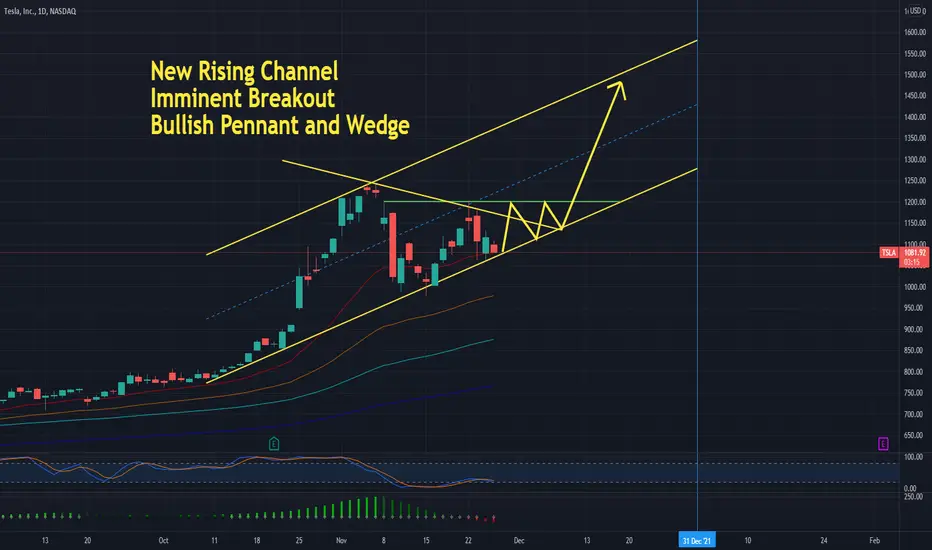
$TSLA - New Rising Channel with Imminent BreakoutNew wedge is forming with Bullish Pennant setting up for an imminent breakout. Great buying opportunity.
$TSLA - Bullish Penant SetupTesla Stock has formed a bullish pennant. It is currently consolidating and coiling through, looking for a imminent breakout in the near term.

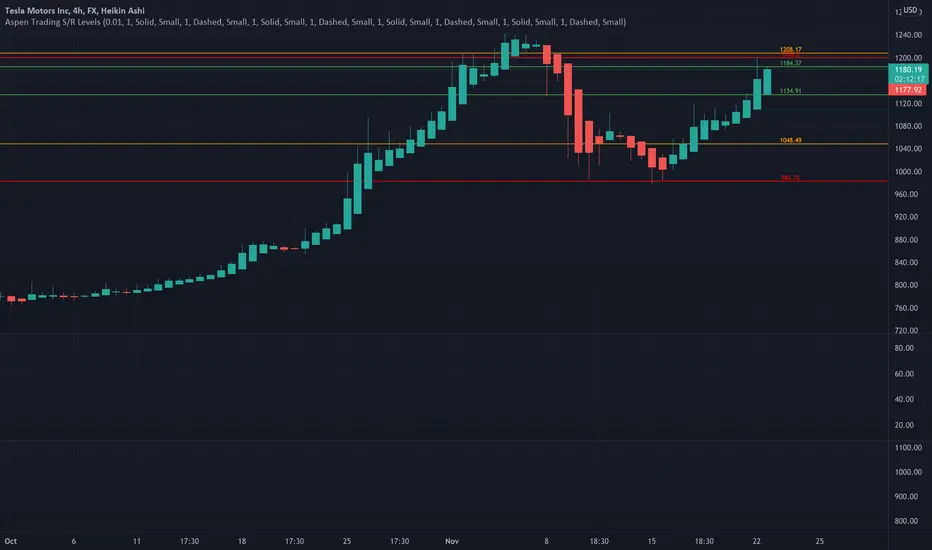
TSLA had a beautiful bounce from support Using Aspen Trading Support & Resistance Levels, TSLA has bounced from 982 support and can face the resistance at 1208.
A move above 1208 level will see further upside to TSLA.
Note - Aspen Trading S/R levels are invite only. They can be accessed through my profile information.
Disclaimer: This analysis is for information purpose only and does not constitute any investment advice.
TSLA 4H NEAR FUTURE PREDICTIONTechnical Analysis Summary
TSLA/USD
TREND ANALYSIS
We have 1 down trend which is currently active in red
We have1 down trend in red that has already been broken and thus the reversal
FUTURE PREDICTIONS
We have many resistanse and support levels that I have mentioned above.
I use thickness as an indicator of stregth of levels (ONLY FOR VISUALS).
Good luck everyone, stay safe!
If you need help don't hesitate to send me a message or comment
Trading Involves High Risk
Not Financial Advice
Exercise Proper Risk Management

TSLA matters a lot to the overall market Using Aspen Trading Support & Resistance Levels, a move below 978 is going to break the support and things can get ugly really quickly from that point for TSLA.
The overall market can also get impacted if the 1.2 trillion market cap of TSLA shrinks in size.
Please provide your feedback in comments if you like the analysis.
Note - Aspen Trading S/R levels are invite only. They can be accessed through my profile information.
Disclaimer: This analysis is for information purpose only and does not constitute any investment advice.
