INVERSE CUP AND HANDLE $TSLA TO $120 The inverted cup and handle, also known as the upside-down cup and handle pattern, is a bearish chart formation that can occur in both uptrends and downtrends. Unlike the traditional bullish cup and handle pattern, this inverse pattern features two key components: the "cup," which forms an inverted U-shape, and the "handle," a brief upward retracement following the cup.
Sell NASDAQ:TSLA right now with fact check:
brand reputation risk, high competition, loss of EV market leadership, cyber truck/ product recalls, declining sales with lower margin, stock volatility concern, insider selling, investors buy it based on expected future earnings rather than its current profitability.
+ Head and shoulder/ inverse cup and handle, P/E ratio 79.8-161.23 (overpriced), falling knife, dead cat bounce, the lowest target estimate stands at $120.00, below the 50-day, 100-day, and 200-day moving averages, MACD indicator is -19.8, bearish signals.
+ potential stagflation, tariff war, slow economic growth, inflation, rising public debt, geopolitical tensions, ai bubble, and more
TSLQ

OH NO GUESS WHAT I FOUND $TSLA HEAD AND SHOULDERThe head and shoulders pattern is a chart formation in technical analysis that signals possible trend reversals, often suggesting a change from a bullish to a bearish trend. It features three peaks: a central "head" that is the highest, flanked by two "shoulders," with a neckline connecting the troughs between these peaks.
Tesla's stock is often viewed as a risky investment for several reasons:
High Valuation: NASDAQ:TSLA stock price is considered very high compared to traditional car manufacturers, with a much higher price-to-earnings ratio.
Market Volatility: The NASDAQ:TLSA price is highly volatile, influenced by factors like CEO Elon Musk's public comments, regulatory changes, and overall market sentiment.
Intense Competition: The electric vehicle market is becoming more competitive, with many established and new companies investing heavily in EV technology.
Production Issues: Tesla has experienced production and supply chain challenges, which can affect its ability to meet demand and maintain profitability.
Regulatory Risks: Changes in government policies and regulations, especially those related to environmental standards and EV incentives, can significantly impact Tesla's business.
While these points highlight potential risks, Tesla also has strengths such as strong brand recognition, technological innovation, and leadership in the EV market. It's important to consider both the risks and potential rewards when evaluating Tesla as an investment.
SELLL NOW!!!!!

**TSLA Short ETF** $TSLQ Daily Chart (Bearish Scenario) **TSLA Short ETF**
NASDAQ:TSLQ Daily Chart (Bearish Scenario) : For educational purposes only, NFA.
#1: Price below daily 9 EMA
#2: Daily forming Bearish expanding triangle, which is bearish reversal pattern.
#3: Bearish Divergence on daily RSI, which is also a reversal signal.

$TSLA Daily Chart(Bullish Case) : For educational purposes only,NASDAQ:TSLA Daily Chart(Bullish Case) : For educational purposes only, NFA.
#1: Price above daily 9 EMA
#2: Daily forming Bullish expanding triangle , which is bullish reversal pattern.
#3: Bullish Divergence on daily RSI, which is also a reversal signal.
**This week I am expecting good news about NASDAQ:TSLA and Analyst rating upgrades that will set the narrative for this reversal.**

$TSLQ - $13.95 Short Term Technical PTMassive bearish Head AND Shoulder formation with a crack below neckline. length of head to neckline = projected drop to downside. Technical Price Target of around $13.95.

TSLA Support & Resistance Guide | Looking to gap fill |- TSLA looking to fill its upper gap
- if we do fill gap looking back to test 186 resistance level
- if QQQ can break to new recent highs than it TSLA will have a good chance to test 186

TSLA Weekly Outlook Which Gap to Fill | NASDAQ at Key Resistance- TSLA trading in between 2 large gaps
- which gap it will fill will likely be determine by which way NASDAQ will move to
- NASDAQ & SPX closed right under Key Resistance
- if we fill the above gap then we are looking back at 186 resistance

$TSLA Weekly Downtrend Confirmed, $QQQ S&R Analysis - NASDAQ:TSLA broke weekly support confirmed weekly downtrend
- TSLA gap could be filled if we broke todays low of support
- NASDAQ:QQQ bounced off of megaphone pattern support still trading within
- QQQ likely break out of the range next week Tuesday 25th after big tech & MSFT reports earnings.
- Still holding onto my SOXS position
- check out my video from yesterday for big tech analysis key resistance

TSLA Earnings Report Price Action breakdown | Weekly Support |- NASDAQ:TSLA Weekly support $163.91
- currently a 15m bear flag after hours after earnings.
- now in a daily down trend
- next strong support zone in the $166s
- im currently not in the stock my after breaking out of the equilibrium (teal looking wedge) its favoring the bears at the moment.

TSLA Price Action Outlook into Earnings Wednesday AH- NASDAQ:TSLA likely trading sideways into earnings
- 186.19 area is key resistance, need to close above it.
- NASDAQ:QQQ also near resistance if it reject it will likely drag TSLA down and vice versa

TSLQ | Tesla Bear ETF | LONGUnder normal market circumstances, the adviser will maintain at least 80% exposure to financial instruments that provide inverse exposure to the daily performance of TSLA. The fund is an actively-managed exchange-traded fund ("ETF") that seeks to achieve on a daily basis, before fees and expenses, -100% performance of TSLA for a single day, not for any other period, by entering into one or more swap agreements on TSLA. The fund is non-diversified.

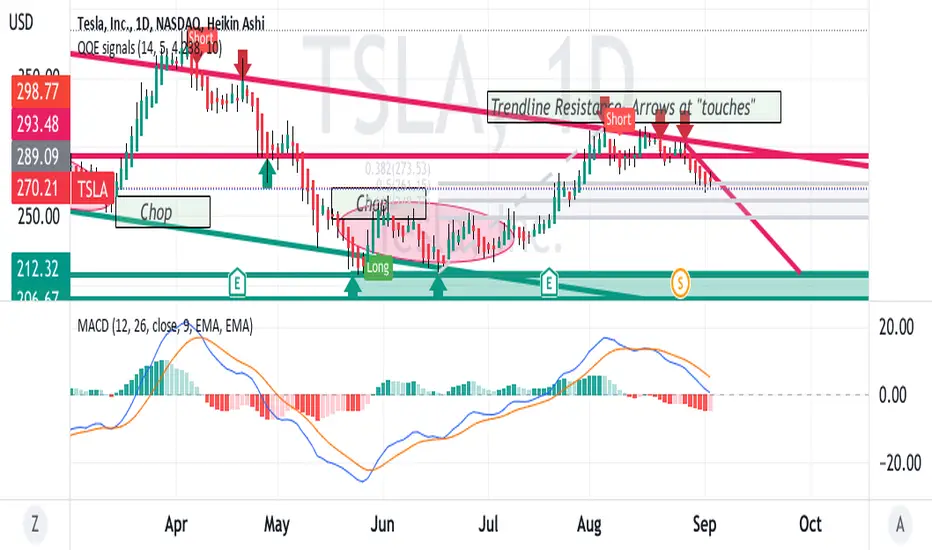
TSLA looking weak SHORTTSLA is continuing to trend downward while China is melting down
and the TSLA giga factory is underproductive.
The chart shows a fall from the upper trendline of resistance
confirmed by the MACD lines flipping above the histogram.
Targets for the trade are the mid-range Fibonacci levels in the
retracted of the up trend so about 258 and final take
profit heading towards all earnings where the current trendline
hits the horizontal support at about 205 about October 1st.
Stop Loss nominally at $10 above the current market price.
Accordingly expecting a reward to risk of more than 5 to 1.
All in all, the short setup or put options appear to be
an excellent setup,
The best question is whether others in the sector are
following the market leader and dropping even faster or
instead, are they holding up better because they have
less China exposure