ASML: Dominating the industry 💾ASML Holding N.V. is a holding company based in the Netherlands. The Company operates through its subsidiaries in the Netherlands, the United States, Italy, France, Germany, the United Kingdom, Ireland, Belgium, South Korea, Taiwan, Singapore, China, Hong Kong, Japan, Malaysia and Israel. The Company operates through one business segment which is engage in development, production, marketing, sales, upgrading and servicing of advanced semiconductor equipment systems, consisting of lithography, metrology and inspection systems. The Company offers TWINSCAN systems, equipped with lithography system with a mercury lamp as light source (i-line), Krypton Fluoride (KrF) and Argon Fluoride (ArF) light sources for processing wafers for manufacturing environments for which imaging at a small resolution is required. TWINSCAN systems also include immersion lithography systems (TWINSCAN immersion systems).
ASML's lithography systems use a process called photolithography to create intricate patterns on silicon wafers, which are then used to create integrated circuits, memory chips, and other semiconductor components. These patterns are created using a process of etching, deposition, and other techniques that require precise alignment and control.
ASML's customers are primarily semiconductor manufacturers such as Intel, Samsung, TSMC, and GlobalFoundries. These companies use ASML's lithography systems to create the most advanced microchips on the market. ASML's customers are some of the largest and most influential players in the semiconductor industry, and they rely on ASML to provide them with cutting-edge technology that enables them to stay ahead of the competition.
ASML's business model is based on a high degree of innovation and research and development. They invest heavily in R&D to continually improve their technology and maintain their market leadership. Additionally, they operate on a capital-intensive model, where the cost of producing their lithography systems is high but the revenue potential is also significant.
Overall, ASML's business model is centered around developing and selling advanced lithography systems to the world's leading semiconductor manufacturers, which requires a high degree of technological innovation, R&D investment, and capital-intensive production processes.
There are other companies that offer lithography systems for the semiconductor industry, such as Canon, Carl Zeiss, and Ultratech, but they do not directly compete with ASML in the advanced lithography segment of the market. These companies generally offer less advanced lithography systems that are used for less complex microchip manufacturing applications.
ASML's main customers are some of the largest semiconductor manufacturers in the world. These companies use ASML's lithography systems to manufacture advanced semiconductor chips for a wide range of applications, including smartphones, computers, servers, and other electronic devices.
Some of ASML's key customers include:
- TSMC (Taiwan Semiconductor Manufacturing Company)
- Samsung Electronics
- Intel Corporation
- SK Hynix
- Micron Technology
- GlobalFoundries
- UMC (United Microelectronics Corporation)
- STMicroelectronics
- Toshiba Memory Corporation
- Nanya Technology
With the underlying business performing so well over the years, its no surprise to see the stock has followed suit. Since 1996, ASML has returned +23.38% CAGR compared to +9.02% for SPY
At this rate of return HKEX:10 ,000 invested in ASML back in 1996 would have grown to over HKEX:3 million!
The strong market position and outlook for the business make me believe that the company will not be slowing down any time soon, and even at a valuation of 36x earnings I think this is a business trading at a fair value.
I have added this to my portfolio which you can check out here ⬇️
www.etoro.com
TSM

NVDIA - Expect Sideways Until Bear Puts Expire WorthlessEver since NVDIA went up after its February earnings call, it seems that social media traders have been afflicted with a fetish for trying to short it. There's all sorts of fundamental reasons, they say, such as NVIDIA is trading at blah blah times P/E, AI doesn't actually need chips beyond the initial machine learning phase, and of course the top reason that everything should be bearish: the Federal Reserve isn't pivoting!
None of that matters. One of the biggest pieces of wisdom I can share with you is that fundamentals do not matter in the way that you're led to believe that they matter. If the markets really worked that way, then there would neither be bubbles nor would there be undervalued stocks. If everything algorithmically traded in line with what "it was truly worth" you would have no opportunity at all to make (lose) any money, would feel bored with the computer, and would go outside.
The fundamentals to the market at large right now, including with the recent collapse of regional banks and Silicon Valley Bank, is that everything in this world is revolving around "relationships" that companies, people, organizations, and communities have established with Xi Jinping and his Chinese Communist Party. This especially includes what happened during the Coronavirus Disease 2019 pandemic and the world's response to the disease.
Too many people have, for the sake of the economic and recreational benefits that the Chinese Government has offered, imported the CCP's cultural revolution stuff back home. And yet, the CCP under the Jiang Zemin faction is guilty of almost 24 years of persecution against the 100 million practitioners of Falun Gong meditation, which involves the unprecedented crime of live organ harvesting as a form of torture (Kilgour-Matas Report).
And the result is a lot of business and social practices have developed under the Party's method that amount to cancers festering in the world's body. If you want to get rid of a cancer, you have to not only cut it out, but get rid of the root cause and the behaviors and habits that give the disease the environment it needs to lump around.
The thing about NVIDIA is that it has a story. Stories matter more than fundamentals in the short term. In the long term, fundamentals matter more than stories. This is because a small group of whales needs a pretext in order to bait in a large number of fish and a moderate amount of sharks to feed on, and this operation is a short to midterm play that revolves around the longer term fundamentals, which cannot be avoided.
NVIDIA's story is that there's a cool Chinese guy with grey hair running the company wearing a leather jacket. He says that he can sell a lot of chips right now and quickly exceed the very worthless crypto mining boom because GPT4 and STABLE DIFFUSION and the AI REVOLUTION need GRAPHICS CARDS more than rich kids need $1,800 graphic cards to be addicted to video games instead of having jobs and girlfriends.
Well, I'm a price action trader. I think the charts show the truth of the markets and their combined understanding and the candles reflect the operation in play. Zoom out, is what they always say:
NVIDIA on the monthly, when it dumped in October, took out a long term low from 2021.
Taking out a low all on its own doesn't mean much, but my friends, when a highcap takes out a big low AND THEN ALSO bounces 74% over the next three months, and instead of heading towards making new lows, goes ahead and makes a new high the next month, why are you shorting something that's going up?
Look at this pattern on the weekly and ask yourself what you really find appealing about buying puts on this besides hearing all the rabble in signal groups and on social media yell about HOW OVERPRICED this stock is and how IT SHOULD GO TO ZERO. IT'S GOING TO ZERO.
And even more so now with NVDIA closing at ~$270, this is the worst time to trade it. You've already missed the boat to go long, and going short has destroyed a lot of accounts.
You're at the apex of an inflection point, and the scenarios on both sides are very simple:
1. If it's bearish, then the MM is short from the early '22 pivot parked under $300, and bears are about to get what they want.
2. But that pivot is right under the $300 psychological level where big short positions now have their stops
3. If NVDIA is truly bullish, it will take out that pivot, sweep $300 and then is likely to retrace
4. But for bears, it doesn't make sense to give them a way out and retrace like that.
5. Thus, the most annoying thing the MM can do is to park price in this $255-275 range for several weeks and kill everyone's put and call premiums while selling the contracts
6. This means no retrace. Instead, when everyone's lost all their money going short, and it doesn't dump and NVDIA does go over $300 in May or June, price doesn't look back and sets a new all time high
7. Bears bamboozled and in disbelief about how a tech stock can set a new ATH during FEDERAL RESERVE RATE HIKES
If you want to make money in trading, you need to put risk management at the top of your priority list.
What's really implied by this is that you stop gambling. The way you stop gambling is by changing your heart and your intentions in trading. You have to stop wanting to get rich. If you try to change your life with gambling then you will, as a result, ruin your life. Literally everyone knows this and yet people still try to make their lives "happy" through gambling.
What you're trying to so is solidly and systematically increase your account on a compounding basis. To do this, you need winning trades and not losing trades. To do this, this means you need less trades, because let's be honest, most of your trades are losers.
In order to achieve all of the above, you need to quit listening to influencers and Discord and Telegram signal groups, delete the Marxist social influencing website Reddit, and start thinking for yourself.
You have to understand that a lot of these people do not trade themselves. They make their money grifting you for subscriptions and from behind the scenes for pushing certain things on their followers. You think from looking at how they talk and how they act and what they say that they're making a lot of money and are very successful, but almost all of them are either total frauds or losing traders.
Stop looking up to "heroes." There are no heroes. There's just you and your life, and you're in a very harsh and adversarial environment where the moral standard is very low and the people around you have very, very poor values. You need to make sure that your moral standard is high and that you have values and ideals that you can stand in front of your grandchildren with and hold your head high.
Also, genuine winning traders are both few and far between, and generally do not carry a high profile. People who have survived in the markets for a while also understand both how easy it is and how painful it is to lose money. They understand how hard money is to get it back once it's been lost. And thus, they aren't out there cowboying around.
You shouldn't listen to what I tell you either, because you need to think for yourself.
If you don't get sober and rational now, then when this world really changes as the Chinese Communist Party falls, a day which is extremely, extremely close, you won't have a chance to make it through the tribulation, because the requirement to pass through is that you have clean hands, a clean heart, and have chosen a bright future for yourself.

Intel Corporation - Buy the Raid, Ride the WaveSemiconductors were supposed to be the "21st century oil," but they aren't. Whoever believed that was really not rational. Because oil is for heating stuff, making plastic, and fueling vehicles, while computers are just computers are just computers are just computers.
Intel has not been bullish, only trading within a $6 range since October. A lot of other tech/Nasdaq stuff has been a lot more interesting to trade, but I personally like these companies that are in the low double digits and usually don't do insane things in one day, because the premium and spread for the options market is usually much more sane, and risk management is really the most important thing.
Plus, once these kinds of equities go, they tend to surprise well and are a lot better than gambling on if you can catch the latest 10% day on Tesla (you won't. Mastodon's socialists told you ELON MUSK BAD).
Anyways, I am expecting that markets at large will bear trap in and around the beginning of February and FOMC. The next FOMC is 6 weeks away in the third week of March, which gives a lot of time to head fake and take traders in the direction they like seeing the least right now (up).
Thus, based on Intel's price action post-earnings after missing EPS estimates by 50% and yet only dumping $1.50, that the market makers' intention is to gun the October low.
I believe you can buy $23.50-$25 in anticipation of a marketwide pump that will ultimately prove to be an exit pump designed to unload bags, fill banks' "big short" strategy, and totally destroy the existing short sellers in the market, heading into roughly May and July of this year.
Intel's long term price action is prime for this, as we have a large volume gap spanning 7 years in the $42 to $37 range, most evident on the monthly.
You may not see another run below the $24.87 low, since it was taken months ago.
But since Intel has yet to bounce, but has also proven to not actually be very bearish, a raid below the lows seems more likely than not.
The problem from a risk perspective is that a raid may not really be a raid. Intel can just be on its way to $0, but at the same time, the company really is the biggest processor manufacture for all the computers normal people use, and is "only" market capped at present at $116 billion.
Rival Taiwan Semiconductor TSM has a similar breadth pattern, but never took a previous low, and has bounced vigorously into a volume gap of its own from 2021.
Right now, the world is not okay. The pandemic situation in China with Wuhan Pneumonia is countless times more dire than mainstream media and social media are leading you to believe. It's really serious, as many individuals, corporations, and governments are tightly wed to China.
But unfortunately, many of those weddings weren't with "China" but the heinous and unforgivable "Chinese Communist Party."
The situation in this world can change overnight and all long trades have significant risk of total liquidation, no matter the appearance.
Make sure you take good care of yourselves and your families. Remember, money is a thing that you can't take with you.

TSM Potential for Bullish Continuation | 23rd February 2023Looking at the H4 chart, my overall bias for TSM is bullish due to the current price being above the Ichimoku cloud , indicating a bullish market.
Looking for a buy entry at 82.87, where the overlap support and 61.8% Fibonacci line is. Stop loss will be at 72.84, where the previous swing low is.
Take profit will be at 107.90, where the overlap resistance is.
Any opinions, news, research, analyses, prices, other information, or links to third-party sites contained on this website are provided on an "as-is" basis, as general market commentary, and do not constitute investment advice. The market commentary has not been prepared in accordance with legal requirements designed to promote the independence of investment research, and it is therefore not subject to any prohibition on dealing ahead of dissemination. Although this commentary is not produced by an independent source, FXCM takes all sufficient steps to eliminate or prevent any conflicts of interest arising out of the production and dissemination of this communication. The employees of FXCM commit to acting in the clients' best interests and represent their views without misleading, deceiving, or otherwise impairing the clients' ability to make informed investment decisions. For more information about the FXCM's internal organizational and administrative arrangements for the prevention of conflicts, please refer to the Firms' Managing Conflicts Policy. Please ensure that you read and understand our Full Disclaimer and Liability provision concerning the foregoing Information, which can be accessed on the website.

TSM. Warren Buffett “dumping” >80% ?! 22/Feb/23.So what next when Warren Buffett “dumping” > 80% of his TSM’s holding?. Maybe it’s not a good “timing” for “buy and hold” strategy for coming this few years but rather than “See money take money first?”..

TSM Taiwan Semiconductor ADR Sponsored$TSM #TSM TSM
Team solo mid (haha jk) is in a rough spot here. After an impeccable print of $98.87 it shot right past the 200 ema on the hourly chart. TEAM: If you were in at lower levels and raked profit before the slam, CONGRATULATIONS YOU DESERVE TO WIN!
It is not an easy PLAY to execute when opening up certain windows of print gain green.
The stock market is a powerFULL and wonderful drill. The longer you can drill and dig deep, the closer you are to the brightest gains that the stock market has to offer.
Be a leader in the markets, it's the only way.
Everyday watching film.
Enhancing craft is critical to a future in the stock market no matter which instrument you choose. And remember, all tools require understanding before they can be dominated on the live trading field. Stay alert even when you think you are too good at it, trust
She may climb briefly to approximately $93.97 then drip further down.
Overall, feels like a decent short setting up for a bit here for the short term. We'll see. Please remember, entry is critical to print win rate.
Everyone is a trading different size port folder at any given second in the stock markets existence.
The markets have their own DNA. Tap into and embrace your inner algorithm to become a leading gainer in any given market conditions.
RULE: AS SOON AS YOU LET THE MONEY GO IT BEGINS EARNING FOR YOU RIGHT AWAY
Stay productive and stay safe!
=stikstockitslive

TSM TSM TSMTaiwan SemiConductor Manufacturing ADR Sponsored
Nothing like the lucky number 77 for a long term entry.
What a monster swell from a solid company fundamentally.
=stikstockitslive

Taiwan Semiconductor Manufacturing Company (Long)Taiwan Semiconductor Manufacturing Company
Long
Entry at 95.66
Take Profit at 103.50 (8.20% profit from entry)
Stop loss at 91

Could Buffet Get Mollywopped? TSM to drop? Keep an eye on semi-conductors in general and another eye on ES, SPY, etc. We have the 200ma and weekly vwap on daily time frame coming together. We also have momentum to the downside, sellers seem to have control. Not financial advice, DYOR.
#berkshirehathaway #warrenbuffet
The CHIP War has begun........Read some of these articles to have a background knowledge
here .
here ,
here
here
On a simpler note, we are aware that the global economy is becoming more digitalised, though not moving at same velocity and growth. The chips are the "heart' of what goes into many things that are used in our daily lives , whether we are aware of them or not - from smart phones, data centres, military equipment, computers, etc.
What are the global players like TSMC and ASML charts telling us ? So, the SMH ETF is not doing too bad either if you are not good at picking up individual stocks.
The black dotted line shows all 3 have broke out from their bearish trend and are moving up higher weeks after weeks.
Please DYODD and all the best to your investment!

TSMC to break higher?Taiwan Semiconducotor - 30d expiry - We look to Buy a break of 83.72 (stop at 81.28)
Short term momentum is bullish.
In our opinion this stock is undervalued.
83.63 has been pivotal.
A break of the recent high at 83.63 should result in a further move higher.
We are trading at oversold extremes.
This is curremtly an actively traded stock.
Our profit targets will be 93.93 and 94.93
Resistance: 83.63 / 87.50 / 91.94
Support: 78.50 / 76.00 / 72.84
Please be advised that the information presented on TradingView is provided to Vantage (‘Vantage Global Limited’, ‘we’) by a third-party provider (‘Signal Centre’). Please be reminded that you are solely responsible for the trading decisions on your account. There is a very high degree of risk involved in trading. Any information and/or content is intended entirely for research, educational and informational purposes only and does not constitute investment or consultation advice or investment strategy. The information is not tailored to the investment needs of any specific person and therefore does not involve a consideration of any of the investment objectives, financial situation or needs of any viewer that may receive it. Kindly also note that past performance is not a reliable indicator of future results. Actual results may differ materially from those anticipated in forward-looking or past performance statements. We assume no liability as to the accuracy or completeness of any of the information and/or content provided herein and the Company cannot be held responsible for any omission, mistake nor for any loss or damage including without limitation to any loss of profit which may arise from reliance on any information supplied by Signal Centre.

LONG TSMC Buying up some TSM. Looks like a nice resistance reaching oversold area. SL at a breakdown, then potentially gonna look for a bounce just to limit the losses

TSM in an ascending triangle.Taiwan Semiconducotor - 30d expiry- We look to Buy a break of 83.22 (stop at 79.92)
Prices have reacted from 59.44.
Short term momentum is bullish.
Price action has formed a bullish ascending triangle formation.
A break of the recent high at 83.18 should result in a further move higher.
Our outlook is bullish.
Our profit targets will be 91.48 and 92.48
Resistance: 83.20 / 84.00 / 88.00
Support: 81.50 / 79.50 / 76.20
Disclaimer – Saxo Bank Group.
Please be reminded – you alone are responsible for your trading – both gains and losses. There is a very high degree of risk involved in trading. The technical analysis , like any and all indicators, strategies, columns, articles and other features accessible on/though this site (including those from Signal Centre) are for informational purposes only and should not be construed as investment advice by you. Such technical analysis are believed to be obtained from sources believed to be reliable, but not warrant their respective completeness or accuracy, or warrant any results from the use of the information. Your use of the technical analysis , as would also your use of any and all mentioned indicators, strategies, columns, articles and all other features, is entirely at your own risk and it is your sole responsibility to evaluate the accuracy, completeness and usefulness (including suitability) of the information. You should assess the risk of any trade with your financial adviser and make your own independent decision(s) regarding any tradable products which may be the subject matter of the technical analysis or any of the said indicators, strategies, columns, articles and all other features.
Please also be reminded that if despite the above, any of the said technical analysis (or any of the said indicators, strategies, columns, articles and other features accessible on/through this site) is found to be advisory or a recommendation; and not merely informational in nature, the same is in any event provided with the intention of being for general circulation and availability only. As such it is not intended to and does not form part of any offer or recommendation directed at you specifically, or have any regard to the investment objectives, financial situation or needs of yourself or any other specific person. Before committing to a trade or investment therefore, please seek advice from a financial or other professional adviser regarding the suitability of the product for you and (where available) read the relevant product offer/description documents, including the risk disclosures. If you do not wish to seek such financial advice, please still exercise your mind and consider carefully whether the product is suitable for you because you alone remain responsible for your trading – both gains and losses.

TSM, 7d/+20%rising cycle 20% in 7 days.
==================================================================================================================================================================
This data is analyzed by robots. Analyze historical trends based on The Adam Theory of Markets (20 moving averages/60 moving averages/120 moving averages/240 moving averages) and estimate the trend in the next 10 days. The white line is the robot's expected price, and the upper and lower horizontal line stop loss and stop profit prices have no financial basis. The results are for reference only.

Taiwan Semiconductor - A Precarious Situation, Warren Bought...Apple apparently uses TSM chips with plans in the future to use more. My old friend Warren bought some recently, I noticed a gap in the chart after he bought. He bought quite a lot... I am wondering if we will fill the gap then go up. Or is it possible that we could go lower after testing the gap? Could Warren B wrong? This is one tough chart to predict! Just pointing out important levels where we can pivot. NFA, DYOR.
Info to consider:
Apple is a priority customer for TSMC's advanced manufacturing process. According to equipment manufacturers and Apple's production chain, Apple will use TSMC's 3nm wafers for the first time in the second half of the year.
seekingalpha.com

TSM ShortTSM has created gap galore on its rally up. with the vix down at 20, indices at resistance, the 4 gaps created, RSI over cooked at 80 and a wedge created, id say a breakdown below wedge trend line around 80 and you'll see the first gap fill at least at 77then 72. big sell volume come at the top of this last run too.

TSM bull flag with buffet and AAPL news behind it. TSM making a nice bull flag with buffet stake and AAPL saying they will buy chips from arizona. good news behind it too and foundries have been looking strong in last month or so compared to other chip making companies.
looking at 84C fro DEC 2 on this flag intraday. over 83 can rip to 88

TSM makes (W)MA200 retestTSM makes huge almost 40% rally to retest (W)MA200 after a break. Usually biggest plunge happens after (W)MA200 retest - after a long break which has happened? It rallied towards (W)MA200 exactly after exposing Buffett's news.

TSM | Very Overbought Buffett Pick | SHORTTaiwan Semiconductor Manufacturing Company Limited manufactures, packages, tests, and sells integrated circuits and other semiconductor devices in Taiwan, China, Europe, the Middle East, Africa, Japan, the United States, and internationally. It provides complementary metal oxide silicon wafer fabrication processes to manufacture logic, mixed-signal, radio frequency, and embedded memory semiconductors. The company also offers customer support, account management, and engineering services, as well as manufactures masks. Its products are used in mobile devices, high performance computing, automotive electronics, and internet of things markets. The company was incorporated in 1987 and is headquartered in Hsinchu City, Taiwan.

TSM | Oversold Semiconductor | LONGTaiwan Semiconductor Manufacturing Company Limited manufactures, packages, tests, and sells integrated circuits and other semiconductor devices in Taiwan, China, Europe, the Middle East, Africa, Japan, the United States, and internationally. It provides complementary metal oxide silicon wafer fabrication processes to manufacture logic, mixed-signal, radio frequency, and embedded memory semiconductors. The company also offers customer support, account management, and engineering services, as well as manufactures masks. Its products are used in mobile devices, high performance computing, automotive electronics, and internet of things markets. The company was incorporated in 1987 and is headquartered in Hsinchu City, Taiwan.

TSM, 6d+/64.99~58.08shaking at 58.05~64.99 in 6 days.
==================================================================================================================================================================
This data is analyzed by robots. Analyze historical trends based on The Adam Theory of Markets (20 moving averages/60 moving averages/120 moving averages/240 moving averages) and estimate the trend in the next 10 days. The white line is the robot's expected price, and the upper and lower horizontal line stop loss and stop profit prices have no financial basis. The results are for reference only.

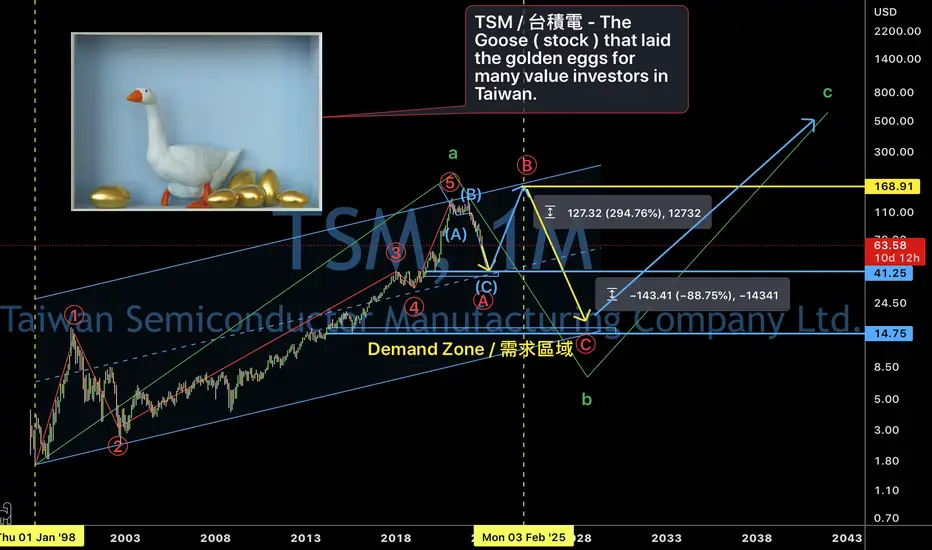
TSM ( Taiwan Semiconductor ) analysis. 21/Oct/22TSM ( Taiwan Semiconductor Manufacturing). The world largest semiconductor foundry. TSM .The Goose ( stock ) that laid the golden eggs for many value investors in Taiwan probably only found its base @ around 41.25