XNGUSD- Bollinger / TTM Squeeze for Breakout LONGThis 30 minute chart of spot natural gas demostrates the indicators triggering / signaling a big
move as it gets underway. I missed the big move catching the two smaller scalpes earlier in the
day. For me, this demonstrates the value of one or more of these indicators armed with an alert
or notification to catch the move once it gets started. It also shows the value of detecting a
Bollinger band width and volatility contraction before the release. Price action is showing
a high tight flag pattern which could forecast a similar leg higher after sufficient consolidation
to ti reach the consensus equilibrium of buyers and short sellers as to what the price should be.
I will be one of those buyers adding again to my position which I expect to swing trade
at least the rest of this week. For those already with good-sized positions, some may elect
to sell some to take a partial profit. I am considering being more watchful of such a situation
also realizing that a short squeeze could get underway since XNGUSD as been falling for
sometime. Long-time shorts might decide this is the exit point to avoid further loss of
unrealized profits. If they do so they play into the hand of new buyers and those holding.
Buckle up, this could get interesting.
Ttmsqueeze

ABT has good news synchronously with price action dip LONG
ABT on the one-hour chart is in a sideways diverging channel with Bollinger Bands overlaid
and now compressing. In Europe, the new implantable cardiac monitor has tentative approval
producing a growth narrative. Relative volumes and volatility have decreased heading into the
pivot. ABT is in what is projected to be one of the hottest sectors this year. It pays dividends
consistently. I am taking a long trade here. Targets are $120 and $130. A predictive algo
validates the idea in its forecast

Short Newmont Mining $NEM1. Trend is down over year and half
2. TTM Squeeze that usually bounces off opposite wall before reversing
3. Hitting resistance trendline repeatedly
4. Under 200ema
I could see this ultimately hitting 200ema, which I would dump everything into going short, but this spot is good for a short as well. Always keep more dry powder and don't blow your load in one go!

Good place to go short on Gold $XAUUSDHitting resistance from trend established for over a year, hitting 200ema, low volume, TTM Squeeze usually hits opposite side before turning around - big move coming!

VIX Weekly Rally?The VIX is the CBOE Volatility Index of the S&P 500 Index.
The VIX is generally inverse of the Market's Movement, specifically the S&P
Volatility is not stable for markets and acts similar to a greed/fear indicator for the markets.
The Higher the Volatility (VIX) The greater the Fear
VIX has been in an uptrend the past few months since the Bear Market Kicked off earlier in 2022
Vix Uptrend = Market DownTrend & an increase of volatility
The VIX has been forming this pennant-type resistance and support, and now has been testing the upper ends of this. The weekly chart on the VIX is creating a breakout with Momentum Squeezing thru to the upside as well.
TTM_SQUEEZE Represents price consolidation, and breakouts through momentum indications similar to MACD.
We are currently seeing a flip to the upside in the weekly chart.
This would be bad for financial markets and can definitely indicate another large pullback coming with little VIX Resistance above until $40 Zone.
We have not 100% broken these yet though, so patience is key and seeing how price reacts around these levels is key.

HDFC BANK - Bullish Price Action Analysis NSE:HDFCBANK has already activated Harmonic Shark Pattern with the PRZ level 0.886 and 1.13 with target price 1480 and 1540 respectively .
BUY :
If price sustains above 1422,you will see good upside momentum in price.
SELL:
below 1422 this pattern will be invalidated.

TTM: breaking out of bearish channelTTM ( Tata Motors , Indian conglomerate):
Nice set up here as we had a multi week bear channel and we're now breaking out of this channel, signalling a potential reversal to the upside.
To maintain this reversal, the price will need to remain above the line of the bear channel which is now acting as support. Note that price could go up a bit and retest the breakout point before really taking off.
I'm long with a stop at 26.19. All targets are on the chart. Two important targets are 29.13 which is the previous high, and 34.49.
Trade safe.

TSLA - Short term bearishNASDAQ:TSLA had a great run up last year. It had respected long term trendline support very well. It tried to break the trendline in February 2022 but faced a strong buying pressure at 700 level. Buyers jumped in and took the price back above the trendline. This buying momentum was short lived which you can see from highlighted ellipse on the chart(Candle bodies got smaller and smaller). Price ended up making lower high which shows weakness in bullish momentum. Price reversed strongly and broke down below long term trendline support which indicates trend reversal.
TSLA is forming Butterfly harmonic PRZ pattern and it just got activated this week when the price closed below the neckline(B level). Based on Butterfly harmonic rules, the price would come down to level D(Price Reversal Zone) and reverse from there.
TSLA was also in a ttmsqueeze on a weekly timeframe and is just getting out of it, so momentum could be seen for few weeks.

BTC Play to the downside | Head & Shoulders StrategyI am sharing a thesis on BTC I have been tracking for the last few weeks. Now before you call me crazy for wanting to "Short" BTC or being a bear, this is solely a Swing Trade Idea for the Short/Mid Term Time Line. In No way do I not support Crypto, and am not bullish on the Crypto Market LONG-Term.
This mid/short term thesis involves the WEEKLY & Daily Time frame of $BTC
COINBASE:BTCUSD
As you can see from viewing the $BTC chart on the weekly & daily time frame, a Head and Shoulders trend pattern is being printed out. As we are witnessing now, the 2nd high is hitting the resistance from the First Shoulder Level right around $50,000. This rejection we are seeing on the daily and weekly is printing out the Right Hand Shoulder of this Pattern.
With this thesis in mind, I'd also like to add that the TTM_SQUEEZE Indicator is indicating a bearish Reversal in the coming weeks. Similar to the TTM_SQUEEZE displayed back in May & June. So with this strong Bearish view on the Technical Indicator, and clean head & shoulders printout on the chart after a massive run this year, I think it is fair to say BTC could see another hefty pullback.
With this information in mind, a Shorting position on BTC or BTC tracking assets could be an ideal play.

MSFT Inverse Head & Shoulders-Inverse H&S on the 4h timeframe.
-2h Supply around neckline.
-We also have a TTM Squeeze forming on timeframes listed (30m, 1h, 2h, 3h, 4h). Higher chance of firing w/ squeeze on multiple timeframes.
Entry: break above 311.65 could target 318-320

IWM [Russel 2000] Inverse Head & Shoulders & BreakoutThe IWM as seen from the chart has been forming a solid and strong Inverse Head & Shoulders.
An Inverse Head & Shoulders is a strong Bullish Chart Technicals Pattern, that can be seen here. 2 Shoulders, and 1 head in the middle, making the low.
I am sharing this idea, as it is a pattern which has been printed on the Russel-2000 this past week, and can't go unnoticed!
The Russel-2000 Index has also been in a YEAR-long consolidation, and is ready to make a move one way or another.
On the weekly time frame of the Russel, the TTM_SQUEEZE Indicator a momentum indicator that can also predict big moves has been flashing red (signaling squeeze) and that a big move is coming one way or another.
AFTER This recent breakout attempt in November from IWM, and a retest of the bottom consolidation levels, the russel seems ready to bounce up with this inverse head and shoulders, or make a break down.
I think this is something to definitely keep on your radar folks!
Good Luck Trading!
I am personally looking at playing this with either :
IWM febuary monthlys OR $URTY a 3x leveraged russel ETF

JSWSTEEL - potential bullish setupNSE:JSWSTEEL is in ttm squeeze from past 22 weeks and it's making a high probability bullish setup.
1) All moving averages are stacked up.
2) Volume has decreased over time while the price retraced from the high.
3) VZO is showing sudden spike in recent candles and volume is also increasing gradually.
4) Price is getting rejected from 34 EMA and showing more buying pressure.
Because of above reasons, I think that there's a higher chances of squeeze firing upside.

SBUX - Big move coming**Ticker:** SBUX
**Golden Setup Checklist:**
- Above key moving averages (8,21,50)
- TTM Squeezes on multiple timeframes (1h,2h,4h,D,2D,3D,W)
- No Earnings, Dividend Payout in the near future
- Catalyst: Earnings was not bad at all. Multiple analyst have buy ratings well above where the stock is trading right now.
**Ratings And Price Targets as of Nov 1st:**
-Cowen has an Outperform rating and a $125 target.
-Bank of America has a Buy rating and a $135 target.
-Wells Fargo has an Overweight rating and a $122 target.
-Wedbush has an Outperform rating and a $128 target.
- Rotation out of tech stocks could move SBUX in the next couple weeks.
- Daily bullish MACD cross
- Daily RSI curling up
BTO SBUX 12/17 115C @ 2.06
BTO SBUX 01/22 120C @ 1.80

CCHHL - trend analysisNSE:CCHHL has been trading in a tight consolidation and also taking support at the trendline. Volume Zone Oscillator is showing increase of volume momentum. It is also in a ttm squeeze which indicates that a big move is due. If it breaks above 7.35 price resistance. It will activate two potential harmonic PRZ patterns.
1) Gartley - PRZ level at 7.55
2) Crab - PRZ level at 8.70

IIFLWAM - price action analysisNSE:IIFLWAM tried to breakout above 1712 but faced strong resistance and resulted in a false break. Yesterday it gave confirmation of trend reversal. 1712 is a key resistance level to watch. It has tested it two times while making higher lows (see trend line). It is also in a ttm squeeze with increasing momentum which indicates that it could give big move soon. Channel support could be a nice entry point from risk:reward perspective. If price would come down to 1588-1589 on the trend line support, you'll have 1:1.8 risk:reward ratio with SL at 1521 and target at 1712. If it hits 1712 while showing strength, you can book 50% profit and stay in the game for breakout, you can set your SL to initial entry price.
Disclosure: I am not a financial advisor, my analysis is purely for educational purpose.

RELIANCE price action analysis - bullishNSE:RELIANCE did a breakout recently and made all time high. Looking at hourly timeframe it looks like it's consolidating and forming a bullish flag pattern. Volume is also contracting while the price is consolidating.
There's a gap to be filled from 2395 to 2412. It had a chance to fill it on 8th september but the price reversed from 2406. It would be interesting to see what happens next week. It might give a fake breakdown to fill the gap and then reverse strongly trapping bears. Hoping for a break from a bull flag structure with a volume influx. Happy trading!

IIFLWAM price action analysis - BullishNSE:IIFLWAM is in a ttm squeeze with increasing momentum which indicates that a big move up can happen anytime soon. I am bullish because of the following reasons:
1) It's at all time high and currently standing at the major resistance level which it tested recently.
2) Current candle is very bullish and has a good volume compared to previous candle.
3) The volume seems to be increasing from past 3 days
3) It's forming cup and handle
If it manages to attract more buyers and keep up the volume, it can give a nice breakout. But if it fails, then it could reverse from here. We will see what next week brings. Happy trading!

SUNPHARMA price action analysisNSE:SUNPHARMA is in a ttm squeeze with increasing momentum which indicates that it could give big move up anytime soon.
Besides that, below are the additional confirmations that makes it bullish for short term.
1) All the EMAs are stacked up
2) It bounced off of 21 EMA and now it's consolidating at the resistance level which it created a month ago.

PFIZER price action analysisNSE:PFIZER is in a ttm squeeze with increasing momentum which indicates it could give a big move anytime soon. All the EMAs are stacked up and volume has been increasing from past 3 days. So it's looking pretty bullish right now. It's getting some selling pressure at resistance but we need to see sept 6th candle to get confirmation on whether it's going to breakout or get rejected.

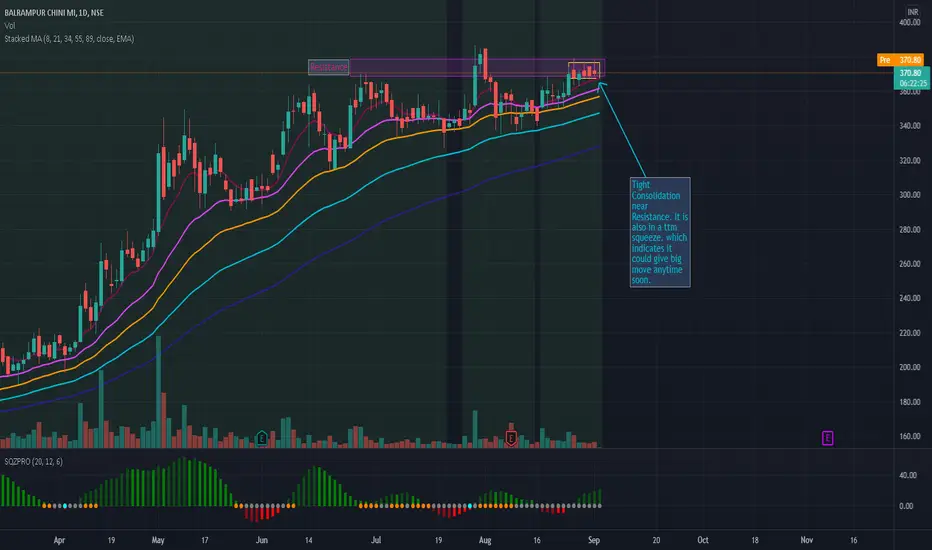
BALRAMCHIN - potential breakout playNSE:BALRAMCHIN is in a tight Consolidation near resistance. It is also in a ttm squeeze with increasing momentum which indicates that it could give big move up anytime soon. If it breaks out then we could see it go 400-420.
PYPL LongTicker: PYPL
Notes: PYPL got rejected hard on that 21EMA and formed a doji on the daily. It's setting up for a base rally formation along w/ TTM Squeeze on smaller timeframes. We also broke out of this wedge and looking for a continuation.
Key Levels:
- Play the breakout of 21EMA w/ a target of 286-287 area (50SMA)
or
-Wait for a retest of this wedge breakout at 273 to long it.
-Huge gap above, so it can be the next target after cleaing 50SMA

UPS Getting ready for a big move!UPS gapped down after ER and retraced back to .618 level and have been consolidating since. We forming a bull pennant and setting up for a mean reversion to the upside with a target of 200.50. We are also forming a TTM Squeeze on 4H, 2H, 1H and 15M. Gap fill potential if the squeeze fires. Average post squeeze run is about $8 move.
Key Level: 192.70 area to break for a possible target of 195.90.
Contract Suggestion:
BTO UPS 8/20 195C @ 1.10
BTO UPS 8/20 192.5C @ 2.15
Stop loss: Below 190
NYSE:UPS

TATACONSUM - price analysisTATACONSUM is in a narrow ttm squeeze and has a increasing momentum. It indicates that we could see a big move sometime soon. There could be two possible plays.
A) it will breakout from the current level
B) it will respect the resistance level and price will get rejected from here and will go back to 750 level support. If it gets rejected from the support level, then it will come back up stronger and break the 780-785 resistance level and break out.
I am more inclined towards B, because it's making shooting star candle at the resistance level which indicates price reversal. If august 9th candle closes lower, then price reversal will be confirmed. If it breaks out of the resistance, it will confirm play A.
