turboSupport and press the rocket to cheer me up
Observe the ten percent loss limit
Stay away from Bitcoins
Feel free to buy and sell and post your comments
TURBOUSDT

tourboSupport and press the rocket to cheer me up
Observe the ten percent loss limit
Stay away from Bitcoins
Feel free to buy and sell and post your comments

TURBOUSDT 1DTURBO ~ 1D
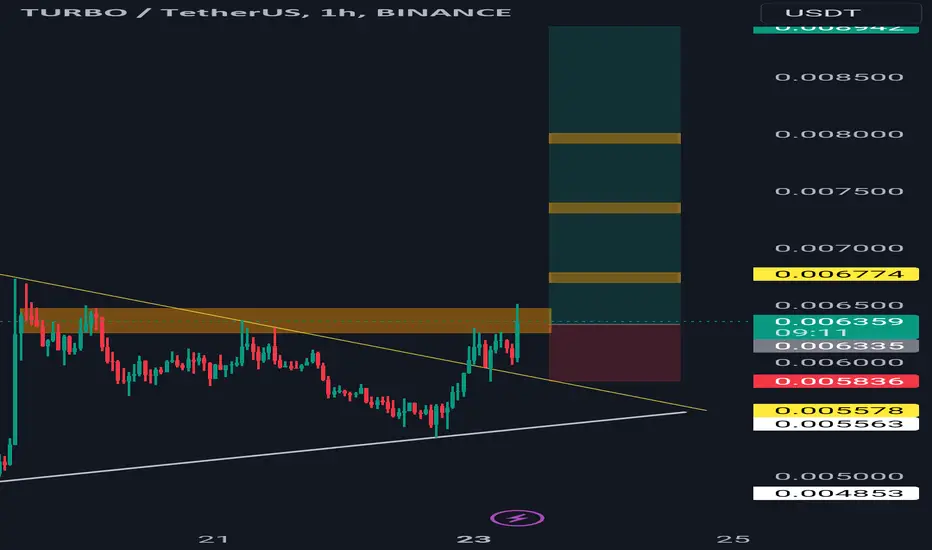
#TURBO If you still have Conviction on this coin. Buy gradually within this support Block,. With a short term target of at least 15%++

TURBO - Bullish Chart - Breakout & ATHHello Traders
Today I share my opinion about the TURBO coin.
The chart looks very bullish and is preparing to breakout soon. Once this breaks out I think we will get a new all time high shortly after.
Support area: 0.007$ area
Resistance: 0.01$ area & 0.012$ area
If we breakout the triangle and flip the 0.01$ resistance I believe this will pump a lot. Another important thing is that this coin is still not listed on coinbase so this would be a potential reason for a massive price increase.

Giving $TURBO a Second Chance: Positioned for Outperformance
OKX:TURBOUSDT is a bit behind $NEIRO by a 2x. If CRYPTOCAP:ETH starts moving in Q1 (which I expect), I see MYX:TURBO outperforming, along with related #memes under ETH.
Buying anything close to or below 0.0069.
Targeting a 4x move from there.

#TURBO Primed for a 200%+ Rally! RR 1:18MYX:TURBO looks primed for action! It's bouncing off the support level, and with a stop loss at $0.6223, this trade has strong potential.
Remember, When TURBO moves, it moves fast, probably triple-digit gains in just a few daily candles are not uncommon.
Don’t miss out if this fits your strategy. I am holding!
dyor, nfa.
Do hit that like button if you want me to post more.
Thank you
#PEACE

Sell TURBO/USDT Triangle Breakout in H4The TURBO/USDT pair on the H4 timeframe presents a Potential Selling Opportunity due to a recent breakout from a Triangle Pattern. This suggests a shift in momentum towards the downside in the coming Days. BINANCE:TURBOUSDT
Possible Short Trade:
Entry: Consider Entering A Short Position Below the Broken Trendline Of The Triangle After Confirmation. Ideally, This Would Be Around 0.0081
Target Levels:
1st Support – 0.0047
2nd Support – 0.0023
Your likes and comments are incredibly motivating and will encourage me to share more analysis with you.
Best Regards, KABHI FOREX TRADING
Thank you.

TURBO BREAKOUT ALERT: READY FOR A 150-160% SURGE!Hey everyone!
If you’re finding value in this analysis, don’t forget to hit that 👍 and follow for more updates!
TURBO is showing strong momentum! It’s breaking out of a bull flag formation on the 4-hour chart and has successfully retested the pattern, signaling readiness for a potential 150-160% rally. Accumulate some now and consider adding on any dips.
Entry Range: $0.0092 - $0.0099
Target: 150-160% gain
Stop Loss: $0.0084
This setup shows a powerful bullish trend for TURBO Coin! What are your thoughts on its potential? Share your analysis and insights in the comments below!

Turbo new ATHTurbo looks like its preparing for a new ATH. Falling wedge has been broken, looks like its retesting and then will prepare to go up to around 0.018. Would be a massive move and a beautifull timing if BTC goes to 80K as well.
Falling wedge^
No FA!
DYOR!

#TURBO/USDT#TURBO
The price is moving in a descending channel on the 1-hour frame and sticking to it well
We have a bounce from the lower limit of the descending channel, this support is at 0.007070
We have an upward trend, the RSI indicator is about to break, which supports the rise
We have a trend to stabilize above the moving average 100
Entry price 0.007540
First target 0.008144
Second target 0.008680
Third target 0.009430

TURBO is Set to Run Hard Soon!TURBO is Set to Run Hard Soon! 🚀
The bi-weekly chart is screaming a buy, and it’s currently sitting above the most recent order block. This one has massive upside potential, currently at a $400M market cap. We could see a solid 5x from current prices, which is very promising! There’s even a 45x target, but that feels a bit out of reach—though it’s definitely ambitious!
The meme cycle is firing up strongly, and we can’t let this opportunity slip by. We need to capitalize now, as the narrative and momentum are validating our entries.
Let’s get ready! 💪

TURBOUSDT: Ready for a Breakout After Healthy Retracement!!TURBOUSDT has retraced to a previous support level following a failed pennant pattern breakout. However, the recent price action shows a strong attempt to break out again, supported by increasing volume. If TURBO successfully breaks above the pennant, we can expect a significant upward movement. Keep an eye on key levels for entry and potential targets as momentum builds. This could be the opportunity traders have been waiting for!
TURBOUSDT Currently trading at $0.0055
Buy level: Above $0.0055
Stop loss: Below $0.0044
TP1: $0.0071
TP2: $0.0085
TP3: $0.01
TP4: $0.015
TP5: $0.02
Max Leverage 3x
Follow Our Tradingview Account for More Technical Analysis Updates, | Like, Share and Comment Your thoughts

#TURBO/USDT#TURBO
The price is moving in a descending channel on the 4-hour frame and sticking to it well
We have a bounce from the lower limit of the descending channel and we are now touching this support at a price of 0.0092200
We have a downtrend on the RSI indicator that is about to be broken, which supports the rise
We have a trend to stabilize above the moving average 100
Entry price 0.009552
First target 0.010277
Second target 0.011034
Third target 0.011924

Turbo Token: The AI-Driven Memecoin Poise to Reach New HighsTurbo Token ( MYX:TURBO ), the first-ever memecoin created entirely by AI, continues to capture the interest of both crypto and tech enthusiasts. Launched in September 2023, the ERC-20 token quickly gained traction, reaching a market cap of over $400 million. This unique AI-driven project, built with the assistance of OpenAI's GPT-4, boasts a total supply of 69 billion tokens, with a community-driven development ethos and transparent governance structure. As of now, the token has caught the attention of traders, thanks to its innovative use of AI and its decentralized nature.
Price Performance and Market Potential
Since its debut, MYX:TURBO has experienced remarkable market activity, hitting an all-time high of approximately $0.00982844 in May 2024. It has been highly volatile, with its value largely fluctuating based on market sentiment—typical behavior for meme coins. However, Turbo Token's strong branding as an AI-created project distinguishes it from other meme coins, contributing to its significant following.
One of the key factors driving MYX:TURBO 's growth is its unique positioning in the market, combining the hottest trends: cryptocurrency, meme culture, and AI. As a result, the token has enjoyed robust community engagement and high trading volume, with daily trading exceeding $100 million.
Technical Analysis
While MYX:TURBO 's price is currently down3.84% in Tuesday's trading session, it remains poised for potential future growth. The Relative Strength Index (RSI) sits at 75, indicating the token is overbought. However, this consolidation phase could present an opportunity for a future surge. Price support is currently at $0.00955, a critical pivot point that could see the token gain momentum in the near future.
AI Appeal and Community-Driven Growth
Turbo Token's strong community-driven approach, combined with its AI origins, helps it stand out in an increasingly competitive meme coin space. The project's narrative as an AI-created cryptocurrency appeals to both tech enthusiasts and crypto investors, creating a loyal base of potential supporters.
The token's future performance will depend heavily on its ability to maintain this community engagement, as well as its capacity to leverage its AI-centric branding. Turbo Token's renounced contract ensures decentralization, which adds to its credibility and appeal, particularly for those looking for a transparent, community-focused investment.
### Factors That Could Drive TURBO Price
Looking ahead, MYX:TURBO has the potential to see a price surge of 10 to 50 times. This growth, however, depends on several factors:
- Community Engagement: The token's community-driven development and its AI origins give it a unique appeal. If MYX:TURBO can continue to build its community and leverage its narrative effectively, it could see significant gains in the future.
- Meme Coin Market Potential: As seen with coins like DOGE and Shiba Inu, meme coins can experience exponential growth fueled by social media-driven hype. If MYX:TURBO can capitalize on social media trends and maintain community engagement, it could see similar rapid gains.
Risks and Challenges
While there is significant potential for MYX:TURBO , there are also risks. The meme coin market is highly speculative, and sustaining interest until 2025 would require continuous community engagement and possibly new use cases or partnerships. Without these factors, MYX:TURBO could face significant sell-offs, particularly if it doesn't offer clear value beyond its meme appeal.
In addition, regulatory risks pose a challenge for all cryptocurrencies, particularly meme coins. Any regulatory actions targeting meme coins or restrictions on trading could negatively impact MYX:TURBO 's price.
Lastly, competition within the meme coin space is fierce, with established players like DOGE and SHIB dominating the market. To stand out, Turbo Token will need to differentiate itself further, potentially by offering innovative features or enhanced utility tied to its AI-driven origins.
Conclusion
Turbo Token is positioned as a unique, AI-driven meme coin with substantial growth potential. While the token faces challenges in terms of volatility, competition, and regulatory risks, its strong technical indicators, community-driven development, and AI-centric branding suggest it could achieve significant gains. For investors looking for exposure to both AI and the meme coin craze, MYX:TURBO is worth keeping an eye on, particularly as the crypto market gears up for its next bullish run.

TURBOUSDT Triangle Breakout! TURBOUSDT technical analysis update
TURBOUSDT has formed a symmetrical triangle pattern and is now breaking the triangle resistance with high volume on the daily chart. The price is also trading above the 100 and 200 EMAs, which could signal a strong bullish move ahead.
Regards
hexa

Turbo price get ready to... #TURBO price has just surged upwards by +20%.
and this is after a prolonged consolidation that lasted all summer.
Generally speaking, if you look at the OKX:TURBOUSDT chart, you'll see that consolidations in this formation are a specialty of MMs who control the price.
1 If you have been sitting in the position all summer, then at the chart you can see the levels where you can take profits.
2 If you want to buy #TURBO, we think it's safe to do so when the #TURBOUSD price manages to gain a foothold above the trend line, as indicated by the blue arrow.
Be careful! Below 0.0033, there is a 60% gap!

TURBO is really preparing for Turbo mode (TA + trade plan by BF)Technical Analysis by Blaž Fabjan
Falling Wedge Pattern:
The chart displays a falling wedge, which is a bullish continuation pattern. Typically, this pattern signifies a potential breakout to the upside as the price consolidates before resuming its upward trend.
The wedge is identified with the resistance (upper line) and support (lower line) converging. The price is nearing the apex, suggesting that a breakout may be imminent.
Volume:
The volume seems to be relatively stable. A breakout from the wedge with a corresponding increase in volume would confirm the strength of the move.
In falling wedge patterns, diminishing volume during the consolidation phase is common, which aligns with the current scenario. Traders should watch for volume spikes on a breakout.
Indicators:
VMC Cipher_B Divergences:
The indicators at the bottom are showing several divergences. Notably, the green dots (or divergence indicators) suggest potential bullish momentum building up.
RSI (Relative Strength Index):
The RSI is around the 47.49 mark, suggesting a neutral zone, neither oversold nor overbought. An upward movement in RSI above 50 would signal increased bullish momentum.
Stochastic Oscillator:
The Stochastic Oscillator is at 62.61 (with the signal line at 58.17), indicating moderate bullish momentum. The oscillator has moved upward from a lower level, which could be a prelude to a potential bullish breakout.
Support and Resistance:
Support: The lower line of the falling wedge around 0.00625 USDT acts as a key support zone.
Resistance: The upper line of the wedge around 0.00685 USDT acts as resistance. A break above this level could lead to significant price appreciation.
If the price breaks the 0.00685 USDT resistance with strong volume, it could test the 0.0075 USDT area and beyond.
Trading Plan:
Entry:
Aggressive Entry: Consider entering the trade now, near the bottom of the falling wedge, around the 0.0064 USDT area, expecting the wedge to break out soon.
Conservative Entry: Wait for a confirmed breakout above the wedge's resistance at 0.00685 USDT. Look for a close above this level with a volume spike to confirm the breakout.
Stop Loss:
Place a stop-loss below the support of the wedge, around 0.0062 USDT. This gives room for minor price fluctuations but protects against a downside breakout.
Take Profit Targets:
First Target: 0.0075 USDT (measuring the height of the wedge and projecting it from the breakout point).
Second Target: 0.0080 USDT (psychological resistance level).
Final Target: If momentum continues strong, 0.0085-0.0090 USDT.
Risk Management:
Risk 1-2% of your portfolio on this trade.
Ensure a risk/reward ratio of at least 1:3 for a favorable setup.
Monitor the RSI and Stochastic:
If the RSI rises above 50 and the Stochastic Oscillator continues to trend upward, the likelihood of a breakout increases.
Exit Strategy:
In case the wedge pattern fails and the price breaks down below 0.0062 USDT, exit the trade to avoid larger losses.
If the price hits the first target (0.0075 USDT), consider taking partial profits and moving your stop loss to break-even to secure the trade.
Summary:
Potential breakout: The chart is indicating a falling wedge continuation pattern with a potential breakout to the upside. Indicators are showing neutral-to-bullish signals, and volume is crucial for confirming any upcoming breakout.
Risk/Reward:
Set up your entry points based on either a more aggressive or conservative approach, but ensure proper risk management and stop-loss placement.
Monitor the price action closely as it approaches the resistance, and act accordingly based on confirmation signals.

TURBO ANALYSIS🔮 #TURBO nalysis 💰💰
📊 #TURBO is making perfect and huge rounding bottom pattern in 4hr time frame, indicating a potential bullish move. If #TURBO breakout the pattern with high volume then we will get a bullish move📈
🔖 Current Price: $0.006200
⏳ Target Price: $0.007170
⁉️ What to do?
- We have marked crucial levels in the chart . We can trade according to the chart and make some profits. 🚀💸
#TURBO #Cryptocurrency #Pump #DYOR

Turbo Looking Great Turbo/USDT appears to be poised for a breakout, as it tests horizontal resistance. If successful, a bullish move of 20-40% could be on the horizon in the short term. Remember to do your own research—this is not financial advice.


Turbo/Usdt Plan Turbo/USDT looks promising for a potential short-term bullish move. Remember, this isn't financial advice; always do your own research and manage your risks accordingly.
TURBO/USDT technical analysis and a trading plan by BFTechnical Analysis by Blaž Fabjan
Chart Pattern (Falling Wedge): The chart shows a falling wedge pattern, which is typically a bullish reversal signal. This is evidenced by the downward sloping trendlines converging towards each other with decreasing price swings.
Support and Resistance:
Resistance Line (Upper Trendline): The price has tested this level multiple times but has failed to break through convincingly. A break above this resistance could signal a bullish move.
Support Line (Lower Trendline): The price has respected the support line, and it appears to be nearing another test of this level. If the price bounces from this support, it could confirm the bullish trend continuation.
RSI (Relative Strength Index):
The RSI is currently around 62, indicating that the price is in the neutral-to-slightly-overbought territory. However, it is not yet in the overbought zone (>70), meaning there could still be room for an upward movement.
Stochastic Oscillator:
The stochastic is around 82, suggesting that the market may be overbought in the short term. There could be a minor pullback before a larger move upward.
Volume:
There is moderate volume, but there isn't a significant volume spike yet to confirm a breakout. A notable increase in volume would be a good confirmation signal for a breakout.
MACD (VMC Cipher B):
The MACD-like indicator shows a potential bullish divergence. The oscillator is showing signs of reversal upward, further supporting the idea of a potential upward move.
Trading Plan:
Entry Strategy:
Aggressive Entry: Consider entering near the current price or slightly lower if the price bounces off the support trendline. This could offer an early position before the potential breakout.
Conservative Entry: Wait for a confirmed breakout above the resistance line (above the wedge pattern), ideally accompanied by a volume increase. This reduces risk but could result in entering at a higher price.
Take Profit (TP):
First TP: Set your first target around $0.0075 to $0.0080, near previous local highs, where sellers might emerge.
Second TP: If the breakout is strong and volume supports it, the next target can be around $0.0090, which is the level indicated by the large arrow on the chart, signaling the longer-term upward move.
Stop Loss (SL):
Place your stop loss slightly below the support line (around $0.0050) to limit downside risk in case of a bearish breakdown.
Risk Management:
Risk no more than 1-2% of your trading capital per trade.
Adjust your position size based on your risk tolerance and the distance between your entry point and stop loss.
Summary:
The TURBO/USDT chart shows a bullish setup with the potential for a breakout from a falling wedge pattern.
A conservative trader might wait for a confirmed breakout above resistance, while an aggressive trader could enter on a bounce from support.
The primary risk is a breakdown below support, which would invalidate the bullish thesis.
This strategy assumes that market conditions remain favorable, and the wedge pattern holds up. Keep an eye on the volume and other indicators to validate your decisions.

TURBO ANALYSIS📊 #TURBO Analysis
✅There is a formation of Descending triangle pattern on daily chart with a perfect breakout🧐
Pattern signals potential bullish movement incoming after a small retest 📉
👀Current Price: $0.005770
🚀 Target Price: $0.009400
⚡️What to do ?
👀Keep an eye on #TURBO price action and volume. We can trade according to the chart and make some profits⚡️⚡️
#TURBO #Cryptocurrency #TechnicalAnalysis #DYOR
