TUSDT Forming Descending Channel TUSDT is currently trading within a clearly defined descending channel pattern, which is a classic bullish reversal signal when identified in the right market context. After a prolonged period of correction, the price is now consolidating within the lower boundary of the channel, signaling that a potential breakout could be near. Historically, descending channels often precede strong bullish reversals, especially when accompanied by rising volume and increased investor interest—which we’re now starting to see in TUSDT.
The volume profile has remained consistently good during the consolidation phase, indicating that buyers are gradually absorbing supply at lower prices. This accumulation zone within the channel adds strength to the probability of a breakout. Once the upper resistance of the channel is breached with conviction, technical targets point toward a 60% to 70% move to the upside, making this a highly attractive setup for short-to-mid term traders.
Market sentiment is shifting, and as investor focus returns to quality altcoins, TUSDT’s setup becomes even more compelling. With more traders scanning for high-reward plays in the altcoin space, TUSDT's technical pattern places it in a strong position to capture breakout momentum. The alignment of price action, pattern structure, and investor participation creates a high-probability trading opportunity.
For those watching the altcoin market closely, TUSDT should be on the radar. A breakout from this descending channel could act as a catalyst for significant gains, aligning perfectly with the broader recovery trend forming in the crypto market.
✅ Show your support by hitting the like button and
✅ Leaving a comment below! (What is You opinion about this Coin)
Your feedback and engagement keep me inspired to share more insightful market analysis with you!
Tusdtlong

TUSDT 1W AnalysisTUSDT ~ 1W Analysis
#TUSDT This trade is very high risk. Buy if you still have confidence in this coin with a short term target of at least 20%++

#T/USDT#T
The price is moving within a descending channel on the 1-hour frame, adhering well to it, and is heading for a strong breakout and retest.
We are seeing a bounce from the lower boundary of the descending channel, which is support at 0.01704.
We have a downtrend on the RSI indicator that is about to break and retest, supporting the upward trend.
We are looking for stability above the 100 Moving Average.
Entry price: 0.01716
First target: 0.01732
Second target: 0.01745
Third target: 0.01757

Threshold Network(T) Analysis: From Bear Trap to Bullish TrendAs long as Bitcoin ( BINANCE:BTCUSDT ) and Ethereum ( BINANCE:ETHUSDT ) are in a range, it is a good opportunity to take advantage of the movement of other tokens and take a look at their charts.
Today, I want to analyze the Threshold( BINANCE:TUSDT ) project for you, which has increased by +70% .
What Is the Threshold Network?
Threshold Network is a decentralized protocol that combines cryptography and privacy to power secure, permissionless applications. It enables users to protect their digital assets through threshold cryptography—where no single party has full control—supporting use cases like private key custody, privacy-preserving smart contracts, and tokenized Bitcoin on Ethereum (via tBTC).
Reasons for Price Increase:
Token Buybacks : Threshold Network is actively buying back T tokens from the market, potentially increasing demand and positively impacting the token's price.
Halting Treasury Sales : The project has stopped selling T tokens from its treasury, signaling confidence in the token's future value and reducing potential market supply.
BitcoinWorld
Reducing Operational Expenses : By streamlining operations to save costs, the project aims for long-term sustainability in the volatile crypto landscape.
-----------------------------------------------------
Technical Analysis:
Now let's take a look at the Threshold(T) chart on the Daily timeframe .
Can we still take advantage of the increase in the price of T Token or not!? Please Stay with me.
The Threshold(T) project is moving near the Heavy Support zone($0.0189-$0.0147) and has managed to break the Resistance lines with a high-volume candle , which could be good news for the continuation of the T token's bullish trend .
The Threshold(T) Project also created a Bear Trap , which basically moves in the opposite direction of the Trap after traps on the price chart with high momentum , which is what happened here as well.
In terms of Elliott Wave theory , the T token is currently completing 5 impulsive waves after completing a Zigzag Correction(ABC/5-3-5) , which seems like we should wait for the main wave 4 and then a re-increase .
I expect the T token to start rising again from the Potential Reversal Zone(PRZ) and give us at least +30% profit opportunity .
Note: If the T token goes below $0.016, we should expect further decline and possibly a break of the Heavy Support zone($0.0189-$0.0147).
Please respect each other's ideas and express them politely if you agree or disagree.
Threshold Analyze (TUSDT), Daily time frame.
Be sure to follow the updated ideas.
Do not forget to put a Stop loss for your positions (For every position you want to open).
Please follow your strategy and updates; this is just my Idea, and I will gladly see your ideas in this post.
Please do not forget the ✅' like '✅ button 🙏😊 & Share it with your friends; thanks, and Trade safe.

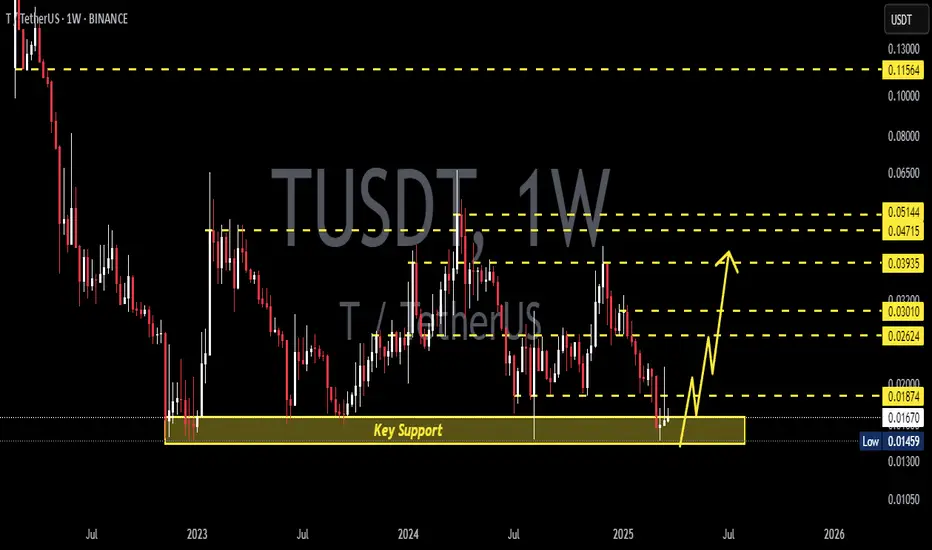
TUSDT 1WT ~ 1W Analysis
#T This trade is very high risk. Buy from here with a short -term target of at least 20%+. This is the lowest support for now.
T price analysis. Fix profit at this targetsWhere more than ok to fix profit GATEIO:TUSDT
Possible Targets and explanation idea
➡️IAP model still relevant since Feb 2022. Invalidation drop under listing price
➡️Long time like you can see accumulation around the best block to buy 0.78/0.86 lvl
➡️2 times we tested 0.5 level like resistance. Main targets its a 27 block 1.3b m cap
➡️And sweep ath 2.12 b market cap. Globally we can form just one big range
➡️And in a next bear market after Ath sweep we will fall under listing price
➡️Money power indicator you can see zones where mostly money inflow
➡️Based on take profit indicator buy line marked, exactly one more time inside best zone to buy
➡️Pay attention to circulation supply. 9,3 billion. I dont think so we will see price higher than 0.25-0.30$
Hope you enjoyed the content I created, You can support with your likes and comments this idea so more people can watch!
✅Disclaimer: Please be aware of the risks involved in trading. This idea was made for educational purposes only not for financial Investment Purposes.
---
• Look at my ideas about interesting altcoins in the related section down below ↓
• For more ideas please hit "Like" and "Follow"!

T/USDT PLAN T/USDT appears promising for a potential bullish advancement. The price is currently surpassing the trendline resistance on the 6-hour time frame. A successful breakout could indicate a forthcoming bullish move of around 50-80% in the coming days. Please note that this is not financial advice; always conduct your own research (DYOR).

TUSDT Technical Analysis in 3-Day TimeframeHello everyone, I’m Cryptorphic.
For the past seven years, I’ve been sharing insightful charts and analysis.
Follow me for:
~ Unbiased analyses on trending altcoins.
~ Identifying altcoins with 10x-50x potential.
~ Futures trade setups.
~ Daily updates on Bitcoin and Ethereum.
~ High time frame (HTF) market bottom and top calls.
~ Short-term market movements.
~ Charts supported by critical fundamentals.
Now, let’s dive into this chart analysis:
TUSDT is in a downtrend and has currently reached the lower support level at $0.01748. This support line has remained solid since December 2022, and the price is trending at the same level once again.
If TUSDT repeats the same rebound, it is highly possible to see a bullish move in the coming days. A breakdown below the lower support will invalidate the bullish rally.
Key levels:
~ Primary Support: $0.01748
~ Lower Support: $0.01460
~ Long-term Target: $0.0575
DYOR, NFA.
Please hit the like button to support my content and share your thoughts in the comment section. Feel free to request any chart analysis you’d like to see!
Thank you!
#PEACE

Long trade setup for TUSDTFor the BINANCE:TUSDT.P Long Trade Setup, the following values are suitable for our interval trade:
Entry: 0.02138
Target: 0.02273
Stop: 0.02063
Cost Reduction: -
The profit is reasonable relative to the risk.
*This is not investment advice; you can lose money. Crypto AI Signals is not responsible for any trades. 🚫💰

Long trade setup for TUSDTFor the BINANCE:TUSDT.P Long Trade Setup, the following values are suitable for our interval trade:
Entry: 0.02211
Target: 0.02477
Stop: 0.02074
Cost Reduction: 0.02095. The profit is reasonable relative to the risk.

TUSDTBINANCE:TUSDT Long idea 10% potential
⛔"Daily crypto market analyses I provide are personal opinions & not financial advice. Trading carries risks, so do your own research & seek advisor's help.#DYOR"
Don't forget to like and comment

T/USDT long and potential pump if a valid breakout occur In daily timeframe the price supported from an important zone then it got stuck in an triangle which is more recognizable in 4H timeframe. At this moment breakout is going to happen and I just enterd one out of five share of money here. Today, we have important news and I will wait for next candles to put money in. This proportion was only in order to avoid feeling of falling back.
Wish you best my friends.

Tusdt | It Will Be a nice trade Tusdt
Retesting big support area incase of successful retest the next challenge is uper trendline resistance if tusdt manage to break this resistance expecting good bullish move

$T/#USDT [#Threshold Network]: Resistance_Breakout◳◱ A Resistance Breakout has been identified on the $T / $USDT chart. The price has broken above a key resistance level, indicating a potential bullish trend. The next resistance key levels are located at 0.0412 | 0.0481 | 0.0606, and the major support zones can be found at 0.0287 | 0.0231 | 0.0106. Consider entering at the current price zone of 0.04088 and targeting higher levels.
◰◲ General info :
▣ Name: Threshold Network
▣ Rank: None
▣ Exchanges: Binance, Kucoin, Bybit, Huobipro, Gateio, Mexc
▣ Category/Sector: N/A
▣ Overview: Threshold Network project overview is currently unavailable. I'll try to update this in the upcoming analysis.
◰◲ Technical Metrics :
▣ Mrkt Price: 0.04088 ₮
▣ 24HVol: 8,660,306.526 ₮
▣ 24H Chng: -2.154%
▣ 7-Days Chng: 28.71%
▣ 1-Month Chng: 3.35%
▣ 3-Months Chng: 158.64%
◲◰ Pivot Points - Levels :
◥ Resistance: 0.0412 | 0.0481 | 0.0606
◢ Support: 0.0287 | 0.0231 | 0.0106
◱◳ Indicators recommendation :
▣ Oscillators: NEUTRAL
▣ Moving Averages: BUY
◰◲ Technical Indicators Summary : BUY
◲◰ Sharpe Ratios :
▣ Last 30D: 1.84
▣ Last 90D: 2.58
▣ Last 1-Y: -0.26
▣ Last 3-Y: -0.16
◲◰ Volatility :
▣ Last 30D: 1.28
▣ Last 90D: 1.96
▣ Last 1-Y: 1.28
▣ Last 3-Y: 1.30
◳◰ Market Sentiment Index :
▣ News sentiment score is N/A
▣ Twitter sentiment score is N/A
▣ Reddit sentiment score is N/A
▣ In-depth TUSDT technical analysis on Tradingview TA page
▣ What do you think of this analysis? Share your insights and let's discuss in the comments below. Your like, follow and support would be greatly appreciated!
◲ Disclaimer
Please note that the information and publications provided are for informational purposes only and should not be construed as financial, investment, trading, or any other type of advice or recommendation. We encourage you to conduct your own research and consult with a qualified professional before making any financial decisions. The use of the information provided is solely at your own risk.
▣ Welcome to the home of charting big: TradingView
Benefit from a ton of financial analysis features, instruments and data. Have a look around, and if you do choose to go with an upgraded plan, you'll get up to $30.
Discover it here - affiliate link -
