EUR/JPY, EUR/AUD, GBP/USD and GBP/JPY on watch for me today.EUR/JPY:
• If price pushes up to and ideally just above our upper trend line and the last part of the move is corrective, then I'll be looking for a risk entry after a phase line break on either the one hour or the fifteen minute chart.
• If price pushes up impulsively to and ideally just above our upper trend line, then I'll be waiting for a convincing push back down below our rayline followed by a tight flag where I'll be looking for a reduced risk entry on the break of the flag.
• If price pushes up to and ideally just above our rayline, then regardless of how price does so I'll be waiting for a convincing push back down followed by a tight flag where I'll be looking for a reduced risk entry on the break of the flag.
• If none of these setups present themselves then I will simply wait until another setup which meets my plan materialises.
• If there's any ambiguity then I will not place any of these trades.
EUR/AUD:
• If price pushes down impulsively below our rayline and then a tight flag forms I'll be looking for a reduced risk entry on the break of the flag.
• If price pushes down impulsively below our rayline and then a tight flag forms I'll be looking for a reduced risk entry on the break of the flag. But if the flag forms close to our rayline then I'll be using it as protection for my stop loss by hiding my stop loss above it.
• If price pushes down and then it flags either through or above our rayline then I'll not be looking to place an order on the break of the flag.
• If neither of these setups present themselves then I will simply wait until another setup which meets my plan materialises.
• If there's any ambiguity then I will not place any of these trades.
GBP/USD:
• If price pushes up to and ideally just above our upper trend line and the last part of the move is corrective, then I'll be looking for a risk entry after a phase line break on either the one hour or the fifteen minute chart.
• If price pushes up impulsively to and ideally just above our upper trend line, then I'll be waiting for a convincing push back down below our rayline followed by a tight flag where I'll be looking for a reduced risk entry on the break of the flag.
• If price pushes up to and ideally just above our rayline, then regardless of how price does so I'll be waiting for a convincing push back down followed by a tight flag where I'll be looking for a reduced risk entry on the break of the flag.
• If none of these setups present themselves then I will simply wait until another setup which meets my plan materialises.
• If there's any ambiguity then I will not place any of these trades.
GBP/JPY:
• If price pushes up to and ideally just above our upper trend line and the last part of the move is corrective, then I'll be looking for a risk entry after a phase line break on either the one hour or the fifteen minute chart.
• If price pushes up impulsively to and ideally just above our upper trend line, then I'll be waiting for a convincing push back down below our rayline followed by a tight flag where I'll be looking for a reduced risk entry on the break of the flag.
• If price pushes up to and ideally just above our rayline, then regardless of how price does so I'll be waiting for a convincing push back down followed by a tight flag where I'll be looking for a reduced risk entry on the break of the flag.
• If none of these setups present themselves then I will simply wait until another setup which meets my plan materialises.
• If there's any ambiguity then I will not place any of these trades.
Tutorials

GBP/USD, EUR/AUD and GBP/JPY on watch for me today.GBP/USD:
• If price pushes up to and ideally just above our upper trend line and the last part of the move is corrective, then I'll be looking for a risk entry after a phase line break on either the one hour or the fifteen minute chart.
• If price pushes up impulsively to and ideally just above our upper trend line, then I'll be waiting for a convincing push back down below our rayline followed by a tight flag where I'll be looking for a reduced risk entry on the break of the flag.
• If price pushes up to and ideally just above our rayline, then regardless of how price does so I'll be waiting for a convincing push back down followed by a tight flag where I'll be looking for a reduced risk entry on the break of the flag.
• If none of these setups present themselves then I will simply wait until another setup which meets my plan materialises.
• If there's any ambiguity then I will not place any of these trades.
EUR/AUD:
• If price pushes up to and ideally just above our upper trend line and the last part of the move is corrective, then I'll be looking for a risk entry after a phase line break on either the one hour or the fifteen minute chart.
• If price pushes up impulsively to and ideally just above our upper trend line, then I'll be waiting for a convincing push back down below our rayline followed by a tight flag where I'll be looking for a reduced risk entry on the break of the flag.
• If price pushes up to and ideally just above our upper rayline, then regardless of how price does so I'll be waiting for a convincing push back down followed by a tight flag where I'll be looking for a reduced risk entry on the break of the flag.
• If none of these setups present themselves then I will simply wait until another setup which meets my plan materialises.
• If there's any ambiguity then I will not place any of these trades.
GBP/JPY:
• If price pushes up to and ideally just above our upper trend line and the last part of the move is corrective, then I'll be looking for a risk entry after a phase line break on either the one hour or the fifteen minute chart.
• If price pushes up impulsively to and ideally just above our upper trend line, then I'll be waiting for a convincing push back down below our rayline followed by a tight flag where I'll be looking for a reduced risk entry on the break of the flag.
• If price pushes up to and ideally just above our rayline, then regardless of how price does so I'll be waiting for a convincing push back down followed by a tight flag where I'll be looking for a reduced risk entry on the break of the flag.
• If none of these setups present themselves then I will simply wait until another setup which meets my plan materialises.
• If there's any ambiguity then I will not place any of these trades.

NZD/USD and GBP/USD on watch for me today.NZD/USD:
• If price pushes up to and ideally just above our upper trend line and the last part of the move is corrective, then I'll be looking for a risk entry after a phase line break on either the one hour or the fifteen minute chart.
• If price pushes up impulsively to and ideally just above our upper trend line, then I'll be waiting for a convincing push back down below our rayline followed by a tight flag where I'll be looking for a reduced risk entry on the break of the flag.
• If price pushes up to and ideally just above our rayline, then regardless of how price does so I'll be waiting for a convincing push back down followed by a tight flag where I'll be looking for a reduced risk entry on the break of the flag.
• If neither of these setups present themselves then I will simply wait until another setup which meets my plan materialises.
• If there's any ambiguity then I will not place any of these trades.
GBP/USD:
• If price pushes up to and ideally just above our upper trend line and the last part of the move is corrective, then I'll be looking for a risk entry after a phase line break on either the one hour or the fifteen minute chart.
• If price pushes up impulsively to and ideally just above our upper trend line, then I'll be waiting for a convincing push back down below our rayline followed by a tight flag where I'll be looking for a reduced risk entry on the break of the flag.
• If price pushes up to and ideally just above our rayline, then regardless of how price does so I'll be waiting for a convincing push back down followed by a tight flag where I'll be looking for a reduced risk entry on the break of the flag.
• If none of these setups present themselves then I will simply wait until another setup which meets my plan materialises.
• If there's any ambiguity then I will not place any of these trades.

NZD/USD and EUR/NZD on watch for me today.NZD/USD:
• If price pushes up to and ideally just above our rayline I'll be waiting for a convincing impulse back down below our upper trend line, where I'll be looking for a reduced risk entry on the break of a subsequent tight flag.
• If price only pushes up to and ideally just above our upper trend line I'll still be happy to wait for a convincing impulse back down, where I'll again be looking for a reduced risk entry on the break of a subsequent tight flag.
• If price pushes up to or above our rayline and then it impulses back down convincingly or not I'll not be looking for any entry on the break of a subsequent flag, if the flag forms either through or above either our rayline or our upper trend line or through both.
• If neither of these setups present themselves then I will simply wait until another setup which meets my plan materialises.
• If there's any ambiguity then I will not place any of these trades.
EUR//NZD:
• If price pushes up impulsively to and ideally just above our rayline, then I'll be waiting for a convincing push back down followed by a tight flag where I'll be looking for a reduced risk entry on the break of the flag.
• If price pushes up impulsively to and ideally just above our rayline, then I'll be waiting for a convincing push back down followed by a tight flag where I'll be looking for a reduced risk entry on the break of the flag.
• If neither of these setups present themselves then I will simply wait until another setup which meets my plan materialises.
• If there's any ambiguity then I will not place any of these trades.

Learn how to use the head and shoulder pattern in TradingViewIntroduction of Head and Shoulders Pattern
Technical analysis is a necessary thing to select the positions of perfect entry and exit. For that, There are many patterns available for trading, the head and shoulders pattern is one of them. This article is all about the head and shoulders pattern. In simple words, this pattern includes three triangles. The first triangle is on the left side, and the second one is on the right side, the last one is in between these two. This, the last triangle is the highest in the height, which is called the head, the other two are called the shoulders.
What’s Head and Shoulders?
There will be three vertices or bottom points in a certain price area, but the second apex or bottom point is higher or lower than the other two vertices or bottom points. This type is called the head and shoulders type. One with top and two shoulders is head and shoulder top; one with two shoulders is head and shoulder bottom type. However, sometimes there may be more than three vertices or bottoms. If there are one or two heads (or bottoms), two left and right shoulders, it is called a compound head and shoulder top (or compound head and shoulder bottom).
The W bottom pattern is an important pattern in morphology, and its trend looks like the English letter "W". The W bottom pattern is a mid-term bottom pattern. It usually occurs at the end of a swing downtrend, and generally does not appear in the middle of a market trend. A mid-term short market must correspond to a mid-term bottom, that is, a W The brewing time of the bottom has its minimum period rule, so the shaping period of the bottom W is a necessary condition for judging the authenticity of the shape.
The components of the bottom W have the following two conditions:
There must be at least a relatively long distance between the first low point and the second low point of the bottom of W. Sometimes there will be short-term double bottoms in the market. This cannot be regarded as a bottom of W, but only a small market. Rebound at the end, and it is often a trap.
The transactions at the first low point are relatively active, while the transactions at the second low point are extremely dull. Moreover, the appearance of the second low point is usually slightly arc-shaped. Therefore, the W bottom pattern has the characteristics of a left-pointed right circle.
The formation of the bottom W pattern is due to the fact that after the long-term price decline, some investors who are optimistic about the market outlook believe that the price is already very low and has investment value, and the anticipatory buying is active, and the price will naturally rise, but this will affect the large investment institutions to absorb low-cost chips. Therefore, under the pressure of large investment institutions, the price has returned to the first low point, forming support. The fall this time hurt the enthusiasm of investors, and the shape was arc-shaped. There are two low points and two rebounds in the bottom W pattern. From the first high point, horizontal neckline pressure can be drawn. When the price breaks upward again, it must be accompanied by active transactions before the bottom W is officially established. If the upward breakthrough is unsuccessful, the exchange rate must continue to be adjusted horizontally. After the exchange rate breaks through the neckline, the neckline pressure becomes the neckline support, and the exchange rate will retreat at this time. The exchange rate temporarily retreats to the vicinity of the neckline. After the retreat ends, the exchange rate begins to rise in waves.
Generally speaking, the second low point of the W bottom pattern is better than the first low point, which can create a bottom-breaking atmosphere and let retail investors out, thus forming a relatively concentrated bottom of chips to facilitate the pull of large investment institutions.
Head and shoulders are the reversal patterns. That includes the concept of the bearish and bullish trend. In this pattern, there would be a one trend line, reacts as support, all three triangles are connected with that, called a neckline. If the trend crosses the neckline, there will be a change in the trend. By this, we can decide the trend (upward or downward).
The next is the bearish head and shoulders (top reversal) and the bullish head and shoulders (bottom reversal).
Bullish Head and Shoulders (Figure B): In this, the trend enters by falling. And makes the head and shoulders pattern by breaking the neckline. Then it will jump and make an uptrend by crossing the neckline in an incremental way.
Bearish Head and Shoulders (Figure A): The trend initials in the uptrend further it crosses the neckline and makes the Head and Shoulders pattern and then after, by breaking the neckline, it will fall. It calls Top reversal, too.
In-depth Description of Head and Shoulders Pattern:
==============================================
The reversal pattern refers to the pattern formed by the reversal of the stock price trend, that is, the signal that the stock price turns from an uptrend to a downtrend, or from a downtrend to an uptrend.
1. The pattern analysis
The head and shoulders trend can be divided into the following different parts:
(i) The left shoulder part-lasts a period of ascending time, the trading volume is very large, in the past, people who bought at any time were profitable, so they started to get Profit-selling caused a short-term decline in the stock price, and the turnover was significantly reduced when it reached its peak.
(ii) Top, After a short period of time, the stock price rose again strongly, and the transaction also increased. However, compared with the left shoulder part, the highest point of trading volume has significantly decreased. The stock price rose above the previous high and then fell again. The trading volume also decreased during this down period.
(iii) The right shoulder part-the stock price fell to close to the last down low point and then gained support to rebound. However, the market investment sentiment was significantly weakened, and the turnover was significantly reduced compared with the left shoulder and the head, and the stock price could not reach the head high The point fell back, and the right shoulder part was formed.
(iv) Breakthrough, Fall from the top of the right shoulder and break through the bottom neckline connected by the bottom of the left shoulder and the bottom of the head. The extent of the breakthrough of the neckline must exceed 3% of the market price.
Simply put, the shape of the top of the head and shoulders presents three distinct peaks, one of which is in the middle is slightly higher than the other two peaks. As for trading volume, there was a cascading decline.
2. Market meaning
The head and shoulders is a technical trend that cannot be ignored. From this pattern, we can observe the fierce competition between the poor and the weak.
At the beginning, the optimistic forces continued to push the stock price up, the market investment sentiment was high, and a large number of transactions occurred. After a short-term downturn adjustment, those who had experienced the last uptrend of germanium bought during the adjustment period, and the stock price continued to rise. At the second high point, the market appears to be healthy and optimistic on the surface, but the transaction has been much lower than before, reflecting the weakening of the buyer's power. Those who did not have confidence in the prospects and missed the last high point and profit-taking, or those who bought at the falling low point for short-term speculation all sold, and the stock price fell again. The third rise provides an opportunity for those investors who later realized that they missed the opportunity of the last rise, but the stock price is unable to rise above the previous high, and when the trading volume drops further, it is almost certain that the past bullish optimism is almost certain The mood has been completely reversed. The future market will be weak and weak, and a sharp drop is about to come.
The analysis of this pattern is:
(i) This is a turning pattern of a long-term trend, which usually appears at the end of a bull market.
(ii) When the trading volume of the most recent high is lower than the previous high, it implies the possibility of head and shoulders; when the stock price cannot rise to the previous high for the third time, trading will continue When it drops, experienced investors will seize the opportunity to sell.
(iii) When the head-shoulders-top-neckline breaks, it is a real sell signal. Although the stock price has fallen by a considerable amount from the highest point, the decline has only just begun. Investors who have not shipped yet continue to sell.
(iv) When the neckline breaks below, we can predict which level the stock price will fall to according to this type of measurement method of least drop. The method of this measurement is to draw a vertical line one by one from the highest point of the head to the neckline, and then start at the point where the right shoulder breaks through the neckline, and measure the same length downwards. The price thus measured is the stock price. The smallest drop.
3. Tips
(i) Generally speaking, the height of the left shoulder and the right shoulder are roughly equal, and the right shoulder on the top of the head and shoulders is lower than the left shoulder. But if the height of the right shoulder is higher than the head, the pattern cannot be established.
(ii) If its neckline slopes downward, it indicates that the market is very weak.
(iii) In terms of trading volume, the left shoulder is the largest, followed by the head, and the right shoulder is the smallest. However, according to some statistics, about one-third of the head and shoulders have more turnover on the left shoulder than the head, one-third of the turnover is roughly equal, and the remaining one-third have more turnover on the head than the left shoulder. .
(iv) When the neckline breaks, there is no need to increase the turnover. If the turnover increases sharply when the break, it shows that the selling power of the market is very strong, and the stock price will decline more rapidly as the turnover increases.
(v) After breaking the neckline, there may be a temporary rebound (post-draw). This situation usually occurs when a break of low volume occurs. However, the temporary recovery should not exceed the neckline level.
(vi) The head-and-shoulders top is a very lethal form, and its drop is usually greater than the smallest drop measured.
(vii) If the stock price finally rebounds at the neckline level and is higher than the head, or if the stock price drops below the neckline and then rises above the neckline, this may be a failed head and shoulders and should not be trusted.
Reversal pattern-head and shoulders bottom
=+=+=+=+=+=+=+=+=+=+=+=+=+=+=+=+=+=+=+=+=
1. The shape analysis [ Figure B ]
is the same as the shape of the head and shoulders, except that the whole shape is reversed, also known as "inverted head and shoulders". When the left shoulder is formed, the stock price drops and the trading volume increases, followed by a secondary increase with a small volume. Then the stock price fell again and fell below the lowest point of the last time, and the trading volume increased again with the decline, which was more than the trading volume during the rebound phase of the left shoulder-forming a head; when it rebounded from the lowest point of the head, the trading volume was May increase. The volume of the entire head is more than that of the left shoulder. When the stock price rebounded to the last rebound high, there was a third fall. At this time, the trading volume was obviously less than that of the left shoulder and head. When the stock price fell to the level of the left shoulder, the decline stabilized, forming the right shoulder. . Finally, the stock price formally instigated an upward trend, and accompanied by a large increase in transactions, when the neckline resistance broke through, the transaction increased significantly, and the whole pattern was established.
2. Market meaning
The analytical significance of the head and shoulders bottom is no different from that of the head and shoulders top. It tells us that the past long-term trend has been reversed. Stock prices have fallen again and again, and the second low (head) is obviously lower than the previous one. The price was low, but it quickly turned around and bounced back. The next fall, the stock price fell to the last low level and has gained support and rebounded, reflecting the optimistic forces that are gradually changing the market’s past weakening situation. When the high resistance line (neckline) of the two rebounds breaks, it shows that the optimistic side has completely knocked down the weak side, and the buyer replaces the seller to completely control the entire market.
3. Tips
(i) The shape of the top of the head and shoulders is similar to that of the bottom of the head and shoulders. The main difference lies in the volume.
(ii) When the head-shoulders-bottom-neckline breaks, it is a real buy signal. Although the stock price has risen by a certain amount compared with the lowest point, the upward trend is only just beginning. Investors who still suggest buying should continue to chase. The method of measuring the least increase is to draw a vertical line from the lowest point of the head to intersect the neckline, and then start at the point where the right shoulder breaks through the neckline, and measure the same height upwards. The measured price is that the stock will rise. The smallest amplitude. In addition, when the neckline resistance breaks, there must be a surge in volume, otherwise it may be a wrong break. However, if the transaction gradually increases after the breakthrough, the pattern can also be confirmed.
(iii) Generally speaking, the head and shoulders pattern is relatively flat, so it takes a longer time to complete.
(iv) After breaking through the neckline, there may be a temporary fall back, but it should not fall below the line. If it falls below the neckline, or if the stock price falls back at the neckline level, the neckline resistance cannot be broken, and it falls below the head, this may be a failed head and shoulders pattern.
(v) Head-and-shoulders bottom is one of the most predictive patterns. Once confirmed, the increase will mostly exceed the minimum increase.
Reversal pattern-compound head and shoulders
=+=+=+=+=+=+=+=+=+=+=+=+=+=+=+=+=+=+=+=+=
1. [ Figure A & B ]
Shape analysis The compound head and shoulders type is the deformation trend of the head and shoulders (head and shoulders top or head and shoulders bottom), and its shape is very similar to the head and shoulders, except that the shoulder, head, or both appear more than once at the same time, roughly It can be divided into the following categories:
(i) One-head and two-shoulder style: One head has two left and right shoulders of the same size, and the left and right shoulders are roughly balanced. More often is a pair of right shoulders. When the first right shoulder is formed, the stock price does not immediately fall below the neckline, but instead turns to rebound, but the rebound stops below the right shoulder height, and finally the stock price continues to follow the original The trend is down.
(ii) One-head and multiple-shoulder style: The general head-and-shoulder style tends to be symmetrical, so when two left shoulders are formed, it is likely that one shoulder will also be formed. Except for the volume, the left and right half of the graph is almost identical.
(iii) Long-headed and multi-shouldered pattern: During the formation of the head, the stock price has risen again and again, and it has risen to the same high level as last time before falling back down, forming two obvious heads. Trend. One thing must be noted: the volume of the second head tends to decrease compared to the first one.
2. Meaning market
analysis significance complex head and shoulders patterns and common type of head and shoulders patterns as when appears at the bottom, it means that a longer-term rising market around the corner; if appear at the top, that the market will become more fall.
In the initial stage of forming a compound head and shoulders pattern, the volume may be irregular, making the pattern difficult to identify, but after a while, it is easy to see that it is exactly the same as the head and shoulders pattern.
Many people overestimate the expected rise (or fall) power of the compound head and shoulders pattern. In fact, the power of the compound head and shoulders pattern is often weaker than the ordinary head and shoulders pattern. When a mid-term trend appears, the compound head-and-shoulders pattern completes its minimum increase (or decline) and then no longer continues, while the increase (or decline) of the ordinary head-and-shoulders pattern is often the most measured big.
3. Key points
(i) The minimum increase/decrease measurement method of the composite head and shoulders pattern is the same as that of the ordinary head and shoulders pattern.
(ii) It is difficult to draw the neckline of the composite head-and-shoulders pattern, because each shoulder and the falling part of the head (the bottom of the composite head and shoulders is the rising part), not all fall on the same line. Therefore, the two most obvious short-term lows (compound head and shoulders are short-term rebound highs) should be connected to form a neckline. In addition, it may be connected to the neckline at the level where the price has fallen (or rebounded) the most times.
Reversal pattern-single-day (double-day) reversal
=+=+=+=+=+=+=+=+=+=+=+=+=+=+=+=+=+=+=+=+=+
1. Pattern analysis [ Figure B ]
When a stock continues to rise for a period of time, the stock price is suddenly and unusually pushed up on a certain trading day, but it is immediately under strong selling pressure, and all the gains of the day are completely reduced. If you fall more and close at the lowest price of the day (or close to the lowest price of the day), this trading day is called the top one-day reversal. Also when it fell, the stock price suddenly fell sharply on a certain trading day, but it was immediately supported by strong buying. All the declines of the day may be increased, and the highest price of the day (or close to the highest price of the day) Price) closes, this is the bottom one-day reversal.
The two-day reversal is a deformation of this pattern. In the process of rising, the stock price of the stock rose sharply on a certain trading day and closed at the highest price of the day. However, after the stock price opened at yesterday’s closing price on the next day, the price continued to fall throughout the day. It is the closing of the lowest price of the previous day, and the performance of this trend is called the top two-day counter. Also when it fell, the stock price suddenly fell sharply on a certain trading day, but the following trading day completely recovered the lost ground and closed at the highest price of the day, which is the bottom two-day reversal.
2. Market implications
Let us take the bottom one-day reversal as an example to explain the cause of this phenomenon.
During the downward phase, as the stock price continued to fall, more and more investors were unable to bear greater losses, so they stopped loss and sold. Their selling further pushed down the stock price, and the lower price made them more eager to sell, which caused the price to fall sharply that day. When they finished selling, the selling pressure suddenly disappeared. Other investors tried to buy because of the lure of new low prices and immediately made profits. Therefore, more investors joined the ranks of buying. The order has been completely digested, so the buying order quickly pushed up the stock price, bringing back all the prices that fell that day.
The market meaning of the one-day reversal pattern has at least two points:
(i) The market temporarily peaks (when the top one-day reversal occurs) or bottoms (when the bottom one-day reversal occurs). The top one-day reversal usually occurs in the late period of a consumable rise; the bottom one-day reversal occurs at the end of the panic selling.
(ii) This is not a signal of a long-term trend reversal. It usually appears at the top of the consolidation pattern, although it may also appear at the peak (or bottom) of the long-term trend.
3. Key points revealed
(i) On the day of the single-day reversal, the transaction volume suddenly increased, and the price fluctuation range was very large, both of which were significantly larger than usual. If the trading volume is not high or the price volatility throughout the day is not large, the pattern cannot be confirmed.
(ii) The volatility of the stock price within one or two hours may be greater than the volatility of the usual three or four trading days. When the top one-day reversal, the stock price opened a lot higher than the previous trading day, but the situation quickly reversed, the price quickly moved in the opposite direction, and the closing price of the last day was almost nothing compared to the previous trading day Variety. The bottom one-day reversal situation is exactly the opposite.
(iii) Generally, 15 minutes before the market closes, there is a sudden increase in trading and the price quickly moves in the opposite direction.
(iv) The volatility of the two-day reversal of the transaction and price is also huge. The top two-day reversal completely falls back to the previous trading day's gain on the second trading day; while the bottom two-day reversal fully returns to the previous trading day's decline.
IF YOU LIKE MY ARTICLES, PLEASE SHOW YOUR LOVE TOWARDS MY ARTICLES BY GIVING LIKES AND COMMENTS.
The analysis and discussion provided are for your education and entertainment only. If you have any concerns or questions, DM me.

NZD/USD and GBP/USD on watch for me today.NZD/USD:
• If price pushes up to and ideally just above our rayline I'll be waiting for a convincing impulse back down below our upper trend line, where I'll be looking for a reduced risk entry on the break of a subsequent tight flag.
• If price only pushes up to and ideally just above our upper trend line I'll still be happy to wait for a convincing impulse back down, where I'll again be looking for a reduced risk entry on the break of a subsequent tight flag.
• If price pushes up to or above our rayline and then it impulses back down convincingly or not I'll not be looking for any entry on the break of a subsequent flag, if the flag forms either through or above either our rayline or our upper trend line or through both.
• If neither of these setups present themselves then I will simply wait until another setup which meets my plan materialises.
• If there's any ambiguity then I will not place any of these trades.
GBP/USD:
• If price impulses back down convincingly below both of our raylines I'll be waiting for a tight flag, where I'll be looking for a reduced risk entry on the break of the flag.
• If price impulses back down convincingly below both of our raylines I'll be waiting for a tight flag, where I'll be looking for a reduced risk entry on the break of the flag and if the flag forms just below our lower rayline then I'll be hiding my stop loss above it for extra protection as illustrated.
• If price impulses back down convincingly or not I'll not be looking for any entry on the break of a subsequent flag if the flag forms either through or above either of our raylines.
• If neither of these setups present themselves then I will simply wait until another setup which meets my plan materialises.
• If there's any ambiguity then I will not place any of these trades.

GBP/USD and NZD/USD on watch for me today.GBP/USD:
• If price impulses back down convincingly below both of our raylines I'll be waiting for a tight flag, where I'll be looking for a reduced risk entry on the break of the flag.
• If price impulses back down convincingly below both of our raylines I'll be waiting for a tight flag, where I'll be looking for a reduced risk entry on the break of the flag and if the flag forms just below our lower rayline then I'll be hiding my stop loss above it for extra protection as illustrated.
• If price impulses back down convincingly or not I'll not be looking for any entry on the break of a subsequent flag if the flag forms either through or above either of our raylines.
• If neither of these setups present themselves then I will simply wait until another setup which meets my plan materialises.
• If there's any ambiguity then I will not place any of these trades.
NZD/USD:
• If price pushes up to and ideally just above our rayline I'll be waiting for a convincing impulse back down below our upper trend line, where I'll be looking for a reduced risk entry on the break of a subsequent tight flag.
• If price only pushes up to and ideally just above our upper trend line I'll still be happy to wait for a convincing impulse back down, where I'll again be looking for a reduced risk entry on the break of a subsequent tight flag.
• If price pushes up to or above our rayline and then it impulses back down convincingly or not I'll not be looking for any entry on the break of a subsequent flag, if the flag forms either through or above either our rayline or our upper trend line or through both.
• If neither of these setups present themselves then I will simply wait until another setup which meets my plan materialises.
• If there's any ambiguity then I will not place any of these trades.

GBP/USD and EUR/NZD on watch for me today.GBP/USD:
• If price pushes up to and ideally just above our upper trend line and the last part of the move is corrective, then I'll be looking for a risk entry after a phase line break on either the one hour or the fifteen minute chart.
• If price pushes up impulsively to and ideally just above either our upper trend line or our lower rayline, then I'll be waiting for a convincing push back down followed by a tight flag where I'll be looking for reduced risk entries on the break of the flag.
• If price pushes up to and ideally just above our lower rayline, then regardless of how price does so I'll be waiting for a convincing push back down followed by a tight flag where I'll be looking for reduced risk entries on the break of the flag.
• If none of these setups present themselves then I will simply wait until another setup which meets my plan materialises.
• If there's any ambiguity then I will not place any of these trades.
EUR/NZD:
• If price impulses back into our expanding pattern convincingly after giving us a third touch, I'll simply be waiting for a subsequent tight flag where I'll be looking for a reduced risk entry on the break of the flag.
• If price impulses back into our expanding pattern convincingly after giving us a third touch, I'll simply be waiting for a subsequent tight flag where I'll be looking for a reduced risk entry on the break of the flag. But if the flag forms close to our rayline, then I'll be hiding my stop loss above the rayline as illustrated for extra protection.
• If price impulses back towards our expanding pattern after giving us a third touch, due to personal preference I'll not be looking for any entries on the break of a subsequent tight flag, regardless of with the impulse is convincing or not if the flag forms either through or above our rayline.
• If neither of these setups present themselves then I will simply wait until another setup which meets my plan materialises.
• If there's any ambiguity then I will not place any of these trades.

USD/CAD, GBP/USD and EUR/NZD on watch for me today.USD/CAD:
• If price pushes down to give us a confirmed second bottom and then it pushes up to and ideally just above our upper trend line and the last part of the move is corrective, then I'll be looking for a risk entry after a phase line break on either the one hour or the fifteen minute chart.
• If price pushes down to give us a confirmed second bottom and then it pushes up impulsively to and ideally just above our upper trend line, then I'll be waiting for a convincing push back down below our rayline followed by a tight flag where I'll be looking for a reduced risk entry on the break of the flag.
• If price pushes down to give us a confirmed second bottom and then it pushes up to and ideally just above our rayline, then however it gets there I'll be waiting for a convincing push back down followed by a tight flag where I'll be looking for reduced risk entries on the break of the flag.
• If none of these setups present themselves then I will simply wait until another setup which meets my plan materialises.
• If there's any ambiguity then I will not place any of these trades.
GBP/USD:
• If price pushes up to and ideally just above our upper rayline line and the last part of the move is corrective, then I'll be looking for a risk entry after a phase line break on either the one hour or the fifteen minute chart.
• If price pushes up impulsively to and ideally just above either our upper or our lower rayline, then I'll be waiting for a convincing push back down followed by a tight flag where I'll be looking for reduced risk entries on the break of the flag.
• If price pushes up to and ideally just above our lower rayline, then regardless of how price does so I'll be waiting for a convincing push back down followed by a tight flag where I'll be looking for reduced risk entries on the break of the flag.
• If none of these setups present themselves then I will simply wait until another setup which meets my plan materialises.
• If there's any ambiguity then I will not place any of these trades.
EUR/NZD:
• If price pushes up to and ideally just above our upper trend line and the last part of the move is corrective, then I'll be looking for a risk entry after a phase line break on either the one hour or the fifteen minute chart.
• If price pushes up impulsively to and ideally just above our upper trend line, then I'll be waiting for a convincing push back down below our rayline followed by a tight flag where I'll be looking for a reduced risk entry on the break of the flag.
• If price pushes up to and ideally just above our rayline, then however it gets there I'll be waiting for a convincing push back down followed by a tight flag where I'll be looking for reduced risk entries on the break of the flag.
• If none of these setups present themselves then I will simply wait until another setup which meets my plan materialises.
• If there's any ambiguity then I will not place any of these trades.

GBP/USD and EUR/NZD on watch for me today.GBP/USD:
• If price pushes up to and ideally just above our upper rayline line and the last part of the move is corrective, then I'll be looking for a risk entry after a phase line break on either the one hour or the fifteen minute chart.
• If price pushes up impulsively to and ideally just above either our upper or our lower rayline, then I'll be waiting for a convincing push back down followed by a tight flag where I'll be looking for reduced risk entries on the break of the flag.
• If price pushes up to and ideally just above our lower rayline, then regardless of how price does so I'll be waiting for a convincing push back down followed by a tight flag where I'll be looking for reduced risk entries on the break of the flag.
• If none of these setups present themselves then I will simply wait until another setup which meets my plan materialises.
• If there's any ambiguity then I will not place any of these trades.
EUR/NZD:
• If price pushes up to and ideally just above our upper trend line and the last part of the move is corrective, then I'll be looking for a risk entry after a phase line break on either the one hour or the fifteen minute chart.
• If price pushes up impulsively to and ideally just above our upper trend line, then I'll be waiting for a convincing push back down below our rayline followed by a tight flag where I'll be looking for a reduced risk entry on the break of the flag.
• If price pushes up to and ideally just above our rayline, then however it gets there I'll be waiting for a convincing push back down followed by a tight flag where I'll be looking for reduced risk entries on the break of the flag.
• If none of these setups present themselves then I will simply wait until another setup which meets my plan materialises.
• If there's any ambiguity then I will not place any of these trades.

GBP/USD and EUR/JPY on watch for me today.GBP/USD:
• If price pushes up to and ideally just above our rayline and the last part of the move is corrective, then I'll be looking for risk entries beneath the correction.
• If price pushes up impulsively to and ideally just above our rayline, then I'll be waiting for a convincing push back down followed by a tight flag where I'll be looking for reduced risk entries on the break of the flag.
• If price pushes up impulsively to and ideally just above our rayline, then I'll be waiting for a convincing push back down followed by a tight flag where I'll be looking for reduced risk entries on the break of the flag. But if the flag forms close to our rayline, then I'll be hiding my stop loss above the rayline as illustrated for extra protection.
• If none of these setups present themselves then I will simply wait until another setup which meets my plan materialises.
• If there's any ambiguity then I will not place any of these trades.
EUR/JPY:
• If price pushes down to give us a confirmed second bottom and then it pushes up to and ideally just above our rayline and the last part of the move is corrective, then I'll be looking for risk entries beneath the correction.
• If price pushes down to give us a confirmed second bottom and then it pushes up impulsively to and ideally just above our rayline, then I'll be waiting for a convincing push back down followed by a tight flag where I'll be looking for reduced risk entries on the break of the flag.
• If price pushes down to give us a confirmed second bottom and then it pushes up impulsively to and ideally just above our rayline, then I'll be waiting for a convincing push back down followed by a tight flag where I'll be looking for reduced risk entries on the break of the flag. But if the flag forms close to our rayline, then I'll be hiding my stop loss above the rayline as illustrated for extra protection.
• If none of these setups present themselves then I will simply wait until another setup which meets my plan materialises.
• If there's any ambiguity then I will not place any of these trades.

GBP/USD and EUR/NZD on watch for me today.GBP/USD:
• If price pushes up to and ideally just above our rayline line and the last part of the move is corrective, then I'll be looking for risk entries beneath the correction.
• If price pushes up impulsively to and ideally just above our rayline, then I'll be waiting for a convincing push back down followed by a tight flag where I'll be looking for reduced risk entries on the break of the flag.
• If price pushes up impulsively to and ideally just above our rayline, then I'll be waiting for a convincing push back down followed by a tight flag where I'll be looking for reduced risk entries on the break of the flag. But if the flag forms close to our rayline, then I'll be hiding my stop loss above the rayline as illustrated for extra protection.
• If neither of these setups present themselves then I will simply wait until another setup which meets my plan materialises.
• If there's any ambiguity then I will not place any of these trades.
EUR/NZD:
• If price pushes up to and ideally just above our upper trend line and the last part of the move is corrective, then I'll be looking for risk entries beneath the correction.
• However if the correction doesn't quite reach our upper trend line but it meets my entry criteria, then I'll be using the trend line as a shield by hiding my stop loss above it just encase price trickles up a little further before retracing.
• If price pushes up to and ideally just above our upper rayline and then we get a convincing push back down followed by a tight flag, then I'll be looking for reduced risk entries on the break of the flag.
• If neither of these setups present themselves then I will simply wait until another setup which meets my plan materialises.
• If there's any ambiguity then I will not place any of these trades.

GBP/USD and EUR/NZD on watch for me today.GBP/USD:
If price pushes up to and ideally just above our rayline line and the last part of the move is corrective, then I'll be looking for risk entries beneath the correction.
If price pushes up to and ideally just above our rayline impulsively and it doesn't give us an entry, then I'll be waiting for a convincing push back down followed by a tight flag where I'll be looking for reduced risk entries on the break of the flag.
If price pushes up to and ideally just above our rayline impulsively and it doesn't give us an entry, then I'll be waiting for a convincing push back down followed by a tight flag where I'll be looking for reduced risk entries on the break of the flag. But if the flag forms close to our rayline, then I'll be hiding my stop loss above the rayline as illustrated for extra protection.
If neither of these setups present themselves then I will simply wait until another setup which meets my plan materialises.
If there's any ambiguity then I will not place any of these trades.
EUR/NZD:
If price pushes up to and ideally just above our upper trend line and the last part of the move is corrective, then I'll be looking for risk entries beneath the correction.
However if the correction doesn't quite reach our upper trend line but it meets my entry criteria, then I'll be using the trend line as a shield by hiding my stop loss above it just encase price trickles up a little further before retracing.
If price pushes up to and ideally just above our upper rayline and then we get a convincing push back down followed by a tight flag, then I'll be looking for reduced risk entries on the break of the flag.
If neither of these setups present themselves then I will simply wait until another setup which meets my plan materialises.
If there's any ambiguity then I will not place any of these trades.

EUR/AUD and GBP/USD on watch for me today.EUR/AUD:
If price pushes up to and ideally just above our upper rayline and then we get a convincing push back down followed by a tight flag, then I'll be looking for reduced risk entries on the break of the flag.
If price pushes up to and ideally just above our upper rayline and then we get a convincing push back down followed by a tight flag, then I'll be looking for reduced risk entries on the break of the flag. But if the flag forms close to our raylines, then I'll be hiding my stop loss above both raylines as illustrated for extra protection.
I'll not be getting involved if the flag that forms after a subsequent push back up to our upper rayline followed by a convincing push down forms either through or above structure as illustrated.
If neither of these setups present themselves then I will simply wait until another setup which meets my plan materialises.
If there's any ambiguity I will not place any of these trades.
GBP/USD:
If price pushes up to and ideally just above our rayline and then we get a convincing push back down followed by a tight flag, then I'll be looking for reduced risk entries on the break of the flag.
If price pushes up to and ideally just above our rayline and then we get a convincing push back down followed by a tight flag, then I'll be looking for reduced risk entries on the break of the flag. But if the flag forms close to our rayline, then I'll be hiding my stop loss above the rayline as illustrated for extra protection.
I'll not be getting involved if the flag that forms after a subsequent push back up to our rayline followed by a convincing push down forms either through or above structure as illustrated.
If neither of these setups present themselves then I will simply wait until another setup which meets my plan materialises.
If there's any ambiguity I will not place any of these trades.

AUD/USD, EUR/JPY and AUD/JPY on watch for me today.AUD/USD:
I'll be looking for reduced risk entries if price pushes up to and ideally just above our rayline, pushes back down and then forms a tight flag.
I'll be looking for reduced risk entries if price pushes up to and ideally just above our rayline, pushes back down and then forms a tight flag. But if the flag forms close to our rayline, then I'll be hiding my stop loss above the rayline as illustrated for extra protection.
If price pushes up to and ideally just above our rayline, pushes back down and then forms a tight flag I'll not be getting involved if the flag forms either through or above structure as illustrated.
If neither of these setups present themselves then I will simply wait until another setup which meets my plan materialises.
If there's any ambiguity I will not place any of these trades.
EUR/JPY:
I'll be looking for reduced risk entries if price pushes up to and ideally just above our rayline, pushes back down and then forms a tight flag.
I'll be looking for reduced risk entries if price pushes up to and ideally just above our rayline, pushes back down and then forms a tight flag. But if the flag forms close to our rayline, then I'll be hiding my stop loss above the rayline as illustrated for extra protection.
If price pushes up to and ideally just above our rayline, pushes back down and then forms a tight flag I'll not be getting involved if the flag forms either through or above structure as illustrated.
If neither of these setups present themselves then I will simply wait until another setup which meets my plan materialises.
If there's any ambiguity I will not place any of these trades.
AUD/JPY:
I'll be looking for reduced risk entries if price pushes down below our rayline and then forms a tight flag.
I'll be looking for reduced risk entries if price pushes down below our rayline and then forms a tight flag. But if the flag forms close to our rayline, then I'll be hiding my stop loss above the rayline as illustrated for extra protection.
If price pushes down and then forms a tight flag either through or above our rayline as illustrated I'll not be placing a trade.
If neither of these setups present themselves then I will simply wait until another setup which meets my plan materialises.
If there's any ambiguity I will not place any of these trades.

EUR/USD, AUD/USD and EUR/JPY on watch for me today.EUR/USD:
I'll be looking for reduced risk entries if price pushes up to and ideally just above our rayline, pushes back down and then forms a tight flag.
I'll be looking for reduced risk entries if price pushes up to and ideally just above our rayline, pushes back down and then forms a tight flag. But if the flag forms close to our rayline, then I'll be hiding my stop loss above the rayline as illustrated for extra protection.
If price pushes up to and ideally just above our rayline, pushes back down and then forms a tight flag I'll not be getting involved if the flag forms either through or above structure as illustrated.
If neither of these setups present themselves then I will simply wait until another setup which meets my plan materialises.
If there's any ambiguity I will not place any of these trades.
AUD/USD:
I'll be looking for reduced risk entries if price pushes up to and ideally just above our rayline, pushes back down and then forms a tight flag.
I'll be looking for reduced risk entries if price pushes up to and ideally just above our rayline, pushes back down and then forms a tight flag. But if the flag forms close to our rayline, then I'll be hiding my stop loss above the rayline as illustrated for extra protection.
If price pushes up to and ideally just above our rayline, pushes back down and then forms a tight flag I'll not be getting involved if the flag forms either through or above structure as illustrated.
If neither of these setups present themselves then I will simply wait until another setup which meets my plan materialises.
If there's any ambiguity I will not place any of these trades.
EUR/JPY:
I'll be looking for reduced risk entries if price pushes up to and ideally just above our rayline, pushes back down and then forms a tight flag.
I'll be looking for reduced risk entries if price pushes up to and ideally just above our rayline, pushes back down and then forms a tight flag. But if the flag forms close to our rayline, then I'll be hiding my stop loss above the rayline as illustrated for extra protection.
If price pushes up to and ideally just above our rayline, pushes back down and then forms a tight flag I'll not be getting involved if the flag forms either through or above structure as illustrated.
If neither of these setups present themselves then I will simply wait until another setup which meets my plan materialises.
If there's any ambiguity I will not place any of these trades.

EUR/JPY and EUR/USD on watch for me today.EUR/JPY:
If price pushes up to and ideally above our upper rayline I'll be looking for a convincing impulse down followed by a tight flag where I'll look to get short with a reduced risk entry.
If the flag forms a little lower than in the example to the left I'll use the lower rayline as a shield by hiding my stop loss behind it for extra protection.
If price pushes up to and ideally above our lower rayline I'll be looking for a convincing impulse down followed by a tight flag where I'll look to get short with a reduced risk entry.
If none of these setups present themselves then I will simply wait until another setup which meets my plan materialises.
If there's any ambiguity I will not place any of these trades.
EUR/USD:
If price convincingly breaks below our descending correction I'll be looking for a reduced risk entry on the break of a more confirmed one hour tight flag.
If price convincingly breaks above both our descending correction and our rayline I'll be looking for a reduced risk entry on the break of any kind of tight flag.
If price impulses above our descending correction and flags below or even through our rayline I'll not be looking to place a trade.
If neither of these setups present themselves then I will simply wait until another setup which meets my plan materialises.
If there's any ambiguity I will not place any of these trades.

EUR/JPY and EUR/USD on watch for me today.EUR/JPY:
If price pushes up to and ideally above our upper rayline I'll be looking for an impulse down followed by a tight flag where I'll look to get short with a reduced risk entry.
If the flag forms a little lower than in the example to the left I'll use the lower rayline as a shield by hiding my stop loss behind it for extra protection.
If the flag doesn't form below our lower rayline I will not be interested in taking this trade.
If none of these setups present themselves then I will simply wait until another setup which meets my plan materialises.
If there's any ambiguity I will not place any of these trades.
EUR/USD:
If price convincingly breaks below our descending correction I'll be looking for a reduced risk entry on the break of a more confirmed one hour tight flag.
If price convincingly breaks above our descending correction I'll be looking for a reduced risk entry on the break of any kind of tight flag.
If none of these setups present themselves then I will simply wait until another setup which meets my plan materialises.
If there's any ambiguity I will not place any of these trades.

gbpcad this is my entry point and take profit one as well as take profit two.
i have not shown my stoploss but i ran a 20pip stop loss in case the trade went sour

MTL/BTC Channel + local trending. 9 months - 5 pumps + 100-220%MTL / BTC Work in the accumulation channel + from local trend lines. Important reversal areas.
For 9 months in the horizontal channel there were 5 pumps + 100% + 150% + 50% + 100% + 220%
In real work in the channel by averaging, you can take profits from 60% to 80% of each movement.
The coin is not a "promising technological derma" for believing crypto hamsters.
Coin "perspective scam" for making real money.
I showed the logic of the work on the chart, I also have several ideas for training and articles on this topic, I won’t repeat myself.
Volatility is the quality of a trading instrument that, when used skillfully, can inflate your trading deposit to indecent sizes.
Also on such instruments, do not forget to withdraw part of the profit from the exchange after each pumping of the price. It is very important. Greed begets poverty.
In such highly volatile instruments as in any other cryptocurrencies, sooner or later the time will come for the evaporation of the object of faith of fools (the disappearance of the project). Therefore, it is very important to always cash out part of the profit.
Work the rest of the amount by increasing the working volume with a complex percentage. And from here the big next potential profit.
Remember, no matter how much virtual money you earn on the exchange, without converting into real money, your profit is always zero
A similar coin with such volatility for making real money in a short KIN time. + 111% + 140% + 80% + 160%
The work is similar. I showed all movements in advance on this coin, all in related trading ideas, I will not repeat.
Kin profit for 3 months of work + 111% + 140% + 80% + 160%.
Do not be theorists, but be practitioners. A theory without practice is zero.
Only the "weight" of your deposit matters. Everything else is "water."
I also emphasize that most of the crowd is waiting - lazy people, they have always been, are and will be outsiders. This is fuel. Do not be him.
More information about the trading and not only in my telegram channel SpartaBTC.

Identifying support and resistance levels for swing tradingSupport and resistance are essential levels for all traders in swing trading. Before one can start placing orders on the buy/sell side, these key levels will form the battlefield for buying or selling.
In the video above, I will show you how to identify the support and resistance levels for swing trading so that you can buy near the support and sell near the resistance to maximize our profit while keeping risk exposure low, to have a better reward to risk ratio.
Depending on your strategy, preference and personality, you always have a choice to participate the swing within the range or in a trend. Swing trader always aim to catch the swing low as early as possible and sell when the swing is ended.
Resistance becomes support level once it was broken up. Always extend the support level to the right and pay attention if the price respect the support level. Do treat support as a zone/area instead of single line/level.

moving average linesas per a question/request to explain. a video in my opinion is worth a million words

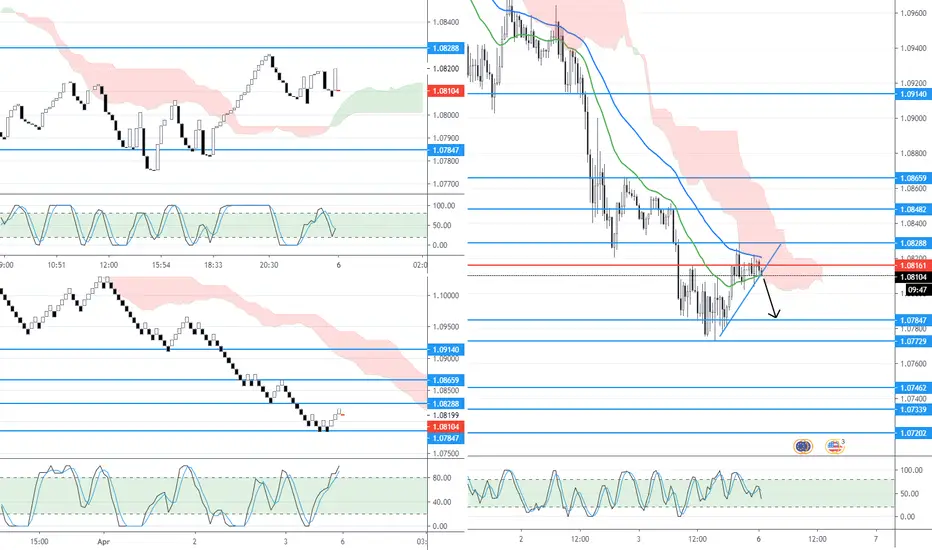
EUR|USD - Short OpportunityThere is an opportunity to short the EUR|USD on the break of the rising trendline supporting the contraction.
- Short entries should be initiated below 1.08094
- Stop Losses should be above the last swing of the corrective higher high 1.08288
- Target Point A : 1.07847 followed by Target Point B : 1.07729
All remaining target supports are marked bellow 1.07729 by consecutive horizontal lines (blue.)