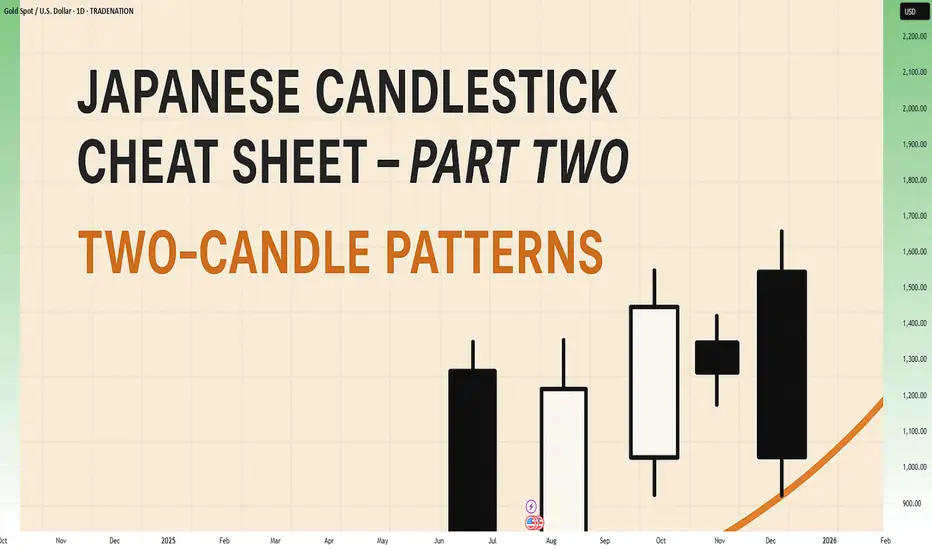
Japanese Candlestick Cheat Sheet – Part Two- 2 candle patternsTwo-Candle Patterns That Signal Shifts in Sentiment
Single candles whisper…
But two candles talk to each other — and when they do, they often reveal the first signs of a reversal or continuation.
In this second part of the series, we go deeper.
From engulfings to haramis, tweezer tops to piercing lines — these patterns don’t just look good on charts… they capture the psychological tug-of-war between buyers and sellers.
Price doesn’t lie.
And two candles in a row can say: “Something just changed.”
Learn to spot them early. Learn to listen when the chart speaks.
This is Part Two of your practical guide to mastering candlestick formations.
BULLISH KICKER
Bias: Bullish
What is the Bullish Kicker pattern?
The Bullish Kicker forms when a strong bullish candle follows a bearish one with no overlap between the two, indicating a sudden shift in sentiment. This pattern is a powerful indicator of a reversal as buyers take control. The sharp contrast between the bearish and bullish candles reflects a dramatic shift in market psychology, where bears are caught off-guard and forced to cover their positions.
Bullish Kickers are rare but extremely telling, providing a clear signal that sentiment is favoring buyers. Recognizing such decisive patterns can be a game-changer.
Meaning:
Found after downtrends or sell-offs; suggests a sudden shift in sentiment, indicating strong buying interest and potential trend reversal.
BULLISH ENGULFING
Bias: Bullish
What is the Bullish Engulfing pattern?
The Bullish Engulfing pattern occurs when a large bullish candle fully engulfs the previous smaller bearish candle, signaling a potential trend reversal. This pattern highlights a moment when buyers overpower sellers, often marking the beginning of upward momentum. Psychologically, it suggests that buyer confidence is returning, and sellers are losing their grip.
For traders, understanding Bullish Engulfing patterns can provide crucial entry points into emerging trends. Learning to identify and trade such patterns is essential for capturing momentum and new trends.
Meaning:
Typically found in downtrends, this pattern signals a potential bullish reversal as buyers overpower sellers, often indicating a shift toward upward momentum.
BULLISH HARAMI
Bias: Bullish
What is the Bullish Harami pattern?
The Bullish Harami consists of a small bullish candle within a preceding larger bearish one, indicating a pause in downward momentum and hinting at a potential reversal. This pattern shows that sellers are beginning to weaken as buyers cautiously test the waters. The Harami reflects a shift in sentiment from bearish to neutral, often marking a transitional phase in the market.
Interpreting the Bullish Harami helps traders spot moments when sentiment is shifting, potentially signaling the start of a trend change.
Meaning:
Seen in downtrends, it suggests indecision, with possible bullish reversal if the following candles confirm buying strength, indicating a weakening bearish trend.
PIERCING LINE
Bias: Bullish
What is the Piercing Line pattern?
The Piercing Line forms when a bullish candle opens below the previous bearish candle’s low but closes over halfway into it. Found in downtrends, this pattern reflects strong buying pressure as buyers step in at lower prices, creating a potential bullish reversal. The Piercing Line pattern suggests that sentiment may be shifting as buyers gain confidence.
This pattern’s strength lies in its psychological impact, revealing moments when buyers are willing to take risks. Recognizing these signs early can provide valuable insights for traders looking to time entries.
Meaning :
Found in downtrends, this pattern suggests a possible bullish reversal if buying continues, as sellers lose control to buyers.
TWEEZER BOTTOM
Bias: Bullish
What is the Tweezer Bottom pattern?
The Tweezer Bottom pattern is characterized by two consecutive candles with nearly identical lows, one bearish and one bullish. This pattern often signals the end of a downtrend, as the matching lows suggest a strong support level where buyers are stepping in. The Tweezer Bottom highlights market psychology at work, with sellers unable to push prices lower, reflecting renewed buying interest.
Tweezer Bottoms are ideal for traders looking to identify support zones and potential reversal points. By understanding this pattern’s significance, traders can make informed decisions.
Meaning:
Found in downtrends, it signals potential reversal, showing strong support at the matching low, suggesting buyers are stepping in.
BEARISH KICKER
Bias: Bearish
What is the Bearish Kicker pattern?
The Bearish Kicker is the inverse of the Bullish Kicker, forming when a strong bearish candle follows a bullish one without overlap, indicating a sharp sentiment shift. This pattern often marks a sudden reversal, with sellers taking control after an initial bullish period. Psychologically, Bearish Kickers are powerful, signaling that buyers are caught off-guard and losing momentum.
Recognizing Bearish Kickers provides traders with insights into sudden shifts in market dynamics, helping them avoid buying into weakening trends.
Meaning:
Found after uptrends; indicates a sudden sentiment shift, signaling potential trend reversal and intensified selling pressure.
BEARISH ENGULFING
Bias: Bearish
What is the Bearish Engulfing pattern?
The Bearish Engulfing pattern forms when a large bearish candle engulfs the previous smaller bullish candle, suggesting a potential reversal in an uptrend. This pattern signals that sellers have regained control, often marking the start of downward momentum. The Bearish Engulfing reveals a psychological shift, as selling pressure overtakes buying interest.
This pattern is a powerful tool for traders who aim to catch trend reversals, allowing them to align with emerging downward momentum.
Meaning:
Typically found in uptrends, this pattern signals a potential bearish reversal as sellers overpower buyers, often indicating a downward momentum shift.
BEARISH HARAMI
Bias: Bearish
What is the Bearish Harami pattern?
The Bearish Harami consists of a small bearish candle contained within a larger preceding bullish one, reflecting indecision and a potential trend reversal. Found in uptrends, it hints that buyers are losing strength, while sellers are cautiously testing the market. This pattern highlights moments when buyer momentum begins to wane, suggesting caution.
Interpreting the Bearish Harami allows traders to spot potential shifts in sentiment, helping them manage risk and time their exits.
Meaning:
Seen in uptrends, it suggests indecision with a potential bearish reversal if following candles confirm, indicating a weakening bullish trend.
DARK CLOUD COVER
Bias: Bearish
What is the Dark Cloud Cover pattern?
The Dark Cloud Cover appears when a bearish candle opens above the previous bullish candle but closes over halfway into it, reflecting a shift in control from buyers to sellers. This pattern suggests that bullish momentum may be fading, hinting at a potential reversal. Dark Cloud Cover patterns reveal moments when sentiment shifts from optimism to caution.
For traders, understanding this pattern helps them anticipate reversals at the top of uptrends.
Meaning:
Found in uptrends; signals potential bearish reversal if selling continues, as buyers lose control to sellers.
TWEEZER TOP
Bias: Bearish
W hat is the Tweezer Top pattern?
The Tweezer Top is formed by two candles with matching or nearly matching highs, typically one bullish and one bearish. This pattern signals potential resistance, as sellers are consistently pushing back against the same level. The Tweezer Top reflects a moment of seller strength, often marking the end of an uptrend.
Recognizing Tweezer Tops helps traders spot resistance zones and potential reversal points, allowing them to avoid buying into weakening trends or even shorting the asset.
Meaning:
Found in uptrends, it signals potential reversal, showing strong resistance at the matching high, suggesting selling pressure.
🧭 Final Thought
Two-candle formations often appear at key turning points — right where most traders hesitate or get trapped.
Learn to read them not just as patterns, but as conversations between candles — one pushing, the other reacting.
And if this is your first time reading the series, don’t miss Part One – where we covered single-candle signals like dojis, hammers, and marubozus — the very foundations of candlestick reading.
Tweezer
A Step-by-step Guide to One of the Chart Analysis MethodHello Friends,
Welcome to RK_Chaarts,
Today we're going to learn step-by-step guide to one of the chart analysis Method by analyzing a chart of " Varun Beverages Ltd. (VBL) " to identify a trend change opportunity.(Educational Post).
Let's get started!
Applying Elliott Wave Theory
First, we can see that the bottom formed in March 2025 is likely a Wave ((4)) in Black as a bottom, marked as such on the chart. From there, Wave 5 should move upwards. Looking at the daily timeframe, we can see that price gone up in five sub-divisions of Wave (1) in Blue of Wave ((5)) in Black have completed, marked as Red 1-2-3-4-5, that means blue intermediate Wave (1) has ended, and Wave (2) has begun, which is unfolded in corrective nature marked as WXY in Red of Wave (2) in Blue.
According to the wave principle, Wave (2) should not retrace more than 100% of Wave (1), which started from the 419.65 bottom. Therefore, 419.65 becomes our invalidation level. If the price moves below this level, it would invalidate our Wave (2) principle.
Assuming our wave counts are correct, the upward movement is in the five sub-divisions, and the downward movement is in the three sub-divisions. Definitely, the conviction is increasing that we have correctly identified Waves (1) and (2). Shown in chart image below
Tweezers at Bottom
Now, we can see that Wave 2 has retraced more than 70% and has formed a Tweezer candlestick pattern at the bottom. A bearish candle was followed by a bullish candle, both with a Tweezer-like shape, with the second candle being green. This could indicate a potential reversal. Moreover, the latest candle has also taken out the high of the previous two candles, showing follow-through. The price has also shown follow-through on the upside after that. So, this can be considered as the first sign that Wave 2 might be ending, marked by a significant Tweezer pattern at the bottom with a follow-through candle. Shown in chart image below
Significant Breakout Pending Yet
Secondly, from the top where Wave 1 ended, we've been considering the decline from around 560.50 as a resistance. We drew a resistance trend line, and if the price breaks out above it, we can say that the resistance trend line has been broken, indicating a breakout above the last fall's trend line, Which is not Broken yet. Shown in chart image below
Dow Theory
The Dow Theory states that when the price moves up, it forms a Higher High, Higher Low pattern, and when it moves down, it forms a Lower High, Lower Low pattern. Somehow, the Dow Theory also needs to change, as the last swing was forming a Lower High, Lower Low pattern. The last swing high was at 479, which we marked with a green arrow. If the price crosses above it, we can say that the price is now forming a Higher High pattern. This indicates that the Dow Theory is changing from a falling trend to a rising trend. Shown in chart image below
Stop Loss
Once the Dow Theory also changes, we can use the last swing low at 446.15 as our stop loss. However, this stop loss will only be valid after the Dow Theory changes; otherwise, the invalidation level will remain at 419. Shown in chart image below
Projected Target of Wave (3)
So, friends, we've applied the Elliott Wave principle, and there's been a significant retracement, all within the valid range, without violating any rules or triggering invalidation. There's limited room left on the downside, and then we have the Tweezer candlestick pattern, which is a significant sign. We're expecting a reversal from there, and the price has followed up with an upward move.
What's left now is the breakout above the resistance trend line and a change in the Dow Theory. Once these two conditions are confirmed, all parameters will match, and we can add a position to our portfolio using the last swing low as our stop loss, instead of the invalidation level.
This is how chart analysis is done for investment purposes. We've seen many signs in our favor, and yet we still use a stop loss to prevent significant losses in case the stock or market moves unexpectedly. This is what stop loss is all about - minimizing potential losses.
We've also discussed the target projection based on Wave theory, 161.8% level, which we explained through an image. So, friends, I hope you've understood the entire conclusion and learned how to analyze charts using different methods, one of which we shared with you today.
I am not Sebi registered analyst.
My studies are for educational purpose only.
Please Consult your financial advisor before trading or investing.
I am not responsible for any kinds of your profits and your losses.
Most investors treat trading as a hobby because they have a full-time job doing something else.
However, If you treat trading like a business, it will pay you like a business.
If you treat like a hobby, hobbies don't pay, they cost you...!
Hope this post is helpful to community
Thanks
RK💕
Disclaimer and Risk Warning.
The analysis and discussion provided on in.tradingview.com is intended for educational purposes only and should not be relied upon for trading decisions. RK_Chaarts is not an investment adviser and the information provided here should not be taken as professional investment advice. Before buying or selling any investments, securities, or precious metals, it is recommended that you conduct your own due diligence. RK_Chaarts does not share in your profits and will not take responsibility for any losses you may incur. So Please Consult your financial advisor before trading or investing.

USDCAD Strong BearishMy 3 reasons to expect bearish:
-Tweezer top pattern on daily which is strong pattern,
-It's rebound from OB area also on daily
-It's rebound from previous resistance
Technically all condition is available to support bearish but the dollar index is still bullish. If index not close over 103.36 this will support my idea.

Double Top with Tweezer TopEUR/USD 1HR TimeFrame Double Top with Tweezer Top great confirmation for selling
Technical analysis on resistance

GBP/JPY: Bullish Momentum ContinuesHello fellow traders! Today, I would like to share an exciting trading opportunity that has emerged on the GBP/JPY currency pair. Through careful analysis of the 1-hour chart, I have identified a bullish trend, supported by a significant technical pattern.
Trade Plan:
Entries: Buy at 181.441 & 181.443
Stop Loss: 180.214
Take Profit 1 (1:1 Risk-Reward Ratio): 182.711
Take Profit 2 (1:2 Risk-Reward Ratio): 183.399
Reasoning:
The GBP/JPY currency pair has been exhibiting a strong bullish momentum on the 1-hour chart. Furthermore, a bearish tweezers bottom candlestick pattern has recently formed, confirming the continuation of the bullish trend.
Based on this analysis, I have executed a market order to enter a long position on the GBP/JPY pair at the suggested entry prices of 181.441 and 181.443. To manage risk, I have set a stop loss at 180.214, which will be triggered if the price moves against our anticipated direction.
In terms of potential profit targets, I am setting the first take profit level at 182.711, which offers a 1:1 risk-reward ratio. The second take profit level is set at 183.399, providing a 1:2 risk-reward ratio.
Please note that trading involves risk, and it is essential to perform your own analysis and risk management before entering any trades. The suggested price levels are based on the analysis conducted at the time of this post, and the market conditions may change.
Wishing you successful trading!
Disclaimer: This post is for educational and informational purposes only and should not be considered as financial advice. Trading in the financial markets carries a significant risk, and past performance is not indicative of future results.


Tweezer Double Top DropI have been noting how over bought gold is for sometime, I think we finally got that blow off top that we needed before going short. I expect this 3 day candle to set near or below the current price unless we get crazy adverse fundamentals. If we set a tweezer top, this will be short term bearish. Not financial advice, DYOR.

GOING LONG IN GBPUSD | Trading StrategyBullish Indications (BIASED: LONG)
1. Higher Highs and Lows
2. Tweezer Bottom is found on Green Support Line
3. Price gives significance of 0.236 fib level as well as Higher TF Support
4. GBP Index is Bullish & DXY is Bearish
5. The previous 3 December was bullish
6. Bullish Divergence on 1H and 2H TF
Bearish Indications
1. Break Trendline
2. Red candle is forming on 1M TF

Going LONG EURJPY By Trading StrategyBullish Indications
1. Higher Highs and Lows
2. Tweezer Bottom and Bullish Engulfing on HL
3. Break 0.5 fib support level
4. Break Upper Resistance Trendline
5. Formation of Bullish Flag
6.12 out of 16 years December remains bullish
7. Trend is not mature enough to make it a reversal
Seasonal Data for the Past 15-16 Years
Dec-06 => Green
Dec-07 => Green
Dec-08 => Green
Dec-09 => Green
Dec-10 => Red
Dec-11 => Red
Dec-12 => Green
Dec-13 => Green
Dec-14 => Red
Dec-15 => Green
Dec-16 => Green
Dec-17 => Green
Dec-18 => Red
Dec-19 => Green
Dec-20 => Green
Dec-21 => Green

DJI/ SPX - expect near term volatilityWith FOMC uncertainty coming up this week, and the indices hitting into near term trendline resistence, some volatility will not be surprising in the next few days.
Among the 3 indices, DJI has been the strongest of late.
On the monthly timeframe, we can see a few rather bullish signs:
1. a "tweezer bottoms"
2. bullish engulfing candlestick
3. bullish divergence between price and RSI playing out. However, divergences usually translate into just a short term reversal (lasting 1-3 candlesticks) and may not be a longer term trend reversal. Still, when seen on a monthly chart, this could mean 1-3 months of "upside").
A pullback at this junction is not unexpected but what is important is to watch for the amount of pullback. Any pullback that within 50% fibonacci retracement of it's recent strong upswing AB is within "acceptable" limits.
However, anything is possible. Let's see how it will play out this week especially after FOMC this Wednesday.
Disclaimer: Just my 2 cents and not a trade advice. Kindly do your own due diligence and trade according to your own risk tolerance and don't forget that money management is important! Take care and Good Luck!

STAR HEALTH giving BULLISH signshey guys
STAR HEALTH stock was moving in a pattern called
TRIANGLE PATTERN
this stock has tried to cross this pattern
but it has failed everytime ,
But now I think that this stock will break this pattern
BECAUSE
1. A TWEEZERS FORMATION
2. 20 DAY EMA IS ABOVE THE 50 DAY EMA
3. A BIG GREEN CANDLE IS MADE
due to these reasons ,
this stock is good for trade
and can give you high rewards
😀

NZDCAD 78.6% RETRACEMENT. LONG POSSIBILITY. Our SHORT PROJECTION has ended with a deep 78.6% Retracement. With the New Month. We are looking to LONG the Pair. Looking for best entry most likely coming week. We have Tweezer and Doji on MN.

NQ - Bull underway?Both the S&P500 and Nasdaq100 have formed bullish "tweezers" on their monthly chart.
While the S&P has stopped short at a potential resistance around 4170, NQ however has surpassed it's near term resistance of 13000. Hence NQ's original resistance (12900-13000) is now potentially a "support" zone.
The odds have increased that we are no long in a "bear market rally" but instead I am more convinced a new bull has started as can be seen from many stocks that have been forming bases (round bottoms, inverse Head & Shoulders, Adam & Eve patterns etc) and breaking out of these bases. Pullbacks on the way up is inevitable, and any pullbacks that are less than 10% from the most recent high (or do not breach near term supports) is a sign of strength.
I will not be too surprised to see market taking a breather (aka pullback within 10%) sometime this month and when that happens, it could be an opportunity to long. On the flip side however, I will stay very cautious again should NQ breaks below 12800 in the near term
Disclaimer: Just my 2 cents and not a trade advice. Kindly do your own due diligence and trade according to your own risk tolerance and don't forget that money management is important! Take care and Good Luck!

NQ - Tweezer BottomI posted on 7th July that there was a potential bullish divergene on the monthly chart of Nasdaq, and it has since come true. What is interesting is that we are now seeing a potential "tweezer bottom" on the monthly as well (both bullish).
The daily chart has been trading within a rising channel. With FOMC out of the way, there is a good chance for NQ to reach 13000 in the near future. Has the market turned the corner for good after hitting a low of 11,000 on 16 June? We won't know for sure but I would be a bull rather than a bear in the near term. Watch for market reactions to earnings of the big boys (namely FAANG stocks and take the cue from there.
Disclaimer: Just my 2 cents and not a trade advice. Kindly do your own due diligence and trade according to your own risk tolerance and don't forget that money management is important! Take care and Good Luck!

LITECOIN to Take $19 Billion From The TOTAL2 Altcoin MarketcapWe have a Bullish 3 Line Strike as well as a Tweezer Top Visible on the Monthly Timeframe which would Currently put LTC on a path to take atleast a 3.7% Market Cap Dominance over the Total2 Crypto Market Cap which at TOTAL2's current USD value would put LTC at a Market Cap of atleast $19 Billion which is a little over 11 times more than it's current Market Cap; Assuming that the Circulating Supply of LTC remains near where it is, that would imply that the LTC/USD price will go up to around $584.85 per coin of this TOTAL2/LTC chart were to play out.

Tweezer Tops Candlestick (Learn Candle)The Tweezer Top pattern is a bearish reversal candlestick pattern that is formed at the end of an uptrend. It consists of two candlesticks, the first one being bullish and the second one being bearish candlestick. Both the tweezer candlestick make almost or the same high.
Example on this chart
APE/USDT

ECOFIRS form beautiful tweezers bottom formationGann Support: 0.37/0.34 | Resistance 0.40|0.43
Current price near the resistance. Target price after break the resistance is 0.43.
Tweezers bottom pattern form last week which indicates possibility of bullish trend.
Based on MACD analysis, buy before or on overlapping of the two lines.
Analysis based on my hope only. No need to trust this analysis.

RISKY 10% DOUBLE TOPS TRADE ON THE EURO AUDThis analysis shows the main factors behind the Short Position opened on the EURO AUD. These include
1. The Formation of Double Tops on the Daily Chart.
2. The Formation of a Pennant Setup on the Daily Chart.
3. The expected move towards major Support within 3 Days.
4. The expected move towards the Pennant Support in 7 to 14 Days.
The market provided a strong Tweezer Top to indicate the start of U-Turn on the Daily Chart, which would lead to completion of the Double Tops Signal. Once completed, it will take us lower towards a short-term Support that can be used for our first target. Thereafter, we can wait until the market provides us with another setup to trade towards the Support Boundary of the large Pennant Consolidation.
Duane
Swing Trading Master

TU | Descending Breakout | Tweezer Top Entry @ Pullback / RetestTU | Thailand SET Index | Food Sector | Chart Pattern & Price Action Trading
Descending Triangle Breakout with Bearish Tweezer Top Candlestick pattern - Wait for Entry @ Pullback at retest position
Double Bottom & Top
RSI strong bullish signal
MACD about to cross the baseline 0
Trade with affordable risk ratio 3:1
Always respect your stop-loss
Good Luck
DP

AUDCAD rejected at resistance and headed lower.
Since it's multiyear high in Feb, AUDCAD created lower lows and lower highs in April and has continued bearish ever since with a string of consecutive lower highs and lower lows.
We have 2 clearly defined and repeatedly respected trendlines headed lower, created a broadening descending channel.
Price has has multiple attempts to break through this resistance since December 23rd and has failed, most recently with a tweezer top.
Overall this looks like a great opportunity for a high R short with a stoploss above the trendline/tweezer high.
This is not financial advice, you are responsible for your own trading decisions.
*** LEAVE A LIKE AND FOLLOW IF YOU ENJOYED THE IDEA ***
I will respond to any and all comments below


Potential 🦈GBP/CAD - Potential Shark landing on the DL and a nice OB, trading with the HTF PA here, we've had multiple BOS + trading away from the tweezer top from the Asia high.
Let me know your thoughts!

EURUSD - Bearish SharkIf you have watched my video analysis you would have known that there is a Bearish Shark on the 1-hourly chart as well.
I'm going to squeeze the stop-loss level as there is the tweezer top that allows me to do that.
