TWT Usdt - 4H🙋 Hello my friend ;
✅ As you may know, Trust Wallet Token < TWT > is So Potential ..
☑️ it`s on the side Chart pattern, but Sooner or Later It will be Explode ..
✅ Put It On your #Watchlist ..
☑️ Thank You For Your Consideration ..
BINANCE:TWTUSDT
TWTUSDT

#TWT, #TrustWalletToken UpdateA quick look at #TrustWalletToken (#TWTUSDT, #Binance, 4HR):
Price broke the upper resistance of the pennant pattern on April 4 with a nice volume spike.
Since then, we missed TP1 by a $0,01 and lost support at the $0,80 level.
Currently, we are testing support at $0.74. If it manages to hold and push higher through resistance, we could see #TWT resume its path towards T1. If not, price might go back down and try to rebound from the EMA200, or in the $0.65-$0.62 range.
To read more about TWT on CoinMarketCap, click here .
What do you think?
Still learning here, so any constructive feedback and positive vibes to improve my analysis are welcome.
But if you enjoy my chart, please like, comment or follow me. :)
Thank you and Happy trading!
------------------------------------------------------
Needless to say, this is not financial advice!


TWTUSDTExpecting a breakout to ATH, not hoping it, not wishing it, I don't care. TA is clean and simple. So let's see.


Target 0.7575Following 4h chart
There is a cup & handle formation and already got the confirmation.
TP 0.7575
SL 200 EMA or 0.4865

Ready for a long positionhey guys
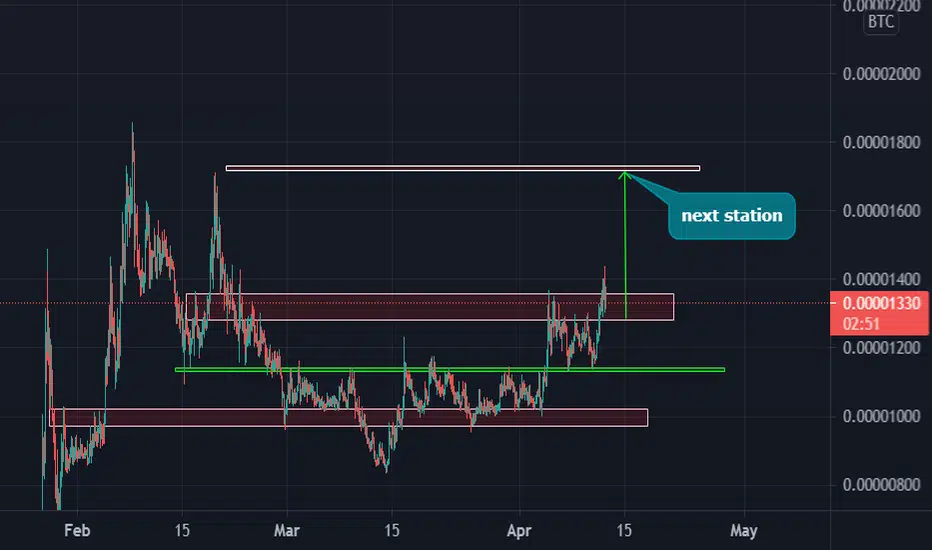
TWT/BTC is in a good condition for a long position imo
you can buy it around 12 with targets and sl on chart
good luck


TWTUSDT +30% ProfitBinance TWT
look at chart and you will see exact SL and TP price
for buying im personally wait for a pullback i jump in around 0.5435

TWTUSDT Long opportunity with proper Risk/RewardHere we have a bullish channel and a nice breakout following a clean pullback. the price can get to mid-line.

TWT_USDTI think TWTUSDT is very good for short term trade and same as altcoins can be pump more than Bitcoin and see will see the next resistance box.


TWT/BTC Technical Analysis Chart looking bullish#TWT/BTC TA Update:-
#TWT chart is Looking good.
As per chart there are two bullish patterns we can see.
First Bullish pattern is Bullish Flag and 2nd Bullish pattern is Inverse head & Shoulder.
So good time to entry.
Entry:- 1050-1110 Satoshi
Targets:- 1398/1706/2313 Satoshi
Stop Loss:- 999 Satoshi
Please click LIKE button and Appreciate my hard work.
Must follow me for latest crypto real time updates.
Thank you.


TWTUSDT IS IN BUY AREA!!TWTUSDT IS IN BUY MARKET ZONE.
SHORT TERM TARGET IS 0.75
HOLD IT FOR HIGHER TARGET ABOVE 1USDT.


twt can reach to $1.1have a good triangle if can successful breakout 90% pump
buy and hold midterm
good regards


TWTUSDTHello to you all. Mars Signals team wishes you high profits at all times.
The price has formed an inverse head-and-shoulders. As you can see, the price now is at the bottom of the trend line drawn. We expect it to go up and break the target prices.
Warning: This is just a suggestion to you and we do not guarantee profits.
Wish you luck!

TWTTWT is one of the most promising coins and after correcting its price, now with the formation of the trend line and the formation of the triangle, the trend is changing towards ascending.
