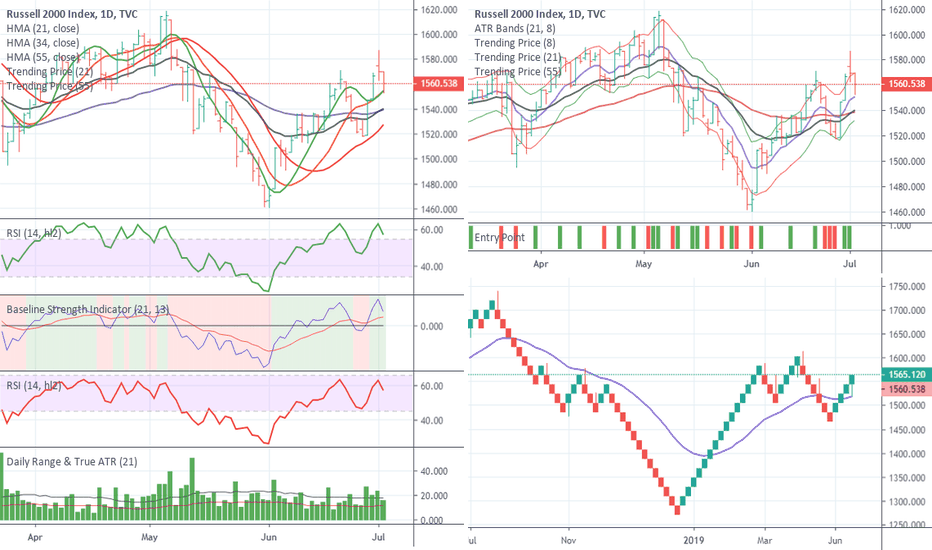
Russell 2000 - Long playPrice stopped (1) right at Pivot S1 and (2) just above Fib 0.876. RSI is also aligned with previous bottom. If a multi-day uptrend happens from here, the 3x ETF will gain more than 3x by the end of the trend due to positive compounding. If choppy volatility instead continues in both directions, then holding IWM would have been the better bet. Survey: Which would you buy here - TNA or IWM?
TZA
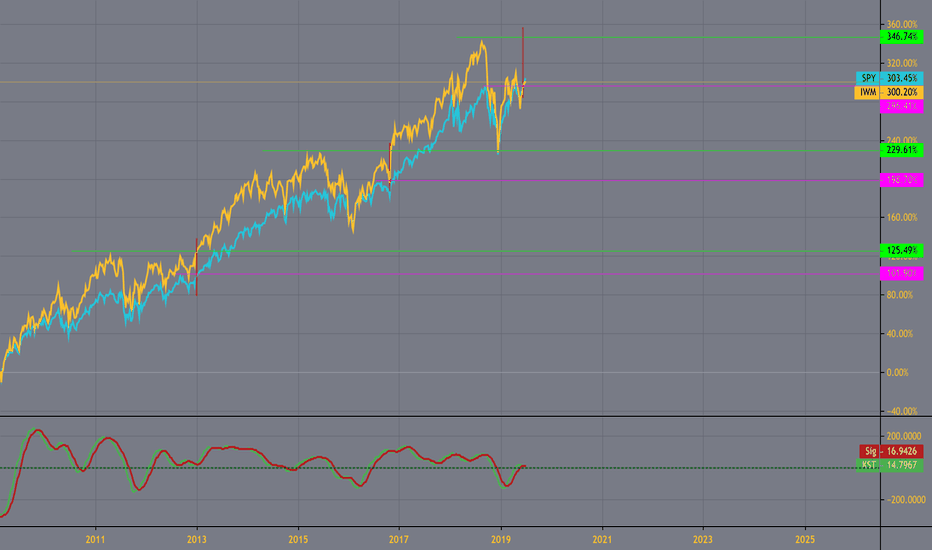
Houston- we have a problem.... iwm vs spyIWM has been the spy's faithful partner up chart since 2009. This run is different. I think we may be destined for failure.. until iwm can muster the strength to breaks its trend.
Suppose there's 2 possibilities here. either spy's gonna retreat, or iwm needs to make up some ground.. has a large distance to make a new high. Given circumstances i think retreat makes most sense.
Caution is warranted given conditions and charts history....
GOOD LUCK THIS WEEK!
Monitor with cautionConsolidation has been established with a range of 1548.12 - 1586.77
For the technicians out there who like patterns. A Pivot High was just completed. So, look at the bottom of the consolidation range for your breakout signals.
Anchor bar on the consolidation is a positive bar which suggests a 70% chance of breakout to the top.
Coupled with the pivot high - I would decrease that down to 30%.
This is a mixed bag of directional signals, suggesting the market hasn't decided yet.
1987 Crash? Free Video--Must SeeAs many of you know, Woody Dorsey (my partner) has been advising some of the largest financial institutions in the world for over 40 years. I had a conversation with him today and he said he is seeing a very similar pattern that took place during the 1987 crash, which he predicted 3 weeks in advance. That call pretty much set in a class of his own on wall street and he remains as one of the best market timers in the world.
In the video link below, I go over what has taken place as well as where we turned today and why it is important. Don't be fooled by this massive short squeeze. It is coming to and end maybe we are on the verge of a 1987 crash. Enjoy--G
$IWM $RUT $TNA $TZA Small Caps About to Lead The Markets!While the large-cap stock indexes like the $SPY $SPX $QQQ $DIA have been running higher, they are now at resistance and should stall out or at least slowdown. Small-cap stocks have been building a base for a mega rally that could make the large-cap run look like chump change!
See more analysis on the small cap sector: www.thetechnicaltraders.com
Small caps lead rallies and sell-offs, this is no different.Skilled traders watch all the charts to assist them in identifying characteristics that can assist them in understanding price moves, key support/resistance levels, and price patterns. This IWM chart should be on everyone’s radar at the moment. Where the IWM finds support, so will the other US stock market indexes.
The IWM setup indicates we may only see a 5~7% downside price swing before support is found. We’ll have to watch how this plays out over the next few weeks/months to determine if the $144.25 level is true support or if the lower $137.00 level will become support. Either way, the downside price swing appears poised to unfold over the next few days/weeks – so be prepared.
I authored a research article about this pattern setup on February 17, 2019. You can read it here.
Just admit that gold is at resistance and bearish!Just admit that gold is at resistance and bearish!
The chart speaks for its self.
The Russell 2000 ETF continues to deliver critical technical and longer-term price patterns for skilled technicians. Combining the IWM chart with the Transportation Index, Oil, Gold, and others provide a very clear picture of what to expect in the immediate future.
Recently, we posted a research article about the Head-n-Shoulders pattern setting up in the $INDU. Again, the IWM chart is also showing a very clear Head-n-Shoulders pattern with critical resistance near $159.50 and support near $144.25. Our researchers, at Technical Traders Ltd., believe this right Shoulder will prompt a downside market move towards support near $144.25 before a downward sloping wedge pattern sets up. This first downward price leg will setup and congesting wedge formation that will, eventually, break to the upside and drive market prices higher.
I also posted a Russell 2K ( IWM ) forecast here www.thetechnicaltraders.com
Small Cap Stocks with Bearish daily and weekly chartsThe Russell 2000 ETF continues to deliver critical technical and longer-term price patterns for skilled technicians. Combining the IWM chart with the Transportation Index, Oil, Gold, and others provide a very clear picture of what to expect in the immediate future.
Recently, we posted a research article about the Head-n-Shoulders pattern setting up in the $INDU. Again, the IWM chart is also showing a very clear Head-n-Shoulders pattern with critical resistance near $159.50 and support near $144.25. Our researchers, at Technical Traders Ltd., believe this right Shoulder will prompt a downside market move towards support near $144.25 before a downward sloping wedge pattern sets up. This first downward price leg will setup and congesting wedge formation that will, eventually, break to the upside and drive market prices higher.
We authored a research article about this pattern setup on February 17, 2019. You can read it here.
Skilled traders watch all the charts to assist them in identifying characteristics that can assist them in understanding price moves, key support/resistance levels, and price patterns. This IWM chart should be on everyone’s radar at the moment. Where the IWM finds support, so will the other US stock market indexes.
The IWM setup indicates we may only see a 5~7% downside price swing before support is found. We’ll have to watch how this plays out over the next few weeks/months to determine if the $144.25 level is true support or if the lower $137.00 level will become support. Either way, the downside price swing appears poised to unfold over the next few days/weeks – so be prepared.
Please take a minute to visit www.TheTechnicalTraders.com to learn how we can help you find and execute better trades in 2019. We have already positioned our clients for this move and we believe we can help you stay ahead of these markets.
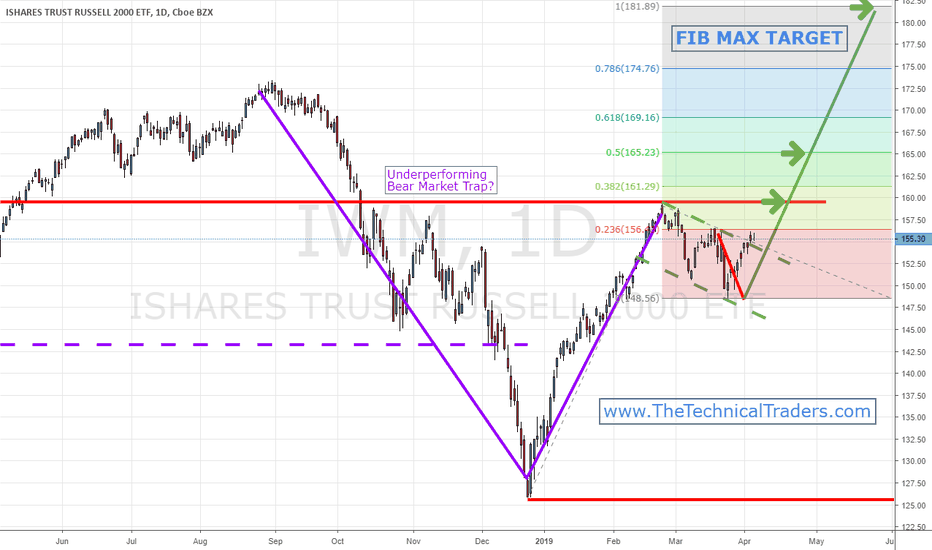
Small Cap Bear TrapThe Russell 2000 ETF continues to deliver critical technical and longer-term price patterns for skilled technicians. Combining the IWM chart with the Transportation Index, Oil, Gold, and others provide a very clear picture of what to expect in the immediate future.
Recently, we posted a research article about the Head-n-Shoulders pattern setting up in the $INDU. Again, the IWM chart is also showing a very clear Head-n-Shoulders pattern with critical resistance near $159.50 and support near $144.25. Our researchers, at Technical Traders Ltd., believe this right Shoulder will prompt a downside market move towards support near $144.25 before a downward sloping wedge pattern sets up. This first downward price leg will setup and congesting wedge formation that will, eventually, break to the upside and drive market prices higher.
We authored a research article about this pattern setup on February 17, 2019. You can read it here.
Skilled traders watch all the charts to assist them in identifying characteristics that can assist them in understanding price moves, key support/resistance levels, and price patterns. This IWM chart should be on everyone’s radar at the moment. Where the IWM finds support, so will the other US stock market indexes.
The IWM setup indicates we may only see a 5~7% downside price swing before support is found. We’ll have to watch how this plays out over the next few weeks/months to determine if the $144.25 level is true support or if the lower $137.00 level will become support. Either way, the downside price swing appears poised to unfold over the next few days/weeks – so be prepared.
Please take a minute to visit www.TheTechnicalTraders.com to learn how we can help you find and execute better trades in 2019. We have already positioned our clients for this move and we believe we can help you stay ahead of these markets.
US MAJORS COMBINED INDEX PAINT CLEAR PICTUREPrevious significant market top that formed a mini double top and drop looks to be happening again.
Monday we should see another gap down and continued follow-through selling, or at least next week which should create a spike in the vix as shown here: www.thetechnicaltraders.com
SPY into the crystal ballAll I can say is, what a Bounce! Well done Mr. President and institutions for keeping the Bears honest, btw: shout out to the real Mr. P! Unfortunately, you cannot prop up a market forever, and nature’s course will always find a way. I believe from this point on you can expect the market to be in a perpetual downtrend with lower highs and lower lows over the long term (next few years). I am not predicting a 'fell swoop' quick crash starting tomorrow, but more of an orderly sell-off until towards the end of the market cycle when everyone pushes the panic button together. You can see from the last two crashes how they behaved in this manner. Note: this trade idea is for a long term trading/investing. It is not guaranteeing that we will start the steep selling this week, although we certainly could. We could even stay at this level for a month; we don't really know but I would say better safe than sorry, establish your shorts and manage risk off of the 282 major horizontal resistance.
This market is about 6% overextended from where it "should" have turned around, based upon technical’s and their highest probabilities being at 262 reversal. I say "should" because there are no should's in the market, just what the price action does, and that is the only absolute truth. This is great for people who have been long up until this point. In a bear market, those gains can be taken out very quickly as we have seen 2 years of gains taken out in one month time (Dec 3- Dec 25 -16.6%) ...C'est la vie #BearMktLife
Fundamentals
I am not in a camp of looking at recent changes to influence these markets' fundamentals. These markets fundamentals are much more long term and lagging then people realize. These started 10 years ago after our last crash and how we have fiscally operated this country since then, during the 'biggest bull run in history'. Quantitative easing, Excessive Fed printing, bailouts, and 0% Fed interest for 9 years, etc etc. This market will not be saved from any of the following: trade deals with China, or how Powell "acts" at any given press conference, Government shutting down or reopening, Korea, AT&T merger, x, y, z... blah bla-blah. BTW- Re: China trade deals may conclude soon, which could provide initial strength as the deals are being put together and finalized. This could spike price up initially. But I am still of the camp that, "buy the hype sell the news" is prevalent human psychology. When an Unknown becomes a Known, the mystery is taken out of the market, and the only thing left to do is sell. Be careful of that one.
BTW- Fed and Trump are enemies.. Remember that.
Technicals
The tops that were put in during September, printed an RSI level that had only been achieved 3 other times in the history of the stock market, one of which was just before the great depression crash, the other two, strangely enough, were actually quite uneventful: 1929, 1955, 1996.
We have bearish divergences on the 4-hour chart: this officially happened today and started Feb 25th.
We have volume steadily decreasing since the inception of this bounce, still showing us the signature of indecision & reversal, as price goes higher on decreasing volume.
Our weekly stochastic is in the oversold area, I should have been watching this indicator more in the recent past, as opposed to the daily stochastic.
We have a nice clear ascending wedge in the white wedge pattern; we have finally broken this pattern.
Our Next horizontal support is at 275 its break if you missed the top and want to wait for confirmation then that is a level to consider
Candle: today we are creating a bearish engulfing candle: typically reversal
The above trades had very clear technical confluence and great places to manage risk off of. They have been my bigs trades up until this point, and have been majorly successful. This is number 3 on the chart because it is the 3rd BIG trade to take. As with the other trades, the importance of this area can only be seen as significant once enough time has passed as well as your opportunity.
_________________________________________________________________________________________________________________________________________________________________________
In the past 6 months of watching these markets closely, I had identified and posted some very high-quality trades listed on this chart, represented by 1 & 2 on the chart and linked below respectively.
*Please See the attached "Related Ideas" at the bottom for a walkthrough highlighting the past 6 months of this market accompanied by my analysis*
The above trades had very clear technical confluence and great places to manage risk off of. They have been my bigs trades up until this point, and have been majorly successful. This is number 3 on the chart because it is the 3rd BIG trade to take. As with the other trades, the importance of this area can only be seen as significant once enough time has passed as well as your opportunity.
The idea is this: we could be looking at the first bear market rally of this new bear market, which would essentially make "whatever area it tops at" the last high before a market crash/bear market. The technicals I am using today are more about market cycles and their behavior more than a certain trade set up. Since we are breaking down out of support @278.65 we could assume that a "local" top has been put in. We cannot say for certain if it is the ultimate top for the next few years or not as that requires a crystal ball. But I would say that the probabilities are highly stacked in favor of this being just that. The final top of a long arduous bear crash, with stops set just above these highs to manage your risk. If my final target at 157 is hit then this trade would have a risk to reward of 1:22 (1.8% Risk for 44% Gain). If you are using long term SQQQ options then the expected profit will be around 20x of your account from here to the final destination. If you want to close out of any shorter term contracts at our double bottom (235) in approx 3 months for a 5x on your account, then that could be wise. Then you would wait for that level to rebreak before reentry. After 235 breaks eventually we will look to close some positions within the 2015-2017 consolidation levels 212-185. From our current levels, if we get above 282 then you can close out of your short positions with a minimal loss, and look for a reentry higher possibly 286. If we break the all-time highs at 294 and live above them for a few weeks to a month, then we can assume that the bear market will not ensue and that I was in fact terribly wrong on this enormous trade plan.
It's as easy as 1, 2, 3.
Happy Trading Friends,
PipMiester
Please look at my related ideas attached below: very relevant information.
The ideas with "Historic" in the title were not meant to be public ideas, but I decided to make them publically available for this post.
Btw: Cudos to you tradingview bears over the past 6 months.
Shout out to Krown- I would be much less than half the trader I am today without your guidance that you graciously offer for free daily.
*This is not financial advice, as I am not a financial advisor. I am not registered with any agency and all assets traded have maximum loss potential. The information presented is for educational purposes only highlighting the differences between market cycles.
RUT moves down as expected and is not ready for bottoming yetOn a micro level Russell needs five waves down off the top made at 3 PM last Friday. So far it reached the bottoming area for the micro wave ( iii ) down.
That means that after corrective a-b-c shaped move up it will continue moving down in direction of the green target box


