Uber : Wait for a moment to buyIn daily the trend is still bearish but there are goods signs to change this trend.but for me it is not yet a moment to buy and I suggest to wait for the breaking by the price the SSB (46,26) and the chinkou cross the cloud
Uber

UBER Can Ride To On Bullish Reversal (M Patterns Formed)Traders,
Uber has been falling down and has not completed an M pattern. There is an extended version of the M pattern available below where we have better FCP Buy Zone. If the upper FCP (Fibonacci Confluence Zone) gives a breakout we can initiate a position and if and when it comes down to the lower FCP zone we can add the position.
Targets are market in white horizontal lines.
Rules:
1. Never trade too much
2. Never trade without a confirmation
3. Never rely on signals, do your own analysis and research too
✅ If you found this idea useful, hit the like button, subscribe and share it in other trading forums.
✅ Follow me for future ideas, trade set ups and the updates of this analysis
✅ Don't hesitate to share your ideas, comments, opinions and questions.
Take care and trade well
-Vik
____________________________________________________
📌 DISCLAIMER
The content on this analysis is subject to change at any time without notice, and is provided for the sole purpose of education only.
Not a financial advice or signal. Please make your own independent investment decisions.
____________________________________________________

UBER [LONG] A lot of great indicators firing for UBER on the daily and weekly.
Looks a great LONG entry, with divergences, support and heavily oversold levels.
As always prepared for further downside if it comes.
** NOT Financial or Investing advice **

Analyzing My Part Time Employer - UBERNYSE:UBER
Is a great way to make money part time, especially if you can do it to invest that money in to the market.
Why do I do Uber?
That's simple... I do not trade with money I cannot afford to lose. I love investing but I also love paying my debts. Unlike China... ok that was pretty weak.
Anyway... This demonstrates buying the wrong break out and what can happen if you are caught in that zone. The strength looks good with a massive upside especially in an economy where work culture is beginning to shift dramatically and the gig economy is becoming more of a household choice rather than a regular side job.
I am long on $UBER as long as regulations stay in favor of the gig economy, but is imperative that we break above our upper wedge resistance for a more sustained breakout move.

Does Uber waiting for us at the support level?reversal pattern in 5-minute chart:
Market Cap: 72b
Shares Outstanding: 1.8B
Average Trading Volume (10 days):21M
Shares Short: 79.5M
Short Interest(%): 5%
Days to cover: 3.8
Change in Short Interest:+5%
Ownership Breakdown:
Institutions:
General Public:
Hedge Funds:
Individual insiders:
Sum:
Option profile:
Total OI: 2.2M
Put Call Ratio:0.34
Put OI:
Call OI:
Highest Put:50
Highest Call:45
Max Pain: 43
Open Int (30-Day): 2.2M
DISCLAIMER
I’m not a certified financial planner/advisor nor a certified financial analyst nor an economist nor a CPA nor an accountant nor a lawyer. I’m not a finance professional through formal education. The contents on this site are for informational purposes only and do not constitute financial, accounting, or legal advice. I can’t promise that the information shared on my posts is appropriate for you or anyone else. By using this site, you agree to hold me harmless from any ramifications, financial or otherwise, that occur to you as a result of acting on information found on this site.
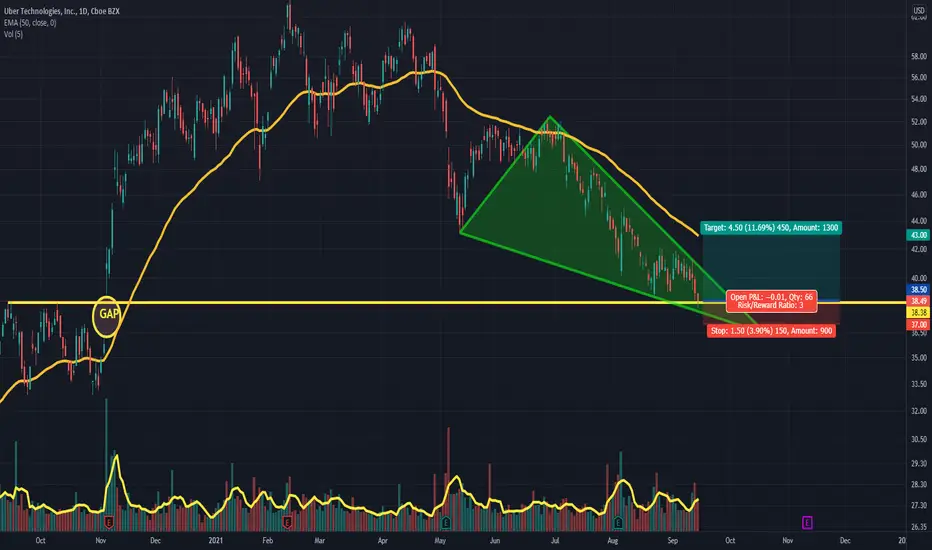
Uber: Pre-market running. Gap fill or trend up?Uber resisted recent market sentiment and stayed green at the end of the day. Now, it's up with a 5% lead after some good news.
Now, as a day trade, I'm looking for a gap fill down to buy the bottom or a slow trend up.
The yellow lines are s/r from weekly lines. These can be key supports and predictably the first line it will test if we see a downwards motion on open.

A good level for buying UBERThe price of UBER is now at the level of the former resistance, which now acts as support (mirror level).
In addition, the price is also at the 1.618 expansion level from the first wave of the downward movement.
The short takeaway, which was formed in the local accumulation, also acts in favor of the purchase.
You can buy with a small stop at 38 (-5%) and a target at 48 ($19.8)

UBER Daily TimeframeSNIPER STRATEGY
This magical strategy works like a clock on almost any charts
Although I have to say it can’t predict pullbacks, so I do not suggest this strategy for leverage trading.
It will not give you the whole wave like any other strategy out there but it will give you huge part of the wave.
The best timeframe for this strategy is Daily, Weekly and Monthly however it can work any timeframe above three minutes.
Start believing in this strategy because it will reward believers with huge profit.
There is a lot more about this strategy.
It can predict and also it can give you almost exact buy or sell time on the spot.
I am developing it even more so stay tuned and start to follow me for more signals and forecasts.

UBER - Daily - Bounce point or hitting Buy point 2?2 buy points will UBER bounce? Already having RSI contradiction

UBER - Buy - PT $60RSI indicator showing that UBER is oversold. We see a reversal to $60 - $63.
For educational purposes only.

$UBER Bullish DivergenceClosed out last Uber trade with profits. Re entered here as I noticed 11/19 calls sweeping.
Indicators showing bullish divergence and trading well below respected AVWAP.
Looking for a reversal and move back up towards the AVWAP/middle of channel. Run up to earnings also in play with the 11/19
11/19 45C 1.77 avg 21K OI
11/19 47.5C 1.2 avg 4K OI

Short $UBER CMP $39.45Short $UBER CMP $39.45 Downtrend continues. Trading below most of the moving averages


Your $UBER is waiting$UBER at the bottom of the channel with MACD ready to cross, RSI curl, and bullish flow yesterday.
Went long with the $47.5 11/19 Call
Courtesy of @jpgonzalez93

Buy Into Weakness On Uber Technologies (NYSE: $UBER) 🙌🙌🙌Uber Technologies, Inc. develops and operates proprietary technology applications in the United States, Canada, Latin America, Europe, the Middle East, Africa, and the Asia Pacific. It connects consumers with independent providers of ride services for ridesharing services and other forms of transportation services, including public transit, as well as connect riders and other consumers with restaurants, grocers, other stores, and delivery service providers for meal preparation, grocery, and other delivery services. The company operates through four segments: Mobility, Delivery, Freight, and Advanced Technologies Group (ATG) and Other Technology Programs. The Mobility segment provides products that connect consumers with mobility drivers who provide rides in a range of vehicles, such as cars, auto rickshaws, motorbikes, minibuses, or taxis. It also offers Uber for Business, financial partnerships, transit, and vehicle solutions offerings. The Delivery segment allows consumers to search for and discover local restaurants, order a meal, and either pick-up at the restaurant or have the meal delivered, as well as offers grocery and convenience store delivery, and select other goods. The Freight segment connects carriers with shippers on the company's platform and enable carriers upfront, transparent pricing, and the ability to book a shipment. The ATG and Other Technology Programs segment engages in the development and commercialization of autonomous vehicle and ridesharing technologies, as well as Uber Elevate. The company was formerly known as Ubercab, Inc. and changed its name to Uber Technologies, Inc. in February 2011. Uber Technologies, Inc. was founded in 2009 and is headquartered in San Francisco, California.

$UBER Time to short, or is it? California's prop 22 was found unconstitutional by a supreme court judge late last week, news that were sort of expected since the bill already had plenty of discrepancies. Despite the news and what that means for UBER specifically, I am more interested in how this stock has moved since the bill passed.
Pretty noticeable at first glance, despite missing EPS, on November the stock started an impulsive move leaving a gap behind and that it's closing to nowadays price. If we look at it from a bearish point of view, the .618 was strong resistance above which indicated another wave down towards the 1.618. Interestingly enough, the stock is now below March lows' VWAP and it's fast approaching the IPO VWAP. Very important to note that the 8MA is extended from price action, so a bounce in the near term is not out of the question. Now, will it be at the IPO VWAP? Or will it close below, sending it lower towards the gap and the 1.618? One thing is for sure, these two VWAPs will provide all the information we need in order to short efficiently or to prepare for some choppy price action.

UBER reversal in progressUBER looking prime for a quick run back to the upper $40's. Looking for $47 by 8/20. Playing $46 calls expiring 8/20.
Uber Road to $80I think this is wave 4 of a 5 wave move, we are near the top of wave 1 which is a great entry.

Uber pre-earningsA lof of information in the chart for uber pre-earnings. The earnings call is after hours tomorrow 08/04/21.
Few gaps that need filling, which gets filled first?
MacD looks bearish and bullish on diff time frames.
Could pump or dump.
What do you think?

Post Earnings 2 GAPS filled 1 to go!2 out of 3 gaps have filled in the same day, post earnings which uber beat. There is one gap left to fill and that gap is a bullish gap!
Target $46.11
Resistance levels
($43.65/30m) lowest resistance
($44.61/30m) middle
($45.13/30m) highest resistance

UBER: Complete analysis (H, D and W charts).Hello traders and investors! Let’s see how UBER is doing today and do another complete Multiple Time Frame Analysis (MTFA)!
The stock hit a top at $ 44.64, and now it is doing a pullback. We have two good support candidates in the 1h chart, which are the 38.2 and the 61.8% Fibonacci Retracements .
The 38.2% is at the 21 ema too, and the 61.8% is at the $ 41.86, which we’ll talk about later.
If UBER reacts near these support levels, it could trigger the pivot point at $ 44.64, reversing the trend for good in the short/mid-term.
Today’s candlestick pattern is called Bullish Engulfing , a bullish reversal pattern, just above the support at $ 41.86 (no, it is not the time to talk about it yet).
The volume is good, and if we defeat today’s high ( coincidently, the pivot point in the 1h chart ), the bullish pattern will be triggered. If we lose today’s low, then the bullish thesis will be invalid (or at least, delayed).
Ok, do you remember the $ 41.86? This point was the pre-covid ATH , and a previous resistance on UBER, which now it is working as support in the weekly chart.
What’s more, we have a Hammer candlestick pattern, which might reinforce our bullish reversal thesis. Surely, it is an interesting stock to keep in our radar.
If you liked this analysis, remember to follow me to keep in touch with my daily updates.
Thank you very much.

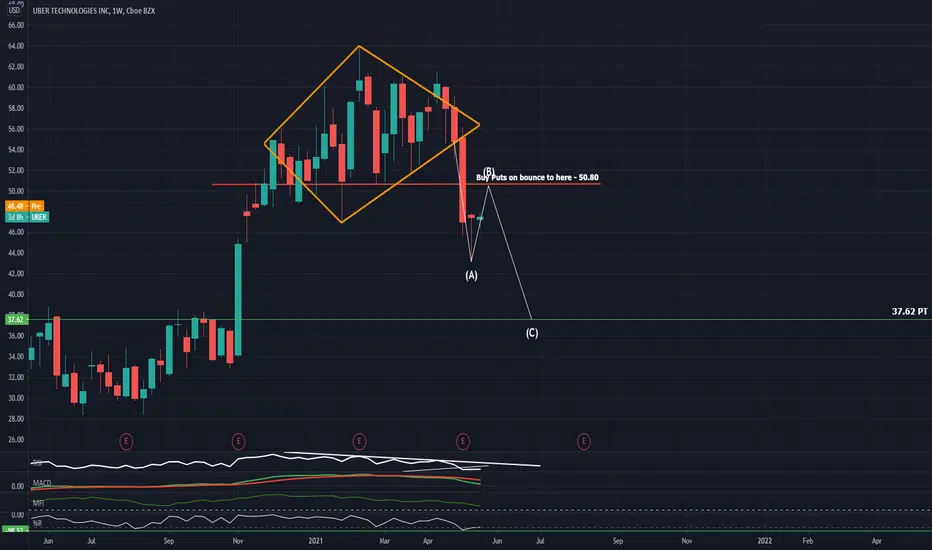
UBER Price targetThe head and shoulders pattern is one of the most reliable trend reversal patterns.
After a Head and Shoulder chart pattern, UBER will now most likely test and bounce from the 38.80usd resistance that turned into support.
I`m looking forward to read your opinion about it.
