$UBER longs need to not fail in this res zone, hold the fib!Looking at $UBER we have made a significant long breakout of angular res but we really need to not fail in the same spot as last time. Hold the fib zone and keep the momentum hot and we should be approaching ATHs again.
Uber


UBER vs LYFT: A technical comparison.Hello traders and investors! Let’s see what’s going on with UBER and LYFT today. Both stocks are doing some impressive movements, so it is a good time to study them.
First, let’s start with UBER. The stock is doing a phenomenal movement today, but if we look at the charts, it just hit a resistance zone today, the black line at $ 41.86, and now it is doing what it seems to be a Spinning Top candlestick pattern .
Either way, UBER must keep trading above the yellow line at $ 38.59, because if it loses it, a pullback to the 21 ema is expected . But despite the fact UBER is moving sideways since June, it seems the trend is slightly more bullish than bearish, and UBER is trying to defeat the resistance at the black line.
I see the 21 ema as an important support, but the red line at $ 32.89 is another support zone. In the worst-case scenario, UBER would hit the blue line at $ 28.53, but it is way too soon to say this.
Today’s gap could be a Breakaway Gap , and if that’s the case, it won’t be filled so soon. But if it is a Common Gap , then it’ll be filed in the next few days, and UBER will be back to the congestion.
I would just keep an eye on the black and yellow lines for now. Now, let’s see LYFT.
Lyft almost hit the previous resistance at the red line, and now it is dropping sharply. The good news is that it just hit a dual support zone , made by the yellow line (previous resistance) and the purple trendline.
The idea of a Breakaway or Common Gap applies here as well , and if LYFT loses its two supports, we’ll see a sharper pullback ahead, and it’ll probably fill the gap.
Honestly, it seems the bulls will have a hard time now to defeat the resistances on UBER and LYFT, and a pullback would be great for the stocks, and it could even bring some opportunities to buy.
In the hourly chart, there’s a reaction starting on LYFT right now, so the support zone is working so far. UBER is still struggling a lot, but today’s low seems to be a Pivot Point , and if UBER loses it, it'll probably lose the yellow line with it, bringing the pullback we mentioned earlier.
The volume increased a lot today, and both stocks are quite speculative, so let’s be cautious here. Either way, these are the most important points to keep in mind for both stocks, and if you like this analysis, please, support it! And follow me to keep in touch with my daily studies.
Trade well.

Hoag's 80% Value Play-Election "sell the news" (Short)Hoag's 80% Value Play
(Election Day Short-SELL THE NEWS)
Uber looks Toppy, Multiple Potential Dbl Tops
(Unconfirmed)
Reasons for Trade:
1. Have retraced to areas of .618-.786, and to + .786
of its range from IPO high and most recent high, respectively
2.At volume high rn, break back into value, and held for 2 consecutive 30m candles,
suggests price will revisit value low 80% of time. VL is at reload long levels
3. MACD internals Looking weak.
4. Was recently oversold, and is hovering near OS
5. Significantly decreasing buy volume impetus, very telling.
RR 4.22:1
Enter trade at confirmation of M top, at break through .786 level on downside
and acceptance into value at $35.96
Stop set at M Top* at $38.25
Move Stop to scratch at touch of value low near potential reload long levels, $26.30. If accepts into
value low, trail stops, 3 highs/Lows method.
Caveat: This is a short trade in the event of unfavorable election results where rideshare worker's rights (gig economy) is on the ballot in California. NYSE:UBER
For entertainment purposes only, not trade advice. DYOR!

Bearish Swing Trade for $UBERAll data points are described on the chart. Transparent Traders TT Blackbox for the win!

Uber Makes One Stop Lower Before Bulling Break#uber Has been building the final right formation of an inverse head and shoulders over the last week. As we see the triangle starting to tighten we can expect to see a breakout soon. Be cautious of the four hour RSI dipping below 50%, indicating we may see another reset of the RSI before we break to the upside.With Tesla showing interest in automation of public transportation and stimulus funding likely going to companies like Uber and others like it, i remain bulling long-term.

What Is The Wheel Option Strategy?The Wheel is an options trading strategy where first we are selling puts to collect premium. In the instances where we get assigned the stock, we’re then selling calls to collect even more premium.
As you know, I’ve been actively trading “The Wheel” since the middle of the year (2020) and at the time of writing this, have yet to realize a loss.
In this article, (based on a video from August 21st, 2020), I want to talk about a specific “Wheel” trade on UBER where we ended up getting assigned shares.
Wheel Option Strategy Example: UBER
Within The Wheel, there are three trades that can take place.
The first is that we are selling puts.
The idea here is to collect premium and to get assigned stocks at a discount, to buy stocks at a lower price than they are trading right now.
Then once we have the shares, we are selling calls.
So let me walk you through step by step of exactly how it works.
Step 1: Selling Puts
So let’s talk about the first trade that we did here.
For the first trade, we were selling puts, and I want to take a look at the very specific example here.
We sold 7 August 14th expiration, 30 puts at $0.25. So this is $25 per option. 7 of these, times 25 so we collected $175 in a little bit less than one week.
The idea here was that I believe UBER would stay above $30 by this expiration, resulting in me just collecting the premium for the puts I sold.
So let’s review all the trades I’ve taken in UBER through this period:
I have eleven winning trades.
Here is what happened with Uber.
The price dipped below the magic 30. And here’s what happens.
If it would have stayed above 30 we would just collect the premium, be happy, and sell more puts again.
But on the day of expiration, UBER had a sharp sell off dipping below the put strikes I sold.
Step 2: Buying Shares
So we had to buy the shares and this is actually the second part of the trade.
This is what the broker did for us automatically. We bought Uber at 30.
Here’s the deal, for every one put that you’re selling you have to buy 100 shares.
Now, something odd happened here.
So I should have received 700 shares of Uber in my account because when you’re selling puts, it means this means you have to buy at the strike price that you’re selling it.
So since I sold 7 puts, I should have received 700 shares. But for one reason or another, I only received 400 shares.
Kind of a bummer, but it’s okay. Now, this premium, since we sold it, we are going to keep it.
Whenever we sell an option and collect premium, we are going to keep it (the premium) no matter what happens.
So now that I’m the proud owner of 400 shares of UBER at this stage, here’s where the next part of the trade comes in:
Step 3: Selling Calls
This is where now we start the “Wheel” rolling. This is the really fascinating part of the strategy and when it clicks, you’re going to see why I absolutely love it!
With 400 shares of UBER, this means I can now sell 4 calls against my shares, creating what’s called a “Covered Call.”
So we sold four calls at a strike price of 31 expiring August 28th. Again, this article was written based off a video I recorded on August 21st, 2020.
And we sold those for $0.52. This means $52 per one option. 52 times 4 means that we received another $208.
So this is the premium that we received and nobody can take this away from us. We’re not planning to close this trade and buy back this call, we would just leave it open.
So to this point we have received $383.
3 Scenarios That Could Happen With Uber
Now I want to look at three possible scenarios of what happens if Uber closed below $30 on August 28th.
So in a week from now, we want to see what happens if Uber is below $30, if it is between $30 and $31, and if it’s trading at $31.
First of all, the premium that we received for the puts we can keep. I mean, $175 is already ours nobody can take this way. This is in all scenarios here.
We also receive the premium for the calls that we have sold here and that is $208 and nobody can take this away from us.
Scenario 1: Uber is trading below $30
So let’s say Uber drops all the way down to $29.
In this case, on our shares, we would have an unrealized P&L. This is important, unrealized, 400 times $1, would be -$400.
Now the important thing, it’s unrealized because we kind of don’t care at this point, right? Because we’re not planning to sell Uber we are planning to hold it.
At this point, the whole premium collected is $175, plus $208 so it’s $383. This is how much we have realized to this point, but remember in this scenario we would be underwater on our shares (or an unrealized loss).
Now, what we would do here is sell more calls. But we’ll talk about this here in just a moment.
Scenario 2: Uber is trading between $30 and $31
If Uber is between $30 and $31, let’s just say Uber is at $30.50.
We bought Uber shares at $30, and in this scenario, it’s trading at $30.50, so we make 400 x $0.50.
So we’re making $200 on our shares, plus we’re making $383 on the calls and puts that we collected. So this would bring our total to $583. Not bad at all.
Scenario 3: Uber is trading above $31
If Uber is above $31, it doesn’t really matter because we sold 4 calls at a strike price of $31. So this means that we have to sell Uber again at $31.
Yes, if it goes to $33, $35 we cannot participate, and that’s okay.
It’s very likely that Uber stays between $29 and $31, maybe $32, right? If it rallies to $34 good for Uber.
Again we’re talking about the next week that’s what our outlook is here.
If this would happen, we would make $1.
Because we bought 400 shares at $30, and if we have to sell it again at $31, we make 400 times $1. So this means that we are making $400.
This is how much we are making on the stocks, plus the $383 that we received in premium we are going to keep.
This here is our best-case scenario.
So if Uber is below $30 we would sell calls again, and the Wheel would continue.
If it is between $30 and $31, we sell calls, and if it is above $31 we are being called away, so we are getting rid of the shares.
And this means that right now we would start selling puts again.
Wheel Option Strategy Summary
I wanted to show you this, and also very specifically, where we are right now with our Uber position.
If you look at Uber right now, you’ll see that we are making money on our shares and we are losing a little bit of money on our calls that we sold, but right now, we are up $292.
Now we hope that by next week we’re up either $583 or $783, and this would be the win of only two weeks.
This is how the Wheel works, this is how the Wheel ‘turns’.
The trades we are in right now are working quite well. Thus far we have a really great track record.
If you found this article on the Wheel option strategy helpful, feel free to leave a comment below and share it with others who will benefit from reading it.


UBER updatePrice started to converge in an ascending triangle pattern. The pressure seems to be building to break to the upside. Need a solid break through resistance to target higher levels. While markets are a bit wobbly due top earnings season, a break higher is a good signal to buy more.
Please support the idea and share your thoughts on UBER!
Good LUck and Stay Healthy!

Uber 15m Idea Long Options Short termUber is trending great on 1D chart and is looking good on 15m if it copy’s the pattern I marked. Big dip today OCT 21 #btfd

Uber: Bullish Pocket PivotBullish signal based on today’s closing price and volume.
Closing price was trending lower until today
Price closed higher than yesterday
Volume higher than previous 10 days
Price broke above 10 dma (cyan)
Price broke above 20 dma (blue)
Price bounced at about 50 dma (dark blue)

UBER critical lvl, expecting bounce off 50MAsupport at previous resistance, 50MA
very small wick shows good support & buying confidence.
Bull case:
expecting a good bounce up, best case aim for gap fill & forming a new trading zone between 34 - 38
Bear case:
SPY keeps dumping and 50MA support fail to hold, and break down further to test 100MA at $33

two scenarios here... Elliot Wave analysisfirst time doing this... one of two scenarios could go down. let's see what happens

Uber Among UsMight be difficult for Uber fans to find this chart because I had to overlay Uber on a cryptocurrency chart to have the time scale include all days of the week.
Target price ranges between $63 and $90, but $66 is highly probably based on wedge, EW, and Fib as shown in chart.
Displayed in the chart is as follows:
Wyckoff accumulation contained by a wedge having a pink top trend line and blue bottom trend line. Each of three touches to both trend lines is indicated by a pink or blue vertical line as appropriate. The green vertical line indicates when price high confirmed breakout above the wedge. Note: price close and low has yet to confirm breakout. Therefore, one could argue that Uber remains in accumulation.
Elliott Wave leading diagonal wave 1 - bound by the orange channel, wave 2 - bound by the purple triangle, and part of a wave 3 that will likely be extended. So far, a lesser degree wave 1 and 2 have ended as well as a further lesser degree wave 1 and 2, indicated by the gold vertical line.
Fibonacci levels based on price at beginning and end of wave 1 (13.71 and 38.78)
Feel free to follow, like, and even donate TV cash!

Uber: View chart linked in descriptionView chart linked below. I don’t know how to force all days of the week on time scale so I charted Uber on a cryptocurrency chart.
Target price ranges between $63 and $90, but $66 is highly probable based on Wedge, EW, and Fib.

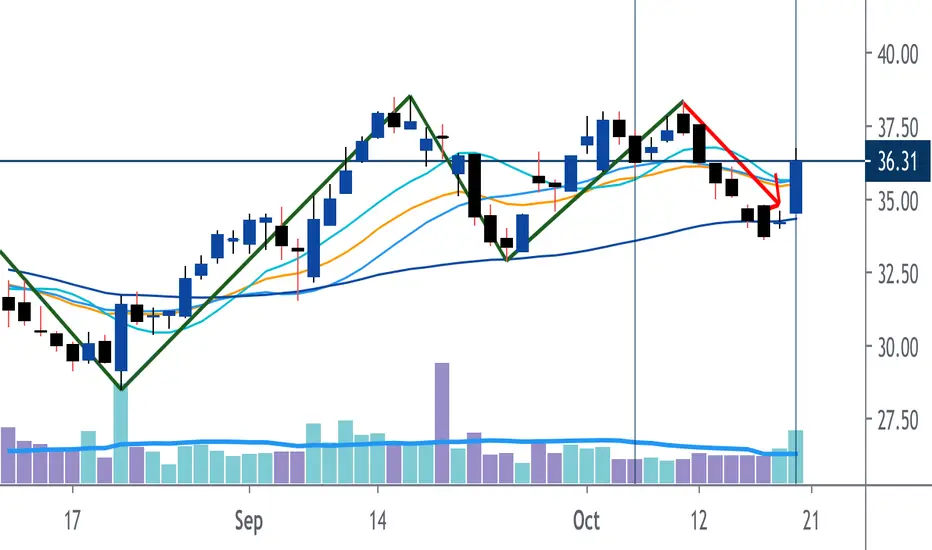
Uber: Trick or TreatDon’t fall for Uber’s trick, instead play nice and wait for it’s Treat. Yesterday, Uber didn’t gain like most of the market did. Instead, Uber faked a close under 20 DMA but bounced upwards right at close. That bounce coincides with a long term trend line that had been acting as resistance but now appears to act as support.
The pink vertical lines indicate bounces off the trend line by a high, low, open, or close price. If the trend line is valid support, then price could rally, slowly or quickly, to an ideal technical target price of $66. However, a more practical target price is closer to $54.
Like, follow, and let’s see what happens.

trying to push over that 37.80 areaCup & handle formed, but failed to get past the line of resistance for an upward continuation - let's see if we can get past it next week.

Potential cup and handle on 1hrtoday was a bit choppy after trump's stimulus tweet. let's see if this cup and handle goes as planned...

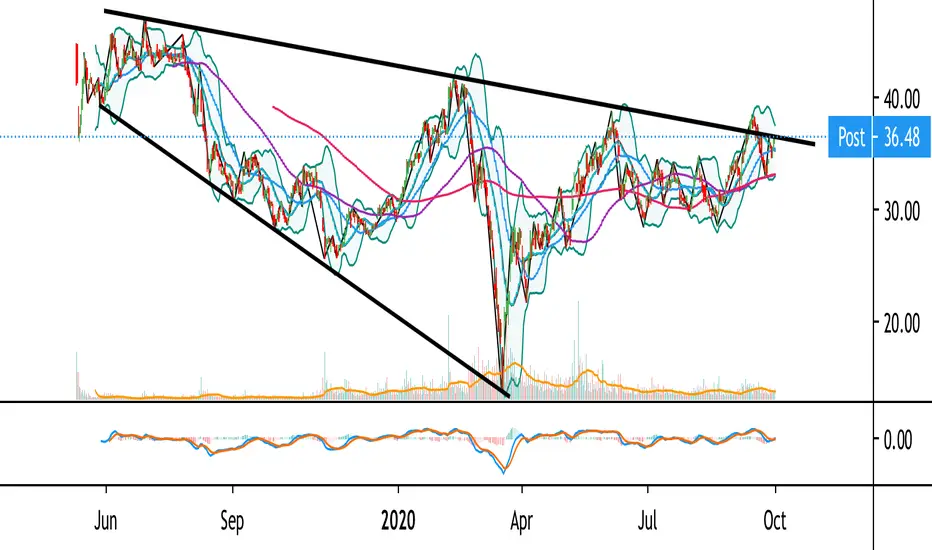
UBER Ready to Breakout From IPO BaseUBER has been building an IPO base for a while. Similar in look to SPOT and BYND before they broke out. And if you want to go to the 'way back machine' check out CHGG after it IPO'd. UBER has a chance to provide some huge returns. Watch for a break of the downtrend line and follow-through above the blue shaded area. Top of the watch list for me!


Uber centerfold: Doesn’t get sexier than this
10 20 50 and 100 DMAs
BB
macd
gaps
volume
... all confirming a possible breakout above the long-term wedge pattern.
Please wine and dine her first, gentlemen.