Buy or Sell ?Uber's strategy to make profit:
1. Charging customers for subscription.
2. Cheating on restaurants more than ever.
3. Reducing the payment to drivers.
And the result of this "smart strategy" is dissatisfying everybody, and ultimately loosing the market!
Capture this image and see me at the end of the year...
Uber

LYFT continuing a BreakoutLYFT beat earnings by 4X this past week and so brokeout.
On the cloud indicator, the conversion line has diverged above
the baseline.
LYFT could be watched for breakout continuation.
The Awesome Oscillator and VWAP Oscillators validate the breakout,
Added to watchlist for Monday, Aug 8th
Plan to check UBER. NASDAQ:LYFT

UBER SELL+Will be looking to start a short position on UBER as it's overbought here and gone a bit too far too fast. Bear market rallies sucker everyone in to thinking(incorrectly) the bottom is in. We are no where near a bottom!

UBER 30 Day LookoutDaily Candle Prediction
I think you saw the high for a minute on UBER. I think it is going to come down amd fill the gap before it catches itself on the next meaningful uptrend. I think the next uptrend is going to have some momentum going forward.
I would look at $26 / buy in for a good support level
This is not financial advice, I have never been trained to do this

UBER: Turnaround or bear market rally?Uber Technologies
Short Term - We look to Buy at 25.07 (stop at 21.38)
Although the bears are in control, the stalling negative momentum indicates a turnaround is possible. They reported better than expected earnings which is positive for sentiment. A bullish reverse Head and Shoulders is forming. This is positive for sentiment and the uptrend has potential to return. We look to buy dips. Further upside is expected.
Our profit targets will be 33.86 and 36.00
Resistance: 34.00 / 45.00 / 60.00
Support: 24.00 / 20.00 / 13.50
Please be advised that the information presented on TradingView is provided to Vantage (‘Vantage Global Limited’, ‘we’) by a third-party provider (‘Signal Centre’). Please be reminded that you are solely responsible for the trading decisions on your account. There is a very high degree of risk involved in trading. Any information and/or content is intended entirely for research, educational and informational purposes only and does not constitute investment or consultation advice or investment strategy. The information is not tailored to the investment needs of any specific person and therefore does not involve a consideration of any of the investment objectives, financial situation or needs of any viewer that may receive it. Kindly also note that past performance is not a reliable indicator of future results. Actual results may differ materially from those anticipated in forward-looking or past performance statements. We assume no liability as to the accuracy or completeness of any of the information and/or content provided herein and the Company cannot be held responsible for any omission, mistake nor for any loss or damage including without limitation to any loss of profit which may arise from reliance on any information supplied by Signal Centre.

Uber Long -- Expecting bull expectation for next quarter? Currently, Uber is looking bull and ready to pick direction. Most likely upwards towards $29/31/33.
Observe later this week for more movements to decide direction.
If earning /forecast not good, could go downtrend towards $21.60/70 for support.

UBER Potential for bullish rise | 21th July 2022On the H4, with prices moving above the ichimoku indicator and breaking out of the descending trendline, we have a bullish bias that price would rise from our buy entry at 23.59 where the pullback support is to the take profit at 26.64 in line with swing high resistance. Alternatively, prices could break entry structure and drop to stop loss at 20.16 in line with swing low support, 78.6% fibonacci projection and -27.2% fibonacci expansion.
Any opinions, news, research, analyses, prices, other information, or links to third-party sites contained on this website are provided on an "as-is" basis, as general market commentary, and do not constitute investment advice. The market commentary has not been prepared in accordance with legal requirements designed to promote the independence of investment research, and it is therefore not subject to any prohibition on dealing ahead of dissemination. Although this commentary is not produced by an independent source, FXCM takes all sufficient steps to eliminate or prevent any conflicts of interest arising out of the production and dissemination of this communication. The employees of FXCM commit to acting in the clients' best interests and represent their views without misleading, deceiving, or otherwise impairing the clients' ability to make informed investment decisions. For more information about the FXCM's internal organizational and administrative arrangements for the prevention of conflicts, please refer to the Firms' Managing Conflicts Policy. Please ensure that you read and understand our Full Disclaimer and Liability provision concerning the foregoing Information, which can be accessed on the website.

The "UBER Files" The Uber Files, first leaked to The Guardian, consists of over 124,000 internal documents that show how UBER attempted to secretly gain support from politicians in Europe, including French president Emmanuel Macron when he was serving as the country’s economy minister, chancellor George Osborne and other ministers, for its aggressive global expansion.
The documents date between 2013 and 2017.
Despite the efforts, UBER is not a profitable company, yet its market cap is 43.868Bil.
If you haven`t shorted UBER here:
On this falling wedge bearish chart pattern i expect to see it go lower, to $13.80, before a technical rebound.
Looking forward to read your opinion about it.

$UBER ~ Where's the bottom...As shown in previous update, correction continues and expect lower prices as shown. Possible opportunity soon but not yet. Will be interesting soon and will continue to track closely.

Uber - Downgraded to WreckedUser Select isn't hooking so much these days.
Must be the propensity for Base.
Base Jumping at present seems to provide Uber
with an endless Downtrend.
Lyft.. ugh.
When both cut bonuses to Drivers, it was over.
__________________________________________
Uber Eats, death by 1000 drive-thrus.
All good, Robo Taxis are the primary focus of every
Auto Manu on the Planet.
Even Apple, which remains a software-only iCar Cult
conveyance.
___________________________________________
Giga Texas / Berlin Dumpster Fires continue to rage
unimpeded.
Even Eron admits - BK is the stark reality.
Buy the Transpo Dip?
No.

UBER to $75 per share Hoping for price to dip to $10-$13 per share - long term upside targets of $50, $75, then $100-$120

UBER To Test Pandemic LowsIn this update we review the recent price action in UBER and identify the next high probability trading opportunities and price objectives to target


$UBER Analysis, Key Levels, & Targets… $UBER Analysis, Key Levels, & Targets…
I’m not going to lie… this is NOT the most beautiful chart in the world… but I’m interested in buying UBER at these levels…
Uber has taken over an entire industry and keeps expanding into new opportunities to generate revenue… This is on my list for no matter what happens…. I feel like this is a company that will be around in 50 years… I sold 21 puts for this week...
I want to hear your ideas and, also, what stocks are you guys seeing that are at interesting levels…. I’m really starting to get bullish on a lot of things. Yes… lots of companies will and are going under, but what do you think will stay??
Best of luck and have fun, y’all…
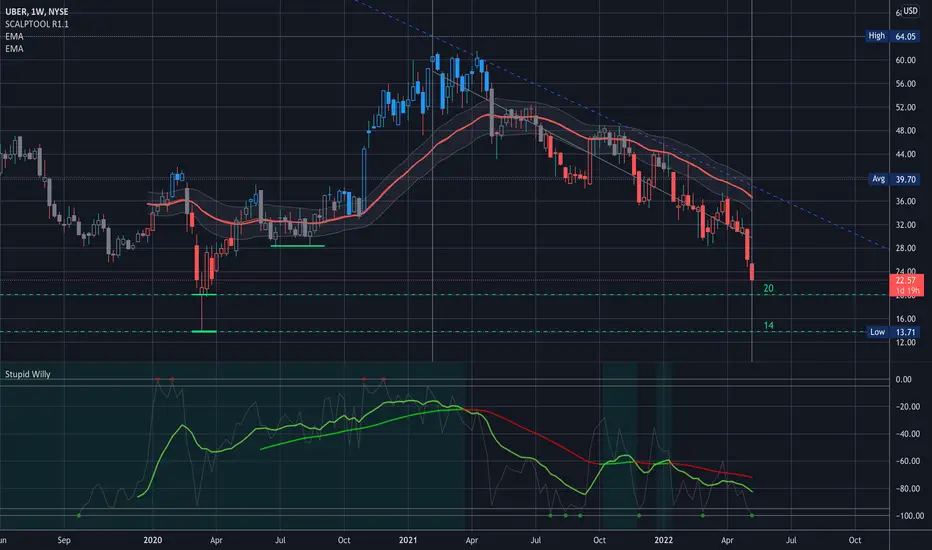
UBER Selloff leads towards 20$ Uber selloff leadus towards 20$.SellOff accelerate after support line broken and it may take us towards 15$.

UBER Might See More Downsides UBER has provided us with a nice curved trend line (in white) with the last touch going to be aligned with 2.618 which is comparable to a previous drop in 2020
Interesting daily chart

Lyft: You Gotta Know When to Fold'EmBear Market for Lyft started on November 26, 2021. How do I know? I simply look at the chart. If you heed my advice and exited at that time, you would have lost 50% less than if you exited today.
Trust the charts!
---
How to understand price action.
It is very easy to read price action if you have a reference point. These support/resistance lines are there to help you read where the buyers and sellers are likely to make a stand.
You can also think of these indicators as moving pivot points .
MasterChartsTrading Price Action Indicators show good price levels to enter or exit a trade.
The Blue indicator line serves as a Bullish Trend setter.
If your instrument closes above the Blue line, we think about going Long (buying).
For commodities and Forex, when your trading instrument closes below the Red line, we think about Shorting (selling).
For Stocks, I prefer to use the Yellow line as my Bearish Trend setter (on Daily charts ). A stock has to close below the Yellow line first, then rally towards the Red line and top out there. This is where I would short it.

UBER Strong Support AreaIf you haven`t sold UBER on this bearish call:
Then you should know that even if they released an extremely bullish guidance for Q2, higher than the estimates, it could face the same problems as LYFT, spend more on driver incentives, and they won`t deliver the expected results.
My price target is the $26.50 support.
Looking forward to read your opinion about it.

$UBER on 15min Potential CUP and Handle Pattern in extended$UBER on 15min Potential CUP and Handle Pattern in extended
Please note: Earnings May 4th
What are your thoughts?
Thanks,
Kelly

Beginning of an End - E.3This is not what you invest on for long-term (not even short-term).
"Gas" price and people returning to "restaurants" left no future for Uber, the chart proves.

Uber Turning the Corner?UBER looking good here. Down 46% off ATH in early 2021. Uber has seen a slow bleed over the last year, as opposed to the more dramatic, precipitous fall of many other stocks. Price appears to be finding support at a historically active Demand Zone. Support appears to be building on the Daily chart. I'm interested at these prices but I'm expecting some more sideways chop before UBER can break resistance.
-Mercury
----------------------------------------------------------------
These are my personal views and not financial advice. Please do your own research before investing.
I'd love to hear your thoughts, ideas and feedback. Feel free to Comment and I'll try and get back to you quickly.
If you appreciated this analysis, consider Liking or Following . Thanks!

$EBAY sitting at the outside week trigger #sss50percentruleOutside week triggered! #sss50percentrule. $56.16 pt if it holds. I like next week's contract for this swing.

$UBER 2-1-2U triggered on the weekMight find some resistance at the daily targets, but this is a good swing to 36.88. I like next week contracts if it stays in force. #thestrat #uber
