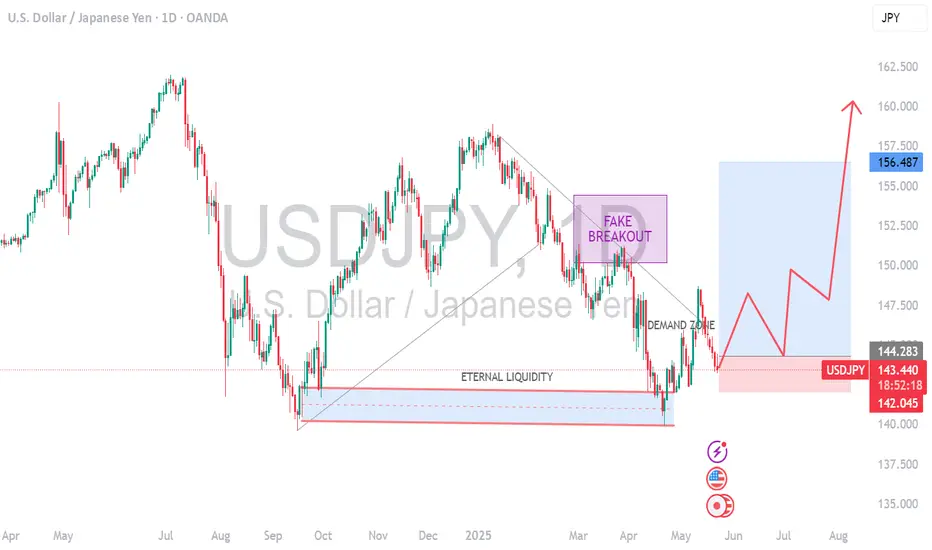
USDJPY- IS it a beginning of major bulish trend nowthe USD/JPY pair is currently in a major bullish trend, driven by several key factors:
1. Interest Rate Differentials: The U.S. Federal Reserve maintains higher interest rates compared to the Bank of Japan, attracting capital flows into the U.S. dollar and away from the yen.
2. Dovish Bank of Japan: Despite global tightening, the BOJ remains cautious about raising rates or ending yield curve control, weakening the yen further.
3. Robust U.S. Economic Data: Strong economic indicators from the U.S. (such as inflation, jobs, and GDP growth) continue to support expectations of prolonged higher rates, boosting the dollar.
Udsjpy
USDJPYHello traders ,what do you think about USDJPY? This pair has reached the resistance zone and the ceiling of the channel. It is expected that with a slight fluctuation in this level, it will fall at least to the specified level.
If this post was useful to you, do not forget to like and comment.❤️

XAUUSD:H2According to the analysis, we expect an upward movement. Today we have CPI important news for the USD
Please follow your strategy, , this is just my idea .
🙌Please do not forget the ' like' button & Share it with your friends .
✍ I will be glad to see your ideas in this post .
🧲Follow me to see more analysis

USDJPYWhat is seen in the chart is the A.B.C correction pattern ... apparently a wave C has not been formed yet so you can have a purchase deal

Short USDJPYShort analysis of USDJPY on 1D TF.
Expect the dollar to weaken in the next couple of days.

USDJPY Outlook - Bullish SentimentPrice has successfully moved from the 141.600 zone as I said it would. Let's see if market-makers would still manipulate BUYERS in the 147.000 price zone. I expect price to break 145.000 and climb to around 147.000 before collapsing back to my 3rd TP price at the 141.000 zone .
Patience is key!!!


USD/JPY to gain bearish momentum after channel breaksPrice broke channel with bearish momentum and went back to retest the channel and zone area and a bearish candle formed showing bearish momentum. This gives rise to a short sell opportunity

USDJPY Held Resisted on Several Intraday LevelsKey details labelled via Signposts on chart. Price is resisted below the 103.82 level.
[ Note that ideas published represent my viewpoints on structural directional movements. I do not post explicit trade parameters (i.e. entry, take profit, stop loss, etc.) as these are set to in reference with my expectancy. Since my win rate and R-multiple targets are different, ideas published are simply a resource to provide guidance. You are expected to manage your own trading decisions. ]


USDJPY buysUSDJPY is obviously in an uptrend. A support level was established during Asian so heading into NY session I’d expect that support to be tapped before continuing bullish momentum.


[b]USDJPY INTRA DAY LONG![/b]Confluences
Enticing further shorts on the hourly where the strong move down has already happened
Over-extension - needs pull back
MA Break/close above- 1hr/2hr
Respecting 1hr trendline
triple bottom on hourly
Target confluent w/ prev sup

Triangle Pattern in USDJPY H1Waiting for USDJPY triangle breakout. Triangle pattern is accompanied by a volume decrement.
Currency pair - USD.JPY
Chart timeframe - 1hr
- My Pending Orders -
BUYSTOP: 112.431
SELLSTOP: 112.262
TAKEPROFIT BUYSTOP: 112.574
TAKEPROFIT SELLSTOP: 112.121
If you find this analysis helpful, don´t forget to like and comment! :)

USDJPY about to violate the triangle upward sloping trendlineUSDJPY about to violate the triangle upward sloping trendline below 109.50
if close below expects 108. very soon
while strong Resistance at cluster of MOVING AVERAGE 200DMA & 50DMA at 111.50
best of luck......

POTENTIONAL BEARISH SHARK PATTERN USD/JPY ON 1H CHARTHello traders,as we look USD/JPY on 1H chart(attached below the daily analysis on USD/JPY) we can see a possible bearish shark pattern as we go reach the red zone of resistance.
We may have a better entry for better P/L ratio trade if price makes a spike with a false breakout above the trend line into the red zone where we have the D completion point.
TECHNICALLY
We can see the downtrnd 200EMA which encourages us to take the short trade.
Currently price is trying to go above the descending trend line.
Maybe it does but for a while as we have already RSI divergence and Stochastic at oversold levels.
POSSIBLE TRADE
FIRST TARGET T1 WITH 1,40 P/L RATIO AT 111,215
SECOND TARGET T2 WITH 2,10 P/L RATIO AT 110,955
BUY STOP AT 112,150
THANKS FOR SUPPORT!
HAPPY TRADING!


USDJPY SHORTCypher pattern completed on the 60 minute chart earlier and the market is now in an oversold condition.

USD/JPY H4 - Possible long setup - ABCD patternAn ABCD pattern is in formation, a bullish divergence and bullish pin bar are present inside PRZ, so it could be a good idea to look for a long position, however the PRZ is wide (+150 pips), still there is a possibility that the price push down a little bit more.
So, my options:
1) Buy limit at 109.64 / SL = 109.29
2) Wait for a reversal bar pattern around 108.99 (127.2% of the extension) where SL will be 3 or 4 pips outside the PRZ (108.01)
I’m more into second option, but H1 chart can help to make a better decision.

USD/JPYPlease do not follow my trade and analysis. I'm just a beginner :)
Just for test
Idea:
- Triangle structure
- Resistance retrace
-15 min chart divergence
Do not hesitate to comment ;)

USDJPY classical pennat formation The break happened last week and this week can be confirmed, they offer a good risk/reward ratio.
The MACD divergence and RSI indicators are also bullish
