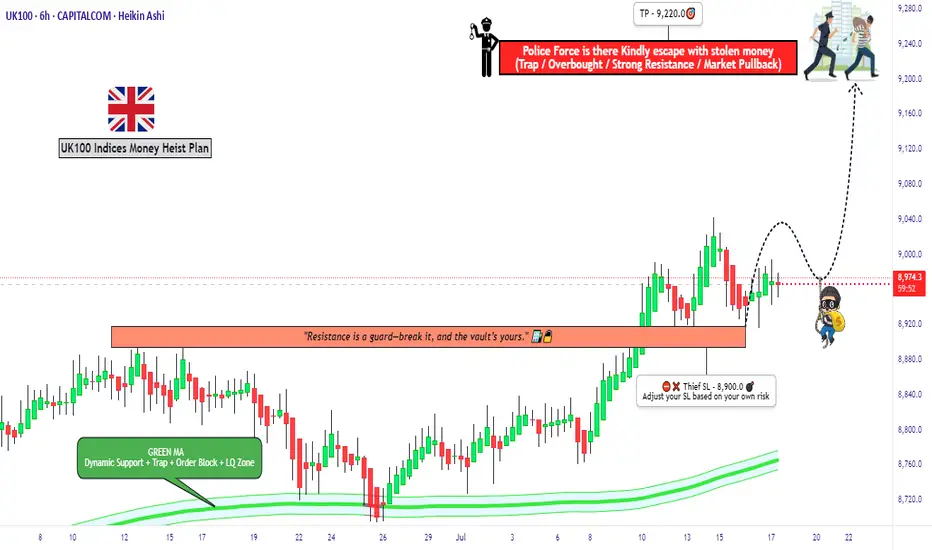
"UK100 Bulls Vault Open! Grab the Loot & Escape Early"🏴☠️💰"UK100 / FTSE100 Market Heist Blueprint" – A Thief Trading Operation for High-Profit Target Extraction 💼📈
🌍 Hola! Hi! Bonjour! Ola! Hallo! Marhaba!
To all the Market Robbers, Smart Thieves, and Strategic Money Makers — welcome to another Thief Trading Heist Plan™.
Ready your gear and charts — the UK100 / FTSE100 index is our next vault.
🔥Heist Objective: Swipe the Bullish Loot Before the Police Trap Hits! 🔥
Based on sharp Thief-style technical and macro-fundamental analysis, the market is showing bullish exhaustion and early signs of trap reversal zones. Our goal is clear: extract max value from the bulls and escape before the heat catches on.
🚨The current price action is nearing a Red Zone — high-risk area filled with potential police traps (supply zones, resistance, and bear setups). Timing and smart entries are key.
🎯 Strategy Overview (Day/Swing Trade)
Entry Plan:
🟢 “The Vault’s Open!” – Start accumulating long positions now or set buy limits near recent 15m/30m swing lows. Layer your entries (DCA method) for better control and efficiency.
Stop Loss (SL):
🔐 SL below recent swing low on 4H timeframe (~8900.0)
Adjust based on your risk appetite, position size, and how many layered orders you've got lined up.
Target Zone (TP):
🏁 Primary Target: 9220.0
Always be ready to exit early if market signals shift. He who escapes lives to rob another day.
🧲 Scalpers Note:
Only operate long within this framework. Big capital players can jump in earlier; others can trail behind with the swing traders. Always use trailing SLs to lock in stolen loot and reduce exposure.
📰 What's Driving the Market?
Current bullish sentiment is backed by:
Fundamental strength
Sentiment & COT reports
Macro data & intermarket correlation
Geopolitical & institutional flow analysis
Stay updated through your reliable sources and plug into key market dynamics and positioning reports.
⚠️ Trading Precaution:
🚫 Avoid new positions during high-impact news
💼 Manage your trades with care
🔁 Use trailing SLs to secure profits during volatility
💥Boost the Robbery – Support the Crew💥
If this heist plan aligns with your mission, smash that Boost button. Support the thief movement, and let’s build a strong trading crew where money is made with precision, strategy, and no mercy. 💰🤑
🔒 Final Notes (Read Before You Rob):
📌 This is a strategic trade setup, not financial advice. Always tailor the plan based on your risk management, capital size, and market conviction.
📌 Markets evolve. Stay alert, adapt fast, and trade like a thief — unseen, smart, and always two steps ahead.
💬Drop your thoughts, results, or setups below — and if you're in, type "HEIST READY" in the comments.
Stay tuned, another plan is on the way... 🏴☠️📊🔥
UK100 CFD
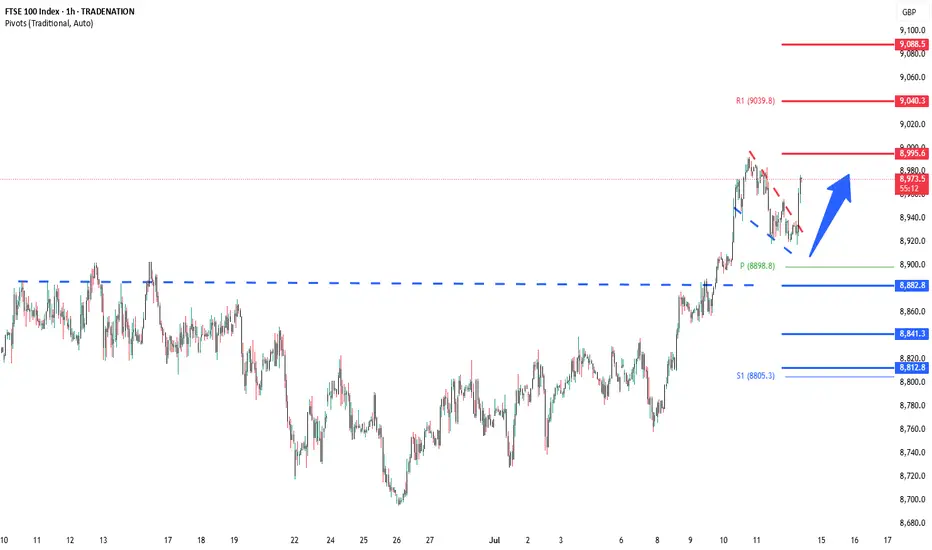
FTSE rally resistance at 9150The FTSE remains in a bullish trend, with recent price action showing signs of a corrective pullback within the broader uptrend.
Support Zone: 9045 – a key level from previous consolidation. Price is currently testing or approaching this level.
A bullish rebound from 9045 would confirm ongoing upside momentum, with potential targets at:
9150 – initial resistance
9172 – psychological and structural level
9200 – extended resistance on the longer-term chart
Bearish Scenario:
A confirmed break and daily close below 9150 would weaken the bullish outlook and suggest deeper downside risk toward:
9018 – minor support
8980 – stronger support and potential demand zone
Outlook:
Bullish bias remains intact while the FTSE holds above 9150. A sustained break below this level could shift momentum to the downside in the short term.
This communication is for informational purposes only and should not be viewed as any form of recommendation as to a particular course of action or as investment advice. It is not intended as an offer or solicitation for the purchase or sale of any financial instrument or as an official confirmation of any transaction. Opinions, estimates and assumptions expressed herein are made as of the date of this communication and are subject to change without notice. This communication has been prepared based upon information, including market prices, data and other information, believed to be reliable; however, Trade Nation does not warrant its completeness or accuracy. All market prices and market data contained in or attached to this communication are indicative and subject to change without notice.

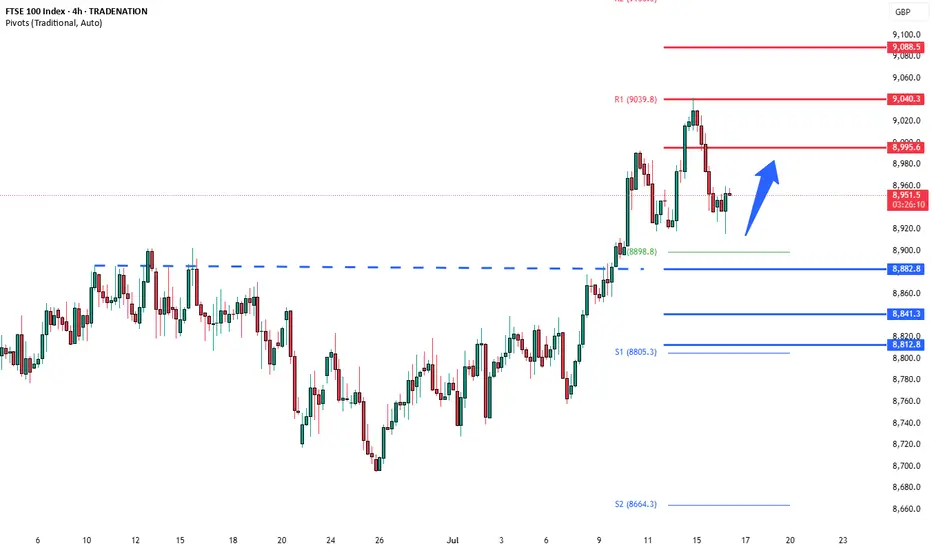
FTSE100 breakout zone now new support at 9030The FTSE remains in a bullish trend, with recent price action showing signs of a continuation breakout within the broader uptrend.
Support Zone: 9030 – a key level from previous consolidation. Price is currently testing or approaching this level.
A bullish rebound from 9030 would confirm ongoing upside momentum, with potential targets at:
9107 – initial resistance
9140 – psychological and structural level
9170 – extended resistance on the longer-term chart
Bearish Scenario:
A confirmed break and daily close below 9030 would weaken the bullish outlook and suggest deeper downside risk toward:
8980 – minor support
8920 – stronger support and potential demand zone
Outlook:
Bullish bias remains intact while the FTSE holds above 9030. A sustained break below this level could shift momentum to the downside in the short term.
This communication is for informational purposes only and should not be viewed as any form of recommendation as to a particular course of action or as investment advice. It is not intended as an offer or solicitation for the purchase or sale of any financial instrument or as an official confirmation of any transaction. Opinions, estimates and assumptions expressed herein are made as of the date of this communication and are subject to change without notice. This communication has been prepared based upon information, including market prices, data and other information, believed to be reliable; however, Trade Nation does not warrant its completeness or accuracy. All market prices and market data contained in or attached to this communication are indicative and subject to change without notice.

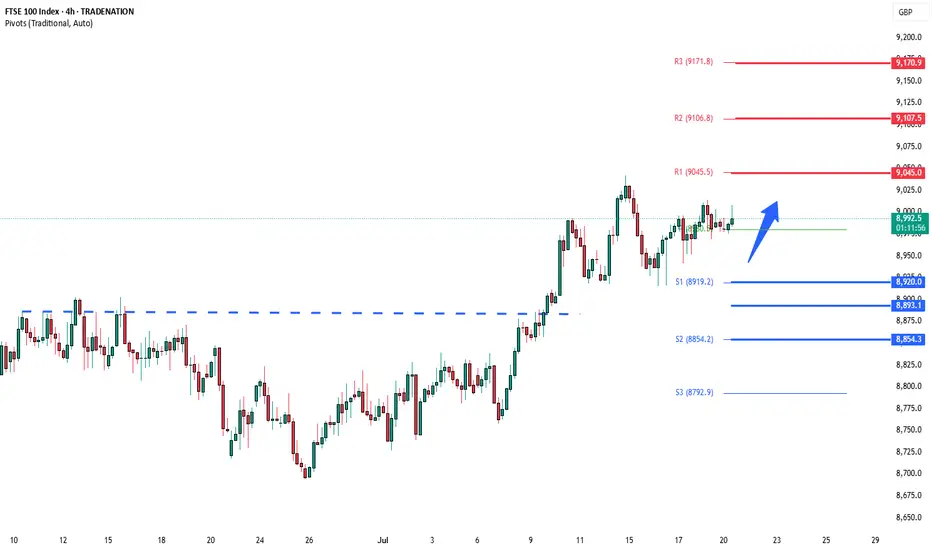
FTSE bullish consolidation resistance at 9045The FTSE remains in a bullish trend, with recent price action showing signs of a corrective pullback within the broader uptrend.
Support Zone: 8020 – a key level from previous consolidation. Price is currently testing or approaching this level.
A bullish rebound from 8920 would confirm ongoing upside momentum, with potential targets at:
9045 – initial resistance
9107 – psychological and structural level
9170 – extended resistance on the longer-term chart
Bearish Scenario:
A confirmed break and daily close below 8920 would weaken the bullish outlook and suggest deeper downside risk toward:
8893 – minor support
8854 – stronger support and potential demand zone
Outlook:
Bullish bias remains intact while the FTSE holds above 8920. A sustained break below this level could shift momentum to the downside in the short term.
This communication is for informational purposes only and should not be viewed as any form of recommendation as to a particular course of action or as investment advice. It is not intended as an offer or solicitation for the purchase or sale of any financial instrument or as an official confirmation of any transaction. Opinions, estimates and assumptions expressed herein are made as of the date of this communication and are subject to change without notice. This communication has been prepared based upon information, including market prices, data and other information, believed to be reliable; however, Trade Nation does not warrant its completeness or accuracy. All market prices and market data contained in or attached to this communication are indicative and subject to change without notice.
UK100 short - head and shoulders H4Risk/ reward = 4.6
Entry = 8 998.5
Stop loss = 9 034.2
Take profit level 1 = 8 859.8
Take profit level 2 = 8 794
Still need confirmation,
Waiting for H4 candle to close at 23.00 and will need to validate volume.

$GBIRYY - U.K Inflation Rises to a 2024 High (June/2025)ECONOMICS:GBIRYY
June/2025
source: Office for National Statistics
- The annual inflation rate in the UK rose to 3.6% in June, the highest since January 2024, up from 3.4% in May and above expectations that it would remain unchanged.
The main upward pressure came from transport prices, mostly motor fuel costs, airfares, rail fares and maintenance and repair of personal transport equipment.
On the other hand, services inflation remained steady at 4.7%.
Meanwhile, core inflation also accelerated, with the annual rate reaching 3.7%.

FTSE100 overbought pullback supported at 8880The FTSE remains in a bullish trend, with recent price action showing signs of a corrective pullback within the broader uptrend.
Support Zone: 8880 – a key level from previous consolidation. Price is currently testing or approaching this level.
A bullish rebound from 8880 would confirm ongoing upside momentum, with potential targets at:
8900 – initial resistance
9040 – psychological and structural level
9090 – extended resistance on the longer-term chart
Bearish Scenario:
A confirmed break and daily close below 8880 would weaken the bullish outlook and suggest deeper downside risk toward:
8840 – minor support
8820 – stronger support and potential demand zone
Outlook:
Bullish bias remains intact while the FTSE holds above 8880. A sustained break below this level could shift momentum to the downside in the short term.
This communication is for informational purposes only and should not be viewed as any form of recommendation as to a particular course of action or as investment advice. It is not intended as an offer or solicitation for the purchase or sale of any financial instrument or as an official confirmation of any transaction. Opinions, estimates and assumptions expressed herein are made as of the date of this communication and are subject to change without notice. This communication has been prepared based upon information, including market prices, data and other information, believed to be reliable; however, Trade Nation does not warrant its completeness or accuracy. All market prices and market data contained in or attached to this communication are indicative and subject to change without notice.
FTSE INTRADAY continuation pattern breakout. The FTSE remains in a bullish trend, with recent price action showing signs of a corrective pullback within the broader uptrend.
Support Zone: 8880 – a key level from previous consolidation. Price is currently testing or approaching this level.
A bullish rebound from 8880 would confirm ongoing upside momentum, with potential targets at:
8900 – initial resistance
9040 – psychological and structural level
9090 – extended resistance on the longer-term chart
Bearish Scenario:
A confirmed break and daily close below 8880 would weaken the bullish outlook and suggest deeper downside risk toward:
8840 – minor support
8820 – stronger support and potential demand zone
Outlook:
Bullish bias remains intact while the FTSE holds above 8880. A sustained break below this level could shift momentum to the downside in the short term.
This communication is for informational purposes only and should not be viewed as any form of recommendation as to a particular course of action or as investment advice. It is not intended as an offer or solicitation for the purchase or sale of any financial instrument or as an official confirmation of any transaction. Opinions, estimates and assumptions expressed herein are made as of the date of this communication and are subject to change without notice. This communication has been prepared based upon information, including market prices, data and other information, believed to be reliable; however, Trade Nation does not warrant its completeness or accuracy. All market prices and market data contained in or attached to this communication are indicative and subject to change without notice.
FTSE100 overbought pullback supported at 8880The FTSE remains in a bullish trend, with recent price action showing signs of a corrective pullback within the broader uptrend.
Support Zone: 8880 – a key level from previous consolidation. Price is currently testing or approaching this level.
A bullish rebound from 8880 would confirm ongoing upside momentum, with potential targets at:
8900 – initial resistance
9040 – psychological and structural level
9090 – extended resistance on the longer-term chart
Bearish Scenario:
A confirmed break and daily close below 8880 would weaken the bullish outlook and suggest deeper downside risk toward:
8840 – minor support
8820 – stronger support and potential demand zone
Outlook:
Bullish bias remains intact while the FTSE holds above 8880. A sustained break below this level could shift momentum to the downside in the short term.
This communication is for informational purposes only and should not be viewed as any form of recommendation as to a particular course of action or as investment advice. It is not intended as an offer or solicitation for the purchase or sale of any financial instrument or as an official confirmation of any transaction. Opinions, estimates and assumptions expressed herein are made as of the date of this communication and are subject to change without notice. This communication has been prepared based upon information, including market prices, data and other information, believed to be reliable; however, Trade Nation does not warrant its completeness or accuracy. All market prices and market data contained in or attached to this communication are indicative and subject to change without notice.

FTSE breaking out?Following a lengthy consolidation, the FTSE appears to be poking its head above the resistance trend of a triangle formation and resistance circa 8830-35 area today, potentially paving the way for a run to a new all-time high.
This comes as markets have taken the latest tariff threats from Trump in their stride. Equity indices were quick to recoup most of their losses, with US futures trading higher and the DAX hitting a new weekly high today, reaching its highest levels since early June. I
Investors presumably expect more deals to be done before the extended August 1 deadline. After all, Trump himself has said that he’s open to negotiations and that the August 1 deadline for implementation of new levies was “not 100% firm”.
By Fawad Razaqzada, market analyst with FOREX.com

FTSE100 resistance breakoutThe FTSE remains in a bullish trend, with recent price action showing signs of a resistance breakout within the broader uptrend.
Support Zone: 8785 – a key level from previous consolidation. Price is currently testing or approaching this level.
A bullish rebound from 8785 would confirm ongoing upside momentum, with potential targets at:
8900 – initial resistance
8930 – psychological and structural level
8960 – extended resistance on the longer-term chart
Bearish Scenario:
A confirmed break and daily close below 8785 would weaken the bullish outlook and suggest deeper downside risk toward:
8760 – minor support
8730 – stronger support and potential demand zone
Outlook:
Bullish bias remains intact while the FTSE holds above 8785. A sustained break below this level could shift momentum to the downside in the short term.
This communication is for informational purposes only and should not be viewed as any form of recommendation as to a particular course of action or as investment advice. It is not intended as an offer or solicitation for the purchase or sale of any financial instrument or as an official confirmation of any transaction. Opinions, estimates and assumptions expressed herein are made as of the date of this communication and are subject to change without notice. This communication has been prepared based upon information, including market prices, data and other information, believed to be reliable; however, Trade Nation does not warrant its completeness or accuracy. All market prices and market data contained in or attached to this communication are indicative and subject to change without notice.

FTSE 8840 resistance retestThe FTSE remains in a bullish trend, with recent price action showing signs of a corrective pullback within the broader uptrend.
Support Zone: 8740 – a key level from previous consolidation. Price is currently testing or approaching this level.
A bullish rebound from 8740 would confirm ongoing upside momentum, with potential targets at:
8840 – initial resistance
8870 – psychological and structural level
8900 – extended resistance on the longer-term chart
Bearish Scenario:
A confirmed break and daily close below 8740 would weaken the bullish outlook and suggest deeper downside risk toward:
8695 – minor support
8640 – stronger support and potential demand zone
Outlook:
Bullish bias remains intact while the FTSE holds above 8740. A sustained break below this level could shift momentum to the downside in the short term.
This communication is for informational purposes only and should not be viewed as any form of recommendation as to a particular course of action or as investment advice. It is not intended as an offer or solicitation for the purchase or sale of any financial instrument or as an official confirmation of any transaction. Opinions, estimates and assumptions expressed herein are made as of the date of this communication and are subject to change without notice. This communication has been prepared based upon information, including market prices, data and other information, believed to be reliable; however, Trade Nation does not warrant its completeness or accuracy. All market prices and market data contained in or attached to this communication are indicative and subject to change without notice.

FTSE100 H1 | Approaching a multi-swing-high resistanceThe FTSE100 (UK100) is rising towards a multi-swing-high resistance and could potentially reverse off this level to drop lower.
Sell entry is at 8,825.21 which is a multi-swing-high resistance.
Stop loss is at 8,855.00 which is a level that sits above the 127.2% Fibonacci extension and a swing-high resistance.
Take profit is at 8,791.98 which is a pullback support.
High Risk Investment Warning
Trading Forex/CFDs on margin carries a high level of risk and may not be suitable for all investors. Leverage can work against you.
Stratos Markets Limited (tradu.com ):
CFDs are complex instruments and come with a high risk of losing money rapidly due to leverage. 63% of retail investor accounts lose money when trading CFDs with this provider. You should consider whether you understand how CFDs work and whether you can afford to take the high risk of losing your money.
Stratos Europe Ltd (tradu.com ):
CFDs are complex instruments and come with a high risk of losing money rapidly due to leverage. 63% of retail investor accounts lose money when trading CFDs with this provider. You should consider whether you understand how CFDs work and whether you can afford to take the high risk of losing your money.
Stratos Global LLC (tradu.com ):
Losses can exceed deposits.
Please be advised that the information presented on TradingView is provided to Tradu (‘Company’, ‘we’) by a third-party provider (‘TFA Global Pte Ltd’). Please be reminded that you are solely responsible for the trading decisions on your account. There is a very high degree of risk involved in trading. Any information and/or content is intended entirely for research, educational and informational purposes only and does not constitute investment or consultation advice or investment strategy. The information is not tailored to the investment needs of any specific person and therefore does not involve a consideration of any of the investment objectives, financial situation or needs of any viewer that may receive it. Kindly also note that past performance is not a reliable indicator of future results. Actual results may differ materially from those anticipated in forward-looking or past performance statements. We assume no liability as to the accuracy or completeness of any of the information and/or content provided herein and the Company cannot be held responsible for any omission, mistake nor for any loss or damage including without limitation to any loss of profit which may arise from reliance on any information supplied by TFA Global Pte Ltd.
The speaker(s) is neither an employee, agent nor representative of Tradu and is therefore acting independently. The opinions given are their own, constitute general market commentary, and do not constitute the opinion or advice of Tradu or any form of personal or investment advice. Tradu neither endorses nor guarantees offerings of third-party speakers, nor is Tradu responsible for the content, veracity or opinions of third-party speakers, presenters or participants.

UK100/FTSE100Team,
SHORT UK100/FTSE100 slowly at 8796-8826
TARGET at 8772-8746 ranges
DOUBLE UP at 8846-66 - target at 8802-12

FTSE oversold rally resistance at 8820The FTSE remains in a bullish trend, with recent price action showing signs of a corrective pullback within the broader uptrend.
Support Zone: 8740 – a key level from previous consolidation. Price is currently testing or approaching this level.
A bullish rebound from 8740 would confirm ongoing upside momentum, with potential targets at:
8840 – initial resistance
8870 – psychological and structural level
8900 – extended resistance on the longer-term chart
Bearish Scenario:
A confirmed break and daily close below 8740 would weaken the bullish outlook and suggest deeper downside risk toward:
8695 – minor support
8640 – stronger support and potential demand zone
Outlook:
Bullish bias remains intact while the FTSE holds above 8740. A sustained break below this level could shift momentum to the downside in the short term.
This communication is for informational purposes only and should not be viewed as any form of recommendation as to a particular course of action or as investment advice. It is not intended as an offer or solicitation for the purchase or sale of any financial instrument or as an official confirmation of any transaction. Opinions, estimates and assumptions expressed herein are made as of the date of this communication and are subject to change without notice. This communication has been prepared based upon information, including market prices, data and other information, believed to be reliable; however, Trade Nation does not warrant its completeness or accuracy. All market prices and market data contained in or attached to this communication are indicative and subject to change without notice.

FTSE100 oversold rally testing resistance at 8820The FTSE remains in a bullish trend, with recent price action showing signs of a corrective pullback within the broader uptrend.
Support Zone: 8695 – a key level from previous consolidation. Price is currently testing or approaching this level.
A bullish rebound from 8695 would confirm ongoing upside momentum, with potential targets at:
8820 – initial resistance
8855 – psychological and structural level
8900 – extended resistance on the longer-term chart
Bearish Scenario:
A confirmed break and daily close below 8695 would weaken the bullish outlook and suggest deeper downside risk toward:
8640 – minor support
8600 – stronger support and potential demand zone
Outlook:
Bullish bias remains intact while the FTSE holds above 8695. A sustained break below this level could shift momentum to the downside in the short term.
This communication is for informational purposes only and should not be viewed as any form of recommendation as to a particular course of action or as investment advice. It is not intended as an offer or solicitation for the purchase or sale of any financial instrument or as an official confirmation of any transaction. Opinions, estimates and assumptions expressed herein are made as of the date of this communication and are subject to change without notice. This communication has been prepared based upon information, including market prices, data and other information, believed to be reliable; however, Trade Nation does not warrant its completeness or accuracy. All market prices and market data contained in or attached to this communication are indicative and subject to change without notice.

FTSE Oversold rally resistance at 8820The FTSE remains in a bullish trend, with recent price action showing signs of a corrective pullback within the broader uptrend.
Support Zone: 8695 – a key level from previous consolidation. Price is currently testing or approaching this level.
A bullish rebound from 8695 would confirm ongoing upside momentum, with potential targets at:
8820 – initial resistance
8855 – psychological and structural level
8900 – extended resistance on the longer-term chart
Bearish Scenario:
A confirmed break and daily close below 8695 would weaken the bullish outlook and suggest deeper downside risk toward:
8640 – minor support
8600 – stronger support and potential demand zone
Outlook:
Bullish bias remains intact while the FTSE holds above 8695. A sustained break below this level could shift momentum to the downside in the short term.
This communication is for informational purposes only and should not be viewed as any form of recommendation as to a particular course of action or as investment advice. It is not intended as an offer or solicitation for the purchase or sale of any financial instrument or as an official confirmation of any transaction. Opinions, estimates and assumptions expressed herein are made as of the date of this communication and are subject to change without notice. This communication has been prepared based upon information, including market prices, data and other information, believed to be reliable; however, Trade Nation does not warrant its completeness or accuracy. All market prices and market data contained in or attached to this communication are indicative and subject to change without notice.

FTSE uptrend pause capped at 8854The FTSE remains in a bullish trend, with recent price action showing signs of a corrective pullback within the broader uptrend.
Support Zone: 8695 – a key level from previous consolidation. Price is currently testing or approaching this level.
A bullish rebound from 8695 would confirm ongoing upside momentum, with potential targets at:
8854 – initial resistance
8900 – psychological and structural level
8960 – extended resistance on the longer-term chart
Bearish Scenario:
A confirmed break and daily close below 8695 would weaken the bullish outlook and suggest deeper downside risk toward:
8640 – minor support
8600 – stronger support and potential demand zone
Outlook:
Bullish bias remains intact while the FTSE holds above 8695. A sustained break below this level could shift momentum to the downside in the short term.
This communication is for informational purposes only and should not be viewed as any form of recommendation as to a particular course of action or as investment advice. It is not intended as an offer or solicitation for the purchase or sale of any financial instrument or as an official confirmation of any transaction. Opinions, estimates and assumptions expressed herein are made as of the date of this communication and are subject to change without notice. This communication has been prepared based upon information, including market prices, data and other information, believed to be reliable; however, Trade Nation does not warrant its completeness or accuracy. All market prices and market data contained in or attached to this communication are indicative and subject to change without notice.

FTSE pivotal level at 8854The FTSE remains in a bullish trend, with recent price action showing signs of a corrective pullback within the broader uptrend.
Support Zone: 8695 – a key level from previous consolidation. Price is currently testing or approaching this level.
A bullish rebound from 8695 would confirm ongoing upside momentum, with potential targets at:
8854 – initial resistance
8900 – psychological and structural level
8960 – extended resistance on the longer-term chart
Bearish Scenario:
A confirmed break and daily close below 8695 would weaken the bullish outlook and suggest deeper downside risk toward:
8640 – minor support
8600 – stronger support and potential demand zone
Outlook:
Bullish bias remains intact while the FTSE holds above 8695. A sustained break below this level could shift momentum to the downside in the short term.
This communication is for informational purposes only and should not be viewed as any form of recommendation as to a particular course of action or as investment advice. It is not intended as an offer or solicitation for the purchase or sale of any financial instrument or as an official confirmation of any transaction. Opinions, estimates and assumptions expressed herein are made as of the date of this communication and are subject to change without notice. This communication has been prepared based upon information, including market prices, data and other information, believed to be reliable; however, Trade Nation does not warrant its completeness or accuracy. All market prices and market data contained in or attached to this communication are indicative and subject to change without notice.

FTSE INTRADAY bullish sideways consolidation Trend Overview:
The FTSE100 equity index remains in a bullish trend, characterised by higher highs and higher lows. The recent intraday price action is forming a continuation consolidation pattern, suggesting a potential pause before a renewed move higher.
Key Technical Levels:
Support: 8800 (primary pivot), followed by 8760 and 8700
Resistance: 8940 (initial), then 8977 and 9010
Technical Outlook:
A pullback to the 8800 level, which aligns with the previous consolidation zone, could act as a platform for renewed buying interest. A confirmed bounce from this support may trigger a continuation toward the next resistance levels at 8940, 8977, and ultimately 9010.
Conversely, a daily close below 8800 would suggest weakening bullish momentum. This scenario would shift the bias to bearish in the short term, potentially targeting 8760 and 8700 as downside levels.
Conclusion:
FTSE100 maintains a bullish structure while trading above the 8800 support. A bounce from this level would validate the consolidation as a continuation pattern, with upside potential toward the 8940 area. A breakdown below 8800, however, would invalidate this view and suggest deeper corrective risk.
This communication is for informational purposes only and should not be viewed as any form of recommendation as to a particular course of action or as investment advice. It is not intended as an offer or solicitation for the purchase or sale of any financial instrument or as an official confirmation of any transaction. Opinions, estimates and assumptions expressed herein are made as of the date of this communication and are subject to change without notice. This communication has been prepared based upon information, including market prices, data and other information, believed to be reliable; however, Trade Nation does not warrant its completeness or accuracy. All market prices and market data contained in or attached to this communication are indicative and subject to change without notice.

UK100 ShortManipulation in the Asian session, looking for price to retest higher supply then push down to the London and Asia low, this is a forecasted entry, entries will be based after 8am M5 candle opening.

GBIRYY - U.K Inflation (May/2025)ECONOMICS:GBIRYY
May/2025
source: Office for National Statistics
-The annual inflation rate in the UK edged down to 3.4% in May 2025 from 3.5% in April, matching expectations.
The largest downward contribution came from transport prices (0.7% vs 3.3%), reflecting falls in air fares (-5%) largely due to the timing of Easter and the associated school holidays, as well as falling motor fuel prices.
Additionally, the correction of an error in the Vehicle Excise Duty series contributed to the drop; the error affected April’s data, but the series has been corrected from May.
Further downward pressure came from cost for housing and household services (6.9% vs 7%), mostly owner occupiers' housing costs (6.7% vs 6.9%).
Services inflation also slowed to 4.7% from 5.4%. On the other hand, the largest, upward contributions came from food and non-alcoholic beverages (4.4% vs 3.4%), namely chocolate, confectionery and ice cream, and furniture and household goods (0.8%, the most since December 2023).
Compared to the previous month, the CPI rose 0.2%.

FTSE sideways consolidation supported at 8800Trend Overview:
The FTSE100 equity index remains in a bullish trend, characterised by higher highs and higher lows. The recent intraday price action is forming a continuation consolidation pattern, suggesting a potential pause before a renewed move higher.
Key Technical Levels:
Support: 8800 (primary pivot), followed by 8760 and 8700
Resistance: 8940 (initial), then 8977 and 9010
Technical Outlook:
A pullback to the 8800 level, which aligns with the previous consolidation zone, could act as a platform for renewed buying interest. A confirmed bounce from this support may trigger a continuation toward the next resistance levels at 8940, 8977, and ultimately 9010.
Conversely, a daily close below 8800 would suggest weakening bullish momentum. This scenario would shift the bias to bearish in the short term, potentially targeting 8760 and 8700 as downside levels.
Conclusion:
FTSE100 maintains a bullish structure while trading above the 8800 support. A bounce from this level would validate the consolidation as a continuation pattern, with upside potential toward the 8940 area. A breakdown below 8800, however, would invalidate this view and suggest deeper corrective risk.
This communication is for informational purposes only and should not be viewed as any form of recommendation as to a particular course of action or as investment advice. It is not intended as an offer or solicitation for the purchase or sale of any financial instrument or as an official confirmation of any transaction. Opinions, estimates and assumptions expressed herein are made as of the date of this communication and are subject to change without notice. This communication has been prepared based upon information, including market prices, data and other information, believed to be reliable; however, Trade Nation does not warrant its completeness or accuracy. All market prices and market data contained in or attached to this communication are indicative and subject to change without notice.
