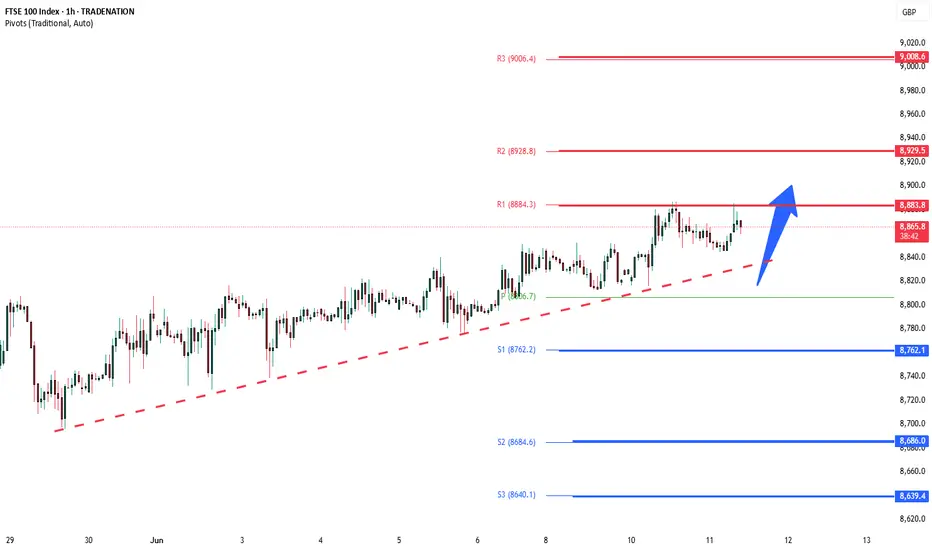
FTSE100 bullish sideways consolidation above 8800Trend Overview:
The FTSE100 equity index remains in a bullish trend, characterised by higher highs and higher lows. The recent intraday price action is forming a continuation consolidation pattern, suggesting a potential pause before a renewed move higher.
Key Technical Levels:
Support: 8800 (primary pivot), followed by 8760 and 8700
Resistance: 8940 (initial), then 8977 and 9010
Technical Outlook:
A pullback to the 8800 level, which aligns with the previous consolidation zone, could act as a platform for renewed buying interest. A confirmed bounce from this support may trigger a continuation toward the next resistance levels at 8940, 8977, and ultimately 9010.
Conversely, a daily close below 8800 would suggest weakening bullish momentum. This scenario would shift the bias to bearish in the short term, potentially targeting 8760 and 8700 as downside levels.
Conclusion:
FTSE100 maintains a bullish structure while trading above the 8800 support. A bounce from this level would validate the consolidation as a continuation pattern, with upside potential toward the 8940 area. A breakdown below 8800, however, would invalidate this view and suggest deeper corrective risk.
This communication is for informational purposes only and should not be viewed as any form of recommendation as to a particular course of action or as investment advice. It is not intended as an offer or solicitation for the purchase or sale of any financial instrument or as an official confirmation of any transaction. Opinions, estimates and assumptions expressed herein are made as of the date of this communication and are subject to change without notice. This communication has been prepared based upon information, including market prices, data and other information, believed to be reliable; however, Trade Nation does not warrant its completeness or accuracy. All market prices and market data contained in or attached to this communication are indicative and subject to change without notice.
UK100 CFD

FTSE INTRADAY sideways consolidation Overall trend remains bullish, supported by rising price action.
Recent Movement: Price is in a sideways consolidation phase after a strong uptrend.
Key Levels
Support:
8760 – Key level from prior consolidation.
8680, then 8640 – Next supports if 8680 breaks.
Resistance:
8830 – First upside target.
8930, then 9000 – Further resistance levels on continued strength.
Trading Scenarios
Bullish Scenario:
A pullback to 8760 followed by a bounce could lead to a move towards 8830, then higher to 8930 and 9000.
Bearish Scenario:
A confirmed break and daily close below 8760 would weaken the bullish case. In that case, expect a potential drop to 8680, then 8640.
Conclusion
The FTSE remains bullish, but a short-term pullback is possible. A bounce from 8760 would confirm trend strength. Watch 8680 closely — holding above favors bulls; a break below shifts sentiment to bearish.
This communication is for informational purposes only and should not be viewed as any form of recommendation as to a particular course of action or as investment advice. It is not intended as an offer or solicitation for the purchase or sale of any financial instrument or as an official confirmation of any transaction. Opinions, estimates and assumptions expressed herein are made as of the date of this communication and are subject to change without notice. This communication has been prepared based upon information, including market prices, data and other information, believed to be reliable; however, Trade Nation does not warrant its completeness or accuracy. All market prices and market data contained in or attached to this communication are indicative and subject to change without notice.

FTSE INTRADAY resistance retest Overall trend remains bullish, supported by rising price action.
Recent Movement: Price is in a sideways consolidation phase after a strong uptrend.
Key Levels
Support:
8760 – Key level from prior consolidation.
8680, then 8640 – Next supports if 8680 breaks.
Resistance:
8830 – First upside target.
8930, then 9000 – Further resistance levels on continued strength.
Trading Scenarios
Bullish Scenario:
A pullback to 8760 followed by a bounce could lead to a move towards 8830, then higher to 8930 and 9000.
Bearish Scenario:
A confirmed break and daily close below 8760 would weaken the bullish case. In that case, expect a potential drop to 8680, then 8640.
Conclusion
The FTSE remains bullish, but a short-term pullback is possible. A bounce from 8760 would confirm trend strength. Watch 8680 closely — holding above favors bulls; a break below shifts sentiment to bearish.
This communication is for informational purposes only and should not be viewed as any form of recommendation as to a particular course of action or as investment advice. It is not intended as an offer or solicitation for the purchase or sale of any financial instrument or as an official confirmation of any transaction. Opinions, estimates and assumptions expressed herein are made as of the date of this communication and are subject to change without notice. This communication has been prepared based upon information, including market prices, data and other information, believed to be reliable; however, Trade Nation does not warrant its completeness or accuracy. All market prices and market data contained in or attached to this communication are indicative and subject to change without notice.
FTSE 100 Surges Towards Record HighFTSE 100 Surges Towards Record High
Today saw the release of new data on the UK labour market.
According to official statistics, the number of payrolled employees in the UK fell by 55,000 (0.2%) between March and April 2025. Over the broader period from February to April 2025, the number declined by 78,000 (0.3%).
In response to the drop in employment, the UK’s FTSE 100 index (UK 100 on FXOpen) jumped sharply, rising close to the 8,900 mark — near its all-time high reached in early March this year.
Market participants likely interpreted the weakening labour market as an additional argument in favour of interest rate cuts by the Bank of England. Such a move would be seen as supportive of the economy and a bullish factor for equities.
Technical Analysis of the FTSE 100 (UK 100 on FXOpen)
From a technical perspective:
→ The FTSE 100 continues to trade within an ascending channel (shown in blue);
→ Today’s bullish momentum broke through the resistance line from below — a level that had previously capped the upward movement within the channel.
If the bulls can maintain the price above the 8,860 level, the likelihood increases for a continued uptrend and a potential new all-time high for the FTSE 100 index.
This article represents the opinion of the Companies operating under the FXOpen brand only. It is not to be construed as an offer, solicitation, or recommendation with respect to products and services provided by the Companies operating under the FXOpen brand, nor is it to be considered financial advice.

FTSE INTRADAY Bullish above support at 8760Overall trend remains bullish, supported by rising price action.
Recent Movement: Price is in a sideways consolidation phase after a strong uptrend.
Key Levels
Support:
8760 – Key level from prior consolidation.
8680, then 8640 – Next supports if 8680 breaks.
Resistance:
8830 – First upside target.
8930, then 9000 – Further resistance levels on continued strength.
Trading Scenarios
Bullish Scenario:
A pullback to 8760 followed by a bounce could lead to a move towards 8830, then higher to 8930 and 9000.
Bearish Scenario:
A confirmed break and daily close below 8760 would weaken the bullish case. In that case, expect a potential drop to 8680, then 8640.
Conclusion
The FTSE remains bullish, but a short-term pullback is possible. A bounce from 8760 would confirm trend strength. Watch 8680 closely — holding above favors bulls; a break below shifts sentiment to bearish.
This communication is for informational purposes only and should not be viewed as any form of recommendation as to a particular course of action or as investment advice. It is not intended as an offer or solicitation for the purchase or sale of any financial instrument or as an official confirmation of any transaction. Opinions, estimates and assumptions expressed herein are made as of the date of this communication and are subject to change without notice. This communication has been prepared based upon information, including market prices, data and other information, believed to be reliable; however, Trade Nation does not warrant its completeness or accuracy. All market prices and market data contained in or attached to this communication are indicative and subject to change without notice.

FTSE100 sideways consolidation capped at 8850Overall trend remains bullish, supported by rising price action.
Recent Movement: Price is in a sideways consolidation phase after a strong uptrend.
Key Levels
Support:
8680 – Key level from prior consolidation.
8625, then 8510 – Next supports if 8680 breaks.
Resistance:
8850 – First upside target.
8910, then 9020 – Further resistance levels on continued strength.
Trading Scenarios
Bullish Scenario:
A pullback to 8680 followed by a bounce could lead to a move towards 8850, then higher to 8910 and 9020.
Bearish Scenario:
A confirmed break and daily close below 8680 would weaken the bullish case. In that case, expect a potential drop to 8625, then 8510.
Conclusion
The FTSE remains bullish, but a short-term pullback is possible. A bounce from 8680 would confirm trend strength. Watch 8680 closely — holding above favors bulls; a break below shifts sentiment to bearish.
This communication is for informational purposes only and should not be viewed as any form of recommendation as to a particular course of action or as investment advice. It is not intended as an offer or solicitation for the purchase or sale of any financial instrument or as an official confirmation of any transaction. Opinions, estimates and assumptions expressed herein are made as of the date of this communication and are subject to change without notice. This communication has been prepared based upon information, including market prices, data and other information, believed to be reliable; however, Trade Nation does not warrant its completeness or accuracy. All market prices and market data contained in or attached to this communication are indicative and subject to change without notice.

UK100/FTSE100 - FOLLOW THIS STRUCTURE, SURELY YOU MAKE PROFITTeam, last night for the first time I make LIVE trading on video.
Everyday i did LIVE trading but not recording
last night we have SHORT EURUSD, LONG USDCHF, LONG US30 LONG NAS AND SHORT GOLD - 5/5 perfectly hit target
Today I want to show you the structure how we can deal with UK100/FTSE100
SHORT UK at 8817-26 - double up at 8846-62
lets set this LIMIT ORDER IN
Target 1 at 8792-96
Target 2 at 8776-8755
Lets kill the market tonight!

FTSE100 INTRADAY key trading level at 8680Trend: Overall trend remains bullish, supported by rising price action.
Recent Movement: Price is in a sideways consolidation phase after a strong uptrend.
Key Levels
Support:
8680 – Key level from prior consolidation.
8625, then 8510 – Next supports if 8680 breaks.
Resistance:
8850 – First upside target.
8910, then 9020 – Further resistance levels on continued strength.
Trading Scenarios
Bullish Scenario:
A pullback to 8680 followed by a bounce could lead to a move towards 8850, then higher to 8910 and 9020.
Bearish Scenario:
A confirmed break and daily close below 8680 would weaken the bullish case. In that case, expect a potential drop to 8625, then 8510.
Conclusion
The FTSE remains bullish, but a short-term pullback is possible. A bounce from 8680 would confirm trend strength. Watch 8680 closely — holding above favors bulls; a break below shifts sentiment to bearish.
This communication is for informational purposes only and should not be viewed as any form of recommendation as to a particular course of action or as investment advice. It is not intended as an offer or solicitation for the purchase or sale of any financial instrument or as an official confirmation of any transaction. Opinions, estimates and assumptions expressed herein are made as of the date of this communication and are subject to change without notice. This communication has been prepared based upon information, including market prices, data and other information, believed to be reliable; however, Trade Nation does not warrant its completeness or accuracy. All market prices and market data contained in or attached to this communication are indicative and subject to change without notice.

FTSE INTRADAY sideways consolidation supported at 8680Trend: Overall trend remains bullish, supported by rising price action.
Recent Movement: Price is in a sideways consolidation phase after a strong uptrend.
Key Levels
Support:
8680 – Key level from prior consolidation.
8625, then 8510 – Next supports if 8680 breaks.
Resistance:
8850 – First upside target.
8910, then 9020 – Further resistance levels on continued strength.
Trading Scenarios
Bullish Scenario:
A pullback to 8680 followed by a bounce could lead to a move towards 8850, then higher to 8910 and 9020.
Bearish Scenario:
A confirmed break and daily close below 8680 would weaken the bullish case. In that case, expect a potential drop to 8625, then 8510.
Conclusion
The FTSE remains bullish, but a short-term pullback is possible. A bounce from 8680 would confirm trend strength. Watch 8680 closely — holding above favors bulls; a break below shifts sentiment to bearish.
This communication is for informational purposes only and should not be viewed as any form of recommendation as to a particular course of action or as investment advice. It is not intended as an offer or solicitation for the purchase or sale of any financial instrument or as an official confirmation of any transaction. Opinions, estimates and assumptions expressed herein are made as of the date of this communication and are subject to change without notice. This communication has been prepared based upon information, including market prices, data and other information, believed to be reliable; however, Trade Nation does not warrant its completeness or accuracy. All market prices and market data contained in or attached to this communication are indicative and subject to change without notice.

FTSE INTRADAY bullish uptrend consolidation supported at 8600Trend: Overall trend remains bullish, supported by rising price action.
Recent Movement: Price is in a sideways consolidation phase after a strong uptrend.
Key Levels
Support:
8600 – Key level from prior consolidation.
8480, then 8430 – Next supports if 8600 breaks.
Resistance:
8850 – First upside target.
8910, then 9020 – Further resistance levels on continued strength.
Trading Scenarios
Bullish Scenario:
A pullback to 8600 followed by a bounce could lead to a move towards 8850, then higher to 8910 and 9020.
Bearish Scenario:
A confirmed break and daily close below 8600 would weaken the bullish case. In that case, expect a potential drop to 8480, then 8430.
Conclusion
The FTSE remains bullish, but a short-term pullback is possible. A bounce from 8600 would confirm trend strength. Watch 8600 closely — holding above favors bulls; a break below shifts sentiment to bearish.
This communication is for informational purposes only and should not be viewed as any form of recommendation as to a particular course of action or as investment advice. It is not intended as an offer or solicitation for the purchase or sale of any financial instrument or as an official confirmation of any transaction. Opinions, estimates and assumptions expressed herein are made as of the date of this communication and are subject to change without notice. This communication has been prepared based upon information, including market prices, data and other information, believed to be reliable; however, Trade Nation does not warrant its completeness or accuracy. All market prices and market data contained in or attached to this communication are indicative and subject to change without notice.

"UK100 Grand Heist: Bullish Loot Plan with Thief Trading Style!🌍 Hello, Global Wealth Warriors! Ciao, Salut, Guten Tag, Ola! 🌟
Fellow Profit Pirates & Market Mavericks, 💸⚡
Unveiling our cunning blueprint to plunder the "UK100/FTSE100" Index Market, crafted with 🔥Thief Trading’s razor-sharp technical and fundamental insights🔥. Stick to the chart’s game plan, zoned in on a long entry. Our mission? Slip out near the high-stakes ATR Zone Level—a perilous spot with overbought vibes, consolidation, trend flips, and traps where bearish bandits lurk. 🏴☠️💰 Celebrate your wins, traders—you’ve earned it! 🎉
📈 **Entry Point**: The vault’s unlocked! Grab the bullish bounty at current prices—the heist is live!
💡 Pro Tip: Set buy limit orders on a 15 or 30-minute timeframe, targeting recent or swing lows/highs. Don’t forget to set chart alerts for precision! 🚨
🛑 **Stop Loss**:
📍 Thief SL parked at the recent/swing low on the 4H timeframe (8500.0) for day/swing trades.
📍 Tailor your SL to your risk appetite, lot size, and number of orders. Stay sharp!
🎯 **Target**: Aim for 8850.0 or make a swift exit just before.
👀 **Scalpers, Listen Up**: Stick to long-side scalping. Got deep pockets? Dive in now! Otherwise, join swing traders for the grand heist. Use trailing SL to shield your loot. 💰
💹 **Market Pulse**: The UK100/FTSE100 is in a neutral zone but leaning bullish, fueled by key drivers. ☝
🌐 Dive into fundamentals—macro economics, COT reports, geopolitical updates, sentiment, intermarket analysis, and index-specific trends. Check the linkss for the full scoop! 🔗🌍
⚠️ **Trading Alert**: News can shake the market! 📰
🔐 Protect your positions:
- Pause new trades during news releases.
- Use trailing stop-loss to lock in gains.
💪 **Join the Heist**: Smash the Boost Button to supercharge our robbery squad! 💥 With Thief Trading Style, we rake in profits daily with ease. 🚀 Your support fuels our market conquests. 🤝❤️
Stay tuned for the next daring heist, money makers! 🤑🐱👤🎯

FTSE INTRADAY bullish continuaation breakoutThe FTSE 100 is showing bullish momentum, supported by an ongoing uptrend. Recent price action suggests a breakout above a period of sideways consolidation, indicating strong buying interest.
Key Support: 8590 – This was the previous consolidation zone and now acts as a critical level.
If the index pulls back to 8590 and holds, it may resume the uptrend with potential upside targets at:
8810 (near-term resistance)
8850, then 8920 (longer-term targets)
Bearish Scenario: A daily close below 8590 would weaken the bullish case and could lead to a decline toward:
8480 (next support)
Then 8420 if selling pressure increases
Conclusion:
The FTSE 100 remains bullish above 8590. Watch for a bounce from this level to confirm further upside. A break below would shift the outlook to bearish in the short term.
This communication is for informational purposes only and should not be viewed as any form of recommendation as to a particular course of action or as investment advice. It is not intended as an offer or solicitation for the purchase or sale of any financial instrument or as an official confirmation of any transaction. Opinions, estimates and assumptions expressed herein are made as of the date of this communication and are subject to change without notice. This communication has been prepared based upon information, including market prices, data and other information, believed to be reliable; however, Trade Nation does not warrant its completeness or accuracy. All market prices and market data contained in or attached to this communication are indicative and subject to change without notice.

Risk-Off Mode: Indices Under Pressure, VIX Breakout in Play!🌍 Indices Under Pressure as Volatility Spikes – Market Analysis (May 22, 2025) 🚨
My TradingView multi-chart workspace is tracking major global indices alongside the VIX (bottom right). The visual tells the story: broad-based selling is hitting equities, and the VIX is on the rise, signaling a clear risk-off environment.
Key Observations:
Indices in the Red:
All major indices in my workspace are under pressure, with sharp declines across the S&P 500, NASDAQ, Dow, DAX, and others. This aligns with today’s global heatmaps, which are flashing red across sectors and regions. The selling is broad, not just isolated to tech or cyclicals.
VIX Volatility Index Elevated:
The VIX (CBOE Volatility Index) is spiking, up over 15% today and holding above the 20 level (FXEmpire). This “fear gauge” confirms that traders are hedging aggressively and bracing for more turbulence. Historically, a rising VIX alongside falling indices is a classic sign of heightened uncertainty and potential for further downside.
Macro & Geopolitical Backdrop:
The selling pressure is fueled by persistent US-China trade tensions, new tariffs, and a lack of clear central bank support. The White House remains firm on its trade stance, while the Fed is not signaling imminent rate cuts (VT Markets). This policy vacuum is amplifying volatility and risk aversion.
Global Sentiment:
Asian and European markets are also deep in the red, with historic single-day losses in some indices. The “Magnificent Seven” US tech stocks have entered bear market territory, and even traditional safe havens like gold are seeing some liquidation as investors scramble for cash.
What’s Next?
Short-Term Outlook:
With the VIX elevated and indices breaking key support levels, expect continued choppiness and possible further downside. Macro data releases and any shift in trade rhetoric will be key catalysts. Defensive positioning and risk management are crucial in this environment.
Potential for Rebound:
If we see a de-escalation in trade tensions or dovish signals from central banks, a relief rally is possible. But for now, the path of least resistance appears lower, with volatility likely to remain high.
Summary:
The charts don’t lie – indices are under heavy selling pressure, and the VIX is confirming a risk-off mood. Stay nimble, watch for headline risks, and be prepared for more volatility in the days ahead. 📉🟥⚡

FTSE INTRADAY bullish breakout continuation above 8590The FTSE 100 is showing bullish momentum, supported by an ongoing uptrend. Recent price action suggests a breakout above a period of sideways consolidation, indicating strong buying interest.
Key Support: 8590 – This was the previous consolidation zone and now acts as a critical level.
If the index pulls back to 8590 and holds, it may resume the uptrend with potential upside targets at:
8810 (near-term resistance)
8850, then 8920 (longer-term targets)
Bearish Scenario: A daily close below 8590 would weaken the bullish case and could lead to a decline toward:
8480 (next support)
Then 8420 if selling pressure increases
Conclusion:
The FTSE 100 remains bullish above 8590. Watch for a bounce from this level to confirm further upside. A break below would shift the outlook to bearish in the short term.
This communication is for informational purposes only and should not be viewed as any form of recommendation as to a particular course of action or as investment advice. It is not intended as an offer or solicitation for the purchase or sale of any financial instrument or as an official confirmation of any transaction. Opinions, estimates and assumptions expressed herein are made as of the date of this communication and are subject to change without notice. This communication has been prepared based upon information, including market prices, data and other information, believed to be reliable; however, Trade Nation does not warrant its completeness or accuracy. All market prices and market data contained in or attached to this communication are indicative and subject to change without notice.
FTSE 100: Bearish Order flowBearish Crab Pattern via the 1H timeframe. Let's see how this plays out.
There's also an order block at the bottom on the H4 timeframe. Maybe price could go bearish to mitigate it. As they say, false move beginning of the week.

Potential Buy Zone on FTSEI have several swing trade zones marked up on the FTSE, here's one of them.
Potential Buy Zone for the FTSEI have several swing trade zones marked up on the FTSE, here's one of them.

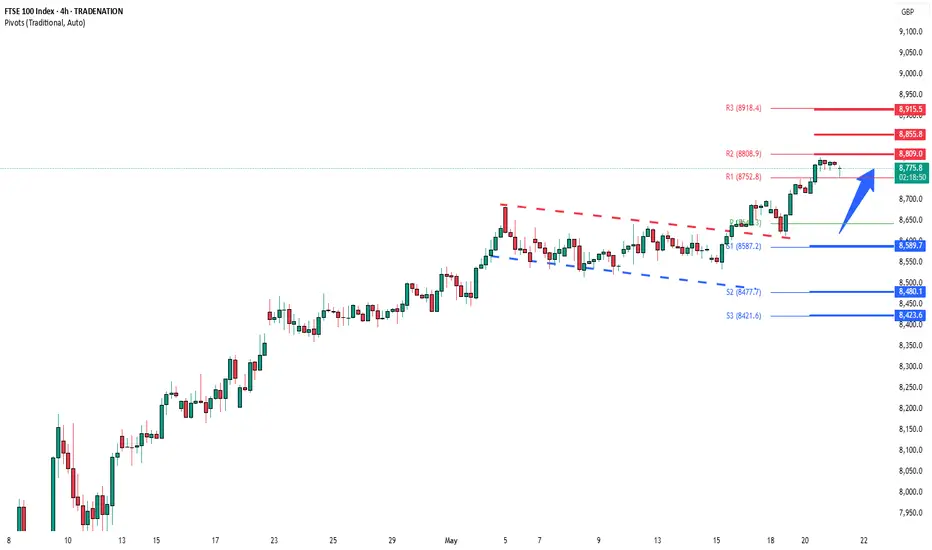
Can FTSE100 keep the momentum all the way to the all-time high?The FTSE:UKX bulls continue to show resilience and push the index higher. But the big question is, can we see a move all the way to the current all-time high?
Let's dig in...
MARKETSCOM:UK100
Let us know what you think in the comments below.
Thank you.
77.3% of retail investor accounts lose money when trading CFDs with this provider. You should consider whether you understand how CFDs work and whether you can afford to take the high risk of losing your money. Past performance is not necessarily indicative of future results. The value of investments may fall as well as rise and the investor may not get back the amount initially invested. This content is not intended for nor applicable to residents of the UK. Cryptocurrency CFDs and spread bets are restricted in the UK for all retail clients.

FTSE100 INTRADAY sideways consolidation supported at 8454The FTSE 100 is showing bullish momentum, supported by an ongoing uptrend. Recent price action suggests a breakout above a period of sideways consolidation, indicating strong buying interest.
Key Support: 8454 – This was the previous consolidation zone and now acts as a critical level.
If the index pulls back to 8454 and holds, it may resume the uptrend with potential upside targets at:
8650 (near-term resistance)
8730, then 8825 (longer-term targets)
Bearish Scenario: A daily close below 8454 would weaken the bullish case and could lead to a decline toward:
8373 (next support)
Then 8272 and possibly 8100 if selling pressure increases
Conclusion:
The FTSE 100 remains bullish above 8454. Watch for a bounce from this level to confirm further upside. A break below would shift the outlook to bearish in the short term.
This communication is for informational purposes only and should not be viewed as any form of recommendation as to a particular course of action or as investment advice. It is not intended as an offer or solicitation for the purchase or sale of any financial instrument or as an official confirmation of any transaction. Opinions, estimates and assumptions expressed herein are made as of the date of this communication and are subject to change without notice. This communication has been prepared based upon information, including market prices, data and other information, believed to be reliable; however, Trade Nation does not warrant its completeness or accuracy. All market prices and market data contained in or attached to this communication are indicative and subject to change without notice.

UK100 - time to SHORT and send UK into recession.SHORT UK100 at 8610, add more at 8622, (8638-42) and 8667-71)
Target 1 at 8592-8285
Target 2 at 8571-8564
Target 3 at 8549-8339
Once it hit first target, take 30% partial and bring stop loss to BE
It time to kill the UK100 and send them into recession.

$GBINTR -BoE Cuts Rates as Expected (May/2025)ECONOMICS:GBINTR
May/2025
source: Bank of England
- The Bank of England cut the Bank Rate by 25 basis points to 4.25%,
matching expectations but revealing a split 5–4 vote.
Two policymakers favored a deeper 50 bps cut, while two others wanted to hold at 4.5%.
It was the fourth cut since August 2024, amid concerns over slowing growth linked to Trump-era tariffs.

FTSE INTRADAY Bullish Flag continuation pattern?The FTSE 100 is showing bullish momentum, supported by an ongoing uptrend. Recent price action suggests a breakout above a period of sideways consolidation, indicating strong buying interest.
Key Support: 8454 – This was the previous consolidation zone and now acts as a critical level.
If the index pulls back to 8454 and holds, it may resume the uptrend with potential upside targets at:
8650 (near-term resistance)
8730, then 8825 (longer-term targets)
Bearish Scenario: A daily close below 8454 would weaken the bullish case and could lead to a decline toward:
8373 (next support)
Then 8272 and possibly 8100 if selling pressure increases
Conclusion:
The FTSE 100 remains bullish above 8454. Watch for a bounce from this level to confirm further upside. A break below would shift the outlook to bearish in the short term.
This communication is for informational purposes only and should not be viewed as any form of recommendation as to a particular course of action or as investment advice. It is not intended as an offer or solicitation for the purchase or sale of any financial instrument or as an official confirmation of any transaction. Opinions, estimates and assumptions expressed herein are made as of the date of this communication and are subject to change without notice. This communication has been prepared based upon information, including market prices, data and other information, believed to be reliable; however, Trade Nation does not warrant its completeness or accuracy. All market prices and market data contained in or attached to this communication are indicative and subject to change without notice.

FTSE 100 H4 | Potential bullish bounceThe FTSE 100 (UK100) is falling towards an overlap support and could potentially bounce off this level to climb higher.
Buy entry is at 8,474.09 which is an overlap support that aligns close to the 23.6% Fibonacci retracement.
Stop loss is at 8,150.00 which is a level that lies underneath an overlap support.
Take profit is at 8,744.02 which is a multi-swing-high resistance.
High Risk Investment Warning
Trading Forex/CFDs on margin carries a high level of risk and may not be suitable for all investors. Leverage can work against you.
Stratos Markets Limited (tradu.com):
CFDs are complex instruments and come with a high risk of losing money rapidly due to leverage. 63% of retail investor accounts lose money when trading CFDs with this provider. You should consider whether you understand how CFDs work and whether you can afford to take the high risk of losing your money.
Stratos Europe Ltd (tradu.com):
CFDs are complex instruments and come with a high risk of losing money rapidly due to leverage. 63% of retail investor accounts lose money when trading CFDs with this provider. You should consider whether you understand how CFDs work and whether you can afford to take the high risk of losing your money.
Stratos Global LLC (tradu.com):
Losses can exceed deposits.
Please be advised that the information presented on TradingView is provided to Tradu (‘Company’, ‘we’) by a third-party provider (‘TFA Global Pte Ltd’). Please be reminded that you are solely responsible for the trading decisions on your account. There is a very high degree of risk involved in trading. Any information and/or content is intended entirely for research, educational and informational purposes only and does not constitute investment or consultation advice or investment strategy. The information is not tailored to the investment needs of any specific person and therefore does not involve a consideration of any of the investment objectives, financial situation or needs of any viewer that may receive it. Kindly also note that past performance is not a reliable indicator of future results. Actual results may differ materially from those anticipated in forward-looking or past performance statements. We assume no liability as to the accuracy or completeness of any of the information and/or content provided herein and the Company cannot be held responsible for any omission, mistake nor for any loss or damage including without limitation to any loss of profit which may arise from reliance on any information supplied by TFA Global Pte Ltd.
The speaker(s) is neither an employee, agent nor representative of Tradu and is therefore acting independently. The opinions given are their own, constitute general market commentary, and do not constitute the opinion or advice of Tradu or any form of personal or investment advice. Tradu neither endorses nor guarantees offerings of third-party speakers, nor is Tradu responsible for the content, veracity or opinions of third-party speakers, presenters or participants.
